EXAMINING THE DIRECT, INDIRECT, AND MODERATED EFFECTS OF NEIGHBORHOOD CHARACTERISTICS ON TRAJECTORIES OF DATING VIOLENCE
PERPETRATION
Ling-Yin Chang
A dissertation submitted to the faculty at the University of North Carolina at Chapel Hill in partial fulfillment of the requirements for the degree of Doctor of Philosophy in the Department
of Health Behavior in the Gillings School of Global Public Health.
Chapel Hill 2014
Approved by:
Vangie A. Foshee
Susan T. Ennett
H. Luz McNaughton Reyes
Carolyn Halpern
iii ABSTRACT
Ling-Yin Chang: Examining the direct, indirect, and moderated effects of neighborhood characteristics on trajectories of dating violence perpetration
(Under the direction of Vangie A. Foshee)
Purpose: This dissertation examined how and under what circumstances neighborhood characteristics influence the development of dating violence perpetration from grades 8 to 12. Specifically, Study 1 examined the direct effects of three types of neighborhood characteristics (structural factors, collective efficacy, and physical disorder) on dating violence perpetration trajectories, after controlling for individual covariates. Study 2 explored the moderating and mediating role of collective efficacy in the relationships between other neighborhood characteristics being examined and adolescent dating violence perpetration trajectories after taking into account individual controls.
Methods: Adolescent data were drawn from the final four waves of the Context/Linkages Study; neighborhood data were collected from wave three parents’ interviews and U.S. Census data. Multilevel growth curve models were conducted with 3,218 students to examine the direct, indirect, and moderated effects of neighborhood characteristics on dating violence perpetration trajectories. The sample was 50% male, 41% White, 50% Black, and 9% Other race/ethnicity.
iv
violence perpetration. This association, however, was significant for girls but not for boys, and was only significant on initial levels but not slopes of dating violence perpetration trajectories. In terms of the role of collective efficacy, results of Study 2 showed that collective efficacy did not moderate or mediate the relationships between other neighborhood risk factors and dating violence perpetration for either girls or boys.
v
vi
ACKNOWLEDGEMENTS
Many thanks to my parents for supporting me to study abroad. I could not have come this
far without their love, patience, and sacrifice. I also want to give thanks to my boyfriend,
Chung-Ping Wang, and my best friend, Pei-Ying Wu, as well as other friends for their comfort and
encouragement over the past four years.
Completing this dissertation would not have been possible without the help of my
committee members: Vangie Foshee, Susan Ennett, Heathe Luz McNaughton Reyes, Carolyn
Halpern, and Michael J. Shanahan. Thanks to each of them for their guidance and support. I am
very grateful to have had them all on my committee. I want to give special thanks to my advisor,
Vangie Foshee, who guided me through the writing of my dissertation and provided me with a
lot of opportunities to grow into a better researcher. For the dissertation analyses, I want to thank
Thad Benefield for his kindness in answering all of my questions, as well as for his analytical
assistance. Finally, thanks to my editor, Kay Robin Alexander, forher careful eye.
Support for this dissertation research was provided by the Fulbright Scholarship awarded
by Institute of International Education, and by the Studying Abroad Scholarship awarded by the
Ministry of Education of Taiwan, as well as by the Dissertation Completion Fellowship awarded
by the Graduate School of University of North Carolina at Chapel Hill. The study that provided
the data for this dissertation was funded by the National Institute on Drug Abuse (R01 DA13459,
S. T. Ennett, PI) and the Centers for Disease Control and Prevention (R49 CCV423114, V. A.
vii
TABLE OF CONTENTS
LIST OF TABLES ... ix
LIST OF FIGURES ... x
Chapter 1: Dissertation Overview ... 1
Chapter 2: Background Information ... 5
The problem of adolescent dating violence perpetration ... 5
Dating Violence Trajectories as the Outcome ... 6
Studying Neighborhood Influences From A Developmental Perspective ... 7
Neighborhood Influences ... 8
Methodological Issues ... 13
Chapter 3: The Relationships between Neighborhood Characteristics and Physical Dating Violence Perpetration Trajectories (Study 1) ... 27
Introduction ... 27
Neighborhood Structural Characteristics and Adolescent Risk ... 28
Neighborhood Collective Efficacy and Adolescent Risk ... 33
Neighborhood Physical Disorder and Adolescent Risk ... 36
Sex Differences in Neighborhood Effects ... 40
Methods ... 43
The Context/Linkage Study Design and Data Collection ... 43
Study Sample ... 45
Measures ... 47
Analysis Strategy ... 51
viii
Descriptive Statistics... 58
Unconditional Model ... 62
Individual Neighborhood Effects on Dating Violence Perpetration ... 65
Neighborhood Characteristics on Dating Violence Perpetration, Adjusting for the Effects of the Other Neighborhood Characteristics ... 71
Discussion ... 73
Chapter 4: The Relationships between Neighborhood Characteristics and Dating Violence Perpetration Trajectories: The moderating and mediating effects of collective efficacy (Study 2) ... 84
Introduction ... 84
Collective Efficacy as a Moderator in the Relationships between Neighborhood Characteristics and Dating Violence Perpetration (Aim 1) ... 86
Collective Efficacy as a Mediator in the Relationships between Neighborhood Characteristics and Dating Violence Perpetration (Aim 2) ... 92
Methods ... 97
Statistical Analysis ... 97
Results ... 102
Descriptive Statistics... 102
Unconditional Model ... 104
Moderation ... 107
Mediation ... 107
Discussion ... 113
DISSERTATION SUMMARY ... 120
APPENDIX 1: THE MULTIVARIATE WALD TESTS RESULTS FOR MODELS TESTING SETS OF INTERACTIONS IN STUDY 1 ... 122
APPENDIX 2: THE MULTIVARIATE WALD TESTS RESULTS FOR MODELS TESTING SETS OF INTERACTIONS IN STUDY 2 (N=1,623) ... 123
ix
LIST OF TABLES
Table 1. Neighborhood Research Reviewed in Current Study ... 16 Table 2. Study Design ... 45
Table 3. Descriptive Statistics for Variables Comprising Neighborhood
Structural Characteristics (N=3,218) ... 49 Table 4. Percent of Adolescents Living in Neighborhoods with Different Levels of
Risk/Protective Factors ... 59
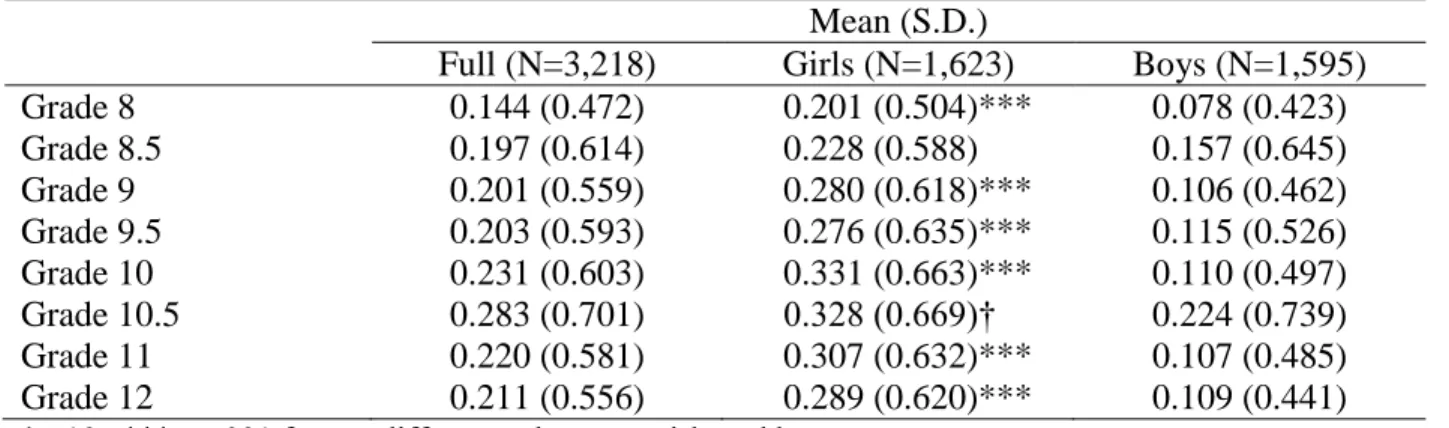
Table 5. Log-Mean and Standard Deviation of Physical Dating Violence
Perpetration from Grades 8 to 12 ... 60 Table 6. Bivariate Correlations Between Neighborhood Variables and
Dating Violence Perpetration Across Grades ... 61
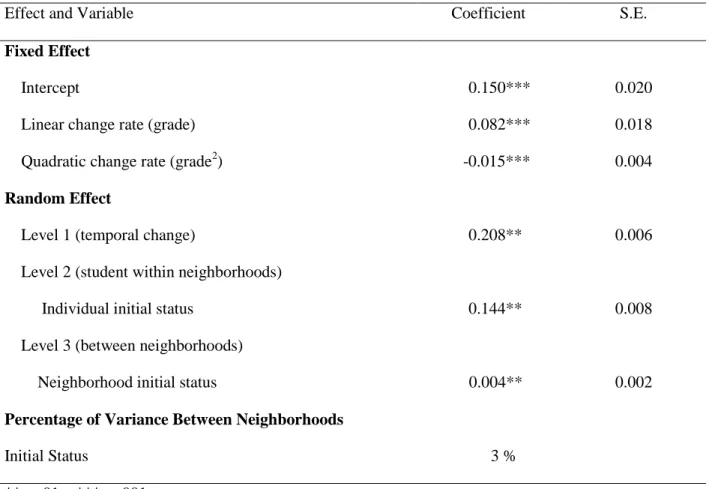
Table 7. Unconditional Models of Physical Dating Violence Perpetration
from Grades 8 to 12 ... 63
Table 8. Individual Neighborhood Fixed Effect on Physical Dating
Violence Perpetration (Reduced Model) ... 68
Table 9. Neighborhood Effects on Physical Dating Violence Perpetration ... 72 Table 10. Bivariate Correlations Between Neighborhood Variables and
Dating Violence Perpetration Across All Grades ... 103
Table 11. Sex-stratified Unconditional Models of Physical Dating Violence
Perpetration from Grade 8 to Grade 12 ... 105
Table 12. Sex-Stratified Models of Collective Efficacy as a Moderator of the Effects of Other Neighborhood Variables on Physical Dating Violence Perpetration from Grades 8 to 12 ... 109 Table 13. Step 1 Models of Collective Efficacy as a Mediator of the Effects of Other
Neighborhood Variables on Physical Dating Violence Perpetration from Grades 8 to 12 ... 110
x
LIST OF FIGURES
Figure 1. Conceptual Model of Study 1 ... 27
Figure 2. Model-implied Mean Trajectories for Physical Dating Violence Perpetration across Grades 8 through 12. ... 64
Figure 3. Sex Differences in the Effects of Neighborhood Structural Characteristics on Physical Dating Violence Perpetration across Grades 8 through 12 ... 69
Figure 4. Sex Differences in the Effects of Neighborhood Collective Efficacy on Physical Dating Violence Perpetration across Grades 8 through 12 ... 70
Figure 5. Sex Differences in the Effects of Neighborhood Physical Disorder on Physical Dating Violence Perpetration across Grades 8 through 12 ... 70
Figure 6. Moderated effect (Dash line) and mediated (Solid line) of neighborhood collective efficacy ... 86
Figure 7. The moderated effect of neighborhood collective efficacy ... 87
Figure 8. The mediated effect of neighborhood collective efficacy ... 92
Figure 9. Mediation Model ... 101
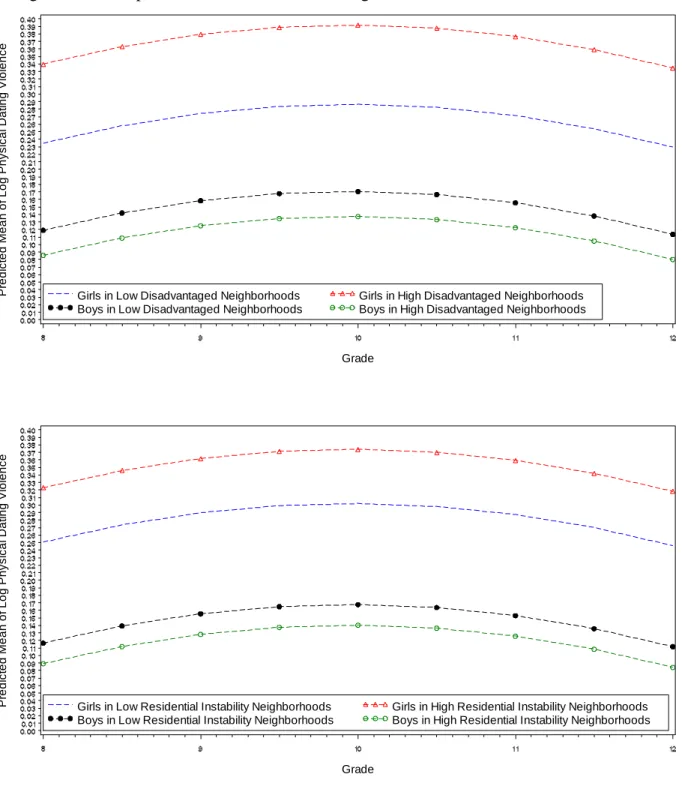
Figure 10. Sex-Stratified Model-Implied Mean Trajectories of Physical Dating Violence Perpetration from Grade 8 through Grade 12 ... 106
1
Chapter 1: Dissertation Overview
Adolescent dating violence is a major public health concern in the United States. Local
studies report that the prevalence of dating violence perpetration ranges between 14% and 82%
for psychological abuse and 11% to 41% for physical abuse (Foshee & Matthew, 2007). A study
of 6th graders found that 42% of those with a recent boyfriend or girlfriend reported having been
victimized and 28.6% reported perpetration of physical dating violence (Simon, Miller,
Gorman-Smith, Orpinas, & Sullivan, 2010). These high prevalence estimates suggest that dating violence
is common in early dating relationships. Evidence also indicates that dating violence perpetration
is associated with other negative outcomes including depression, suicidal thoughts, sexual
behavior, substance use, and other types of violence behavior (Banyard & Cross, 2008; Bossarte,
Simon, & Swahn, 2008; Kim-Godwin, Clements, McCuiston, & Fox, 2009).
Child and adolescent health behaviors are influenced by multiple contexts, including
families, peers, schools and neighborhoods (Valois, MacDonald, Bretous, & Fischer, 2002).
However, less attention has been given to the effects of the neighborhood on adolescent health
and the underlying mechanisms of neighborhood influence (Gibson, Morris, & Beaver, 2009;
Kawachi & Berkman, 2003). O’Campo et al. (1995) suggest that targeting individual risk factors
through prevention interventions without considering neighborhood effects may minimize the
effectiveness of intervention efforts. Neighborhood characteristics have been found to be
associated with multiple adolescent risk behaviors, including delinquency (De Coster, Heimer, &
Wittrock, 2006), violent behavior (Reyes et al., 2008; Widome, Sieving, Harpin, & Hearst, 2008),
(Karriker-2
Jaffe, Foshee, Ennett, & Suchindran, 2009; Vanfossen, Brown, Kellam, Sokoloff, & Doering,
2010).
Although neighborhood characteristics have been found to influence many adolescent
behaviors that are related to adolescent dating violence, as well as other contextual and
individual-level factors that are predictive of dating violence, few studies have explored the
relationship between neighborhood characteristics and perpetration of adolescent dating violence.
The few that have were cross-sectional or examined only short-term impacts on behavior
(Shulruf, Morton, Goodyear-Smith, O'Loughlin, & Dixon, 2007) without illuminating the
influences of neighborhoods on the development (or trajectories) of dating violence perpetration
across adolescence. In addition, these studies often focused on the association between one
particular neighborhood factor and the outcome without examining or controlling for the effects
of other neighborhood characteristics.
This dissertation examined how and under what circumstances neighborhood
characteristics influence the development of dating violence perpetration from grades 8 to 12.
Two studies were conducted to examine the direct, indirect and moderated effects of
neighborhood characteristics on the development of adolescent physical dating violence
perpetration above and beyond individual characteristics using multilevel growth curve modeling.
Study 1 aims to determine whether three types of neighborhood characteristics -
structural factors, collective efficacy, and physical disorder - influence the trajectory (intercept
and slope) of physical dating violence perpetration after controlling for demographic covariates.
Study 2 aims to examine the moderating and mediating effect of collective efficacy in the
relationships between the other neighborhood characteristics being examined and dating violence
3
buffers the negative effect of neighborhood structural characteristics and physical disorder on
dating violence perpetration trajectories; or (2) mediates the relationships between structural
characteristics and physical dating violence perpetration trajectories, and between physical
disorder and dating violence perpetration trajectories.
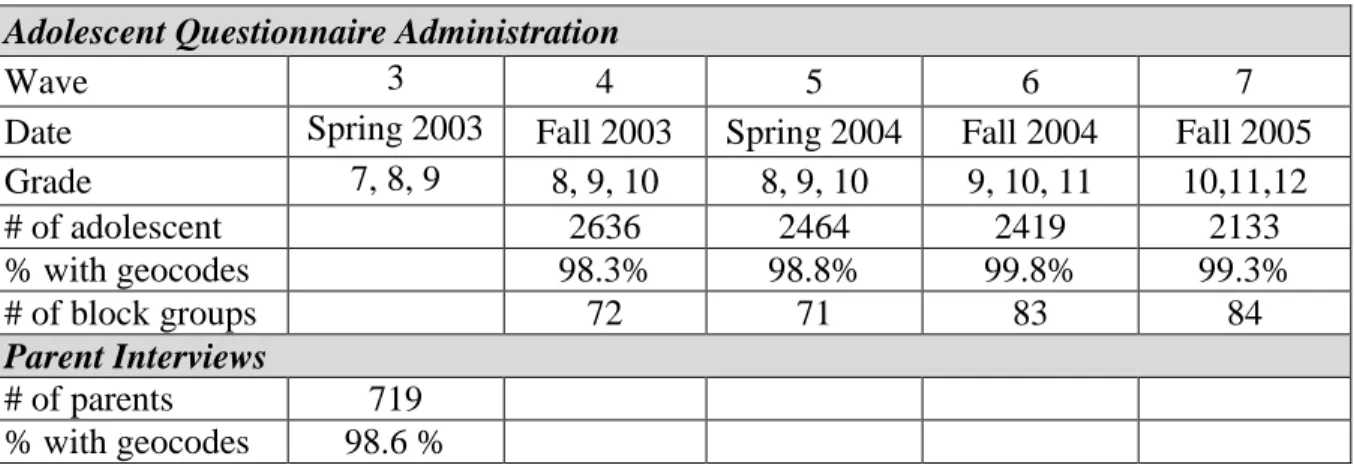
Data for both of these studies were drawn from two linked studies of adolescent
substance use and violence: the Context of Adolescent Substance Use study (National Institute on Drug Abuse, R01 DA13459, PI:Dr. Susan Ennett) and the Violence Against Peers, Dates and Selves: A Developmental Focus study (Centers for Disease Control and Prevention, R49 CCV423114, PI: Dr. Vangie Foshee). Together these studies are referred to as the
Context/Linkages study, which was conducted in three rural North Carolina counties. The
sample included all of the public schools in the counties (i.e., middle schools, high schools, K-8
schools, and alternative schools). Overall, there were 7 Waves of data collected in the
Context/Linkages study, but only data from the final 4 waves in two of the study counties were
used in this study because they are the only waves that included a scale for assessing dating
violence perpetration. At Wave 4, adolescent participants were in grades 8, 9, and 10, and at
Wave 7 they were in grades 10, 11, and 12. For the data being used in the proposed study,
school-based data collection was scheduled at six-month intervals for the first three waves and
there was a one-year time interval between the last two waves. Information about neighborhood
characteristics was collected from parent interviews and U.S. Census data, and this information
was merged with adolescent responses regarding their health behaviors and their neighborhoods
to examine the relationship between neighborhood characteristics and the trajectories of dating
4
Examining the relationship between neighborhood characteristics and adolescent dating
violence and mediators and moderators of those relationships has several practical implications.
First, current research on adolescent dating violence focuses more on the influences of
individual- and family-level risk factors and shows little understanding of neighborhood effects.
Thus, exploring the direct, indirect, and moderated effects of neighborhood characteristics could
help disentangle the etiology of dating violence perpetration. Second, well-specified and
thoughtful neighborhood research can inform current policies and dating violence services. For
example, if neighborhood physical disorder is found to be a significant risk factor for adolescent
dating violence, demolition or rehabilitation of abandoned housing can be undertaken in order to
decrease the risk of dating violence (Leventhal & Brooks-Gunn, 2000). Third, findings from this
assessment of neighborhood effects can be used to identify the types of neighborhoods most in
need of resources and services related to preventing adolescent dating violence. Having
trajectories of dating violence as the outcome allows for investigating the issue from a
developmental lens, which will be important because neighborhoods may be more influential on
dating violence at some developmental stages of adolescence than at others. New, innovative,
and developmentally appropriate interventions may emerge based on the current study findings.
Finally, urban settings have been the dominant focus for the study of neighborhood influences on
adolescent behaviors. However, a substantial number of adolescents live in rural areas in the U.S.
Thus, the current research will make an important contribution to understanding how aspects of
5
Chapter 2: Background Information
The problem of adolescent dating violence perpetration
Currently there is no national study of adolescent dating violence perpetration.
Prevalence estimates of adolescent dating violence perpetration from local studies show great
variation due to inconsistencies in the time frames assessed, the specific behaviors being
measured, the ages studied, and the characteristics of the samples (Foshee & Matthew, 2007).
Overall, the prevalence of physical dating violence extracted from local studies ranges between
11% and 41%, without considering sex differences (Foshee & Matthew, 2007). When only
severe forms of dating violence (i.e., hitting a partner with an object, beating up a dating partner
or using a weapon against a partner) are taken into account, prevalence estimates range from
approximately 8% (Coker et al., 2000) to 14% (Gorman-Smith, Tolan, Sheidow, & Henry, 2001).
It is clear that a substantial number of adolescents are involved in the perpetration of dating
violence.
Additionally, although no studies have examined the psychological and behavioral
consequences of dating violence perpetration using longitudinal analyses, indirect evidence of
negative consequences has been found. Many cross-sectional studies have shown that dating
violence perpetration is correlated with multiple risk behaviors. For example, using violence
against dates has been associated with higher levels of depression, suicidal thoughts and poorer
educational outcomes (Banyard & Cross, 2008). Sexual behavior, substance use, and unhealthy
weight control have also been found to correlate with dating violence perpetration among high
6
adolescent dating violence may cluster with other types of violent behavior, including peer
violence and suicidal behavior. Additionally, several longitudinal studies have identified
negative consequences of being a victim of dating abuse such as depression (Roberts, Klein, & Fisher, 2003), suicide ideation (Ackard, Eisenberg, & Neumark-Sztainer, 2007), cigarette
smoking (Ackard et al., 2007), substance dependence disorder (Brown et al., 2009), and
re-victimization (Halpern, Spriggs, Martin, & Kupper, 2009; Smith, White, & Holland, 2003).
Many studies suggest that victimization and perpetration of dating abuse are highly correlated.
For example, findings from three waves of the National Longitudinal Study of Adolescence
Health (Add Health) showed that experiencing adolescent dating violence is a significant
predictor of both dating violence perpetration and victimization in young adulthood. More severe
dating violence victimization is associated with an 82% increase in the odds of dating violence
perpetration, whereas less severe dating violence increases the odds by 60% (Gomez, 2011).
Thus, it is likely that some of the negative consequences of dating abuse victimization may also
be the negative consequences of dating abuse perpetration.
Dating Violence Trajectories as the Outcome
Due to the high prevalence and the associated negative consequences, researchers have
gradually begun to examine the development of dating violence perpetration over time. For
example, the results of a study of 158 high-risk adolescents indicated that the mean trajectory of
physical dating violence was characterized by negative linear slopes, with a steady decrease from
ages 14 to 16 (Wolfe et al., 2003). However, another longitudinal study (Foshee et al., 2009)
which followed a general sample of adolescents from ages 13 to 19 found that the mean
trajectory was curvilinear for moderate physical dating violence, with levels of physical
7
young adulthood. Similar to the findings of Foshee and colleagues (2009), Reyes and colleagues
(2011) found that the developmental trajectory of physical dating violence first increases during
early adolescence (grades 8–9), peaks at the end of grade 10, and then decreases during late
adolescence (grades 11–12). This curvilinear pattern of physical dating violence trajectories is
similar to other types of antisocial behaviors, which have been found to peak during adolescence
and decline during young adulthood (Karriker-Jaffe et al., 2009; Moffitt, 1993).
Studying Neighborhood Influences From A Developmental Perspective
The current study has trajectories of dating violence as the outcome, allowing for an
investigation of neighborhood influences on dating violence from a developmental perspective.
With trajectories as outcomes, investigators can examine the role of risk factors on the initial
level (intercept) and changes over time (slope) in behavioral outcomes (Ingoldsby et al., 2006;
Karriker-Jaffe et al., 2009; Vanfossen et al., 2010). To date, the effects of neighborhoods on
trajectories of dating violence perpetration have been examined very rarely. Evidence has shown
that the contributions of and experiences in the neighborhood context are likely to vary across
individuals and developmental stages (Ingoldsby & Shaw, 2002) as children experience increases
in independence and mobility (Steinberg & Silverberg, 1986) and a corresponding decrease in
parental monitoring (Dishion & McMahon, 1998). That is, when children become older, not only
may they be more likely to expand their contact with peers in the same neighborhoods, the
effects of neighborhood environment on behaviors may also become more salient. The
differential effects of neighborhoods at different ages, however, may not be detected by
examining neighborhood effects using cross-sectional data or only two time-point data. In this
study, the influences of neighborhood characteristics on the initial level of dating violence
8
perpetration over time and the desistance from dating violence perpetration were examined.
Multilevel growth curve modeling was used to model the relationship between neighborhood
factors and dating violence perpetration across adolescence from grade 8 to 12.
Neighborhood Influences
According to ecological models (Bronfenbrenner, 1979), individuals develop within
different contexts and the neighborhood is one of the important contexts where development
takes place. During adolescence, the needs for autonomy grow (Steinberg & Silverberg, 1986),
suggesting that adolescents may spend more time with peers in neighborhoods and
neighborhoods could be seen as an important context for adolescents’ out-of-home time.
Neighborhoods not only offer physical spaces where adolescents can spend time but also social
spaces in which many social interactions occur. Evidence has suggested that social environments
exert increasing influence on development during adolescence (Steinberg & Morris, 2001).
This section defines the neighborhood, the three neighborhood characteristics of interest– – neighborhood structural factors, collective efficacy, and physical disorder ––, and describes the
appropriateness and importance of examining neighborhood influences on rural adolescents.
Defining Neighborhood Boundaries and Neighborhood Characteristics of Interest
In practice, several options are available to define neighborhood boundaries. These
include census block or tracts (Karriker-Jaffe et al., 2009), school districts (Dent & Biglan, 2004),
zip codes (Boslaugh, Luke, Brownson, Naleid, & Kreuter, 2004), or the interpretation of research
participants (Cook, Herman, Phillips, & Settersten, 2002). The current study defined
neighborhoods by census block groups because there is some evidence to suggest that U.S.
census block groups effectively delineate social and structural determinants of health and health
9
Three distinct dimensions of neighborhoods are often examined in the literatures:
structural characteristics, social organization, and physical environment. Neighborhood structural
characteristics such as income, employment rates, racial/ethnic heterogeneity, and residential
instability represent the population makeup of a neighborhood and are often defined by means of
census data (Leventhal, Dupéré, & Brooks-Gunn, 2009). Unlike the more static features of
neighborhood structural characteristics, social organizational aspects of neighborhood (e.g.,
collective efficacy) provide accounts of howpeople in a neighborhood behave and bring about a
change in a given phenomenon of interest. In addition to the structural and social aspect of a
neighborhood, the physical environment of a neighborhood (e.g., physical disorder) has also
been recognized as an important dimension that should be considered when examining
neighborhood influences (Cohen et al., 2003).
Each of these dimensions has been found to be associated with increased adolescent risk
behaviors, including dating violence perpetration (Ingoldsby et al., 2006; Jain, Buka,
Subramanian, & Molnar, 2010; Rothman et al., 2011). Thus, they are examined in this
dissertation. The three neighborhood characteristics of interest (i.e., neighborhood structural
characteristics, collective efficacy, and physical disorder) are further elaborated in the following
section.
Definitions of Three Types of Neighborhood Characteristics
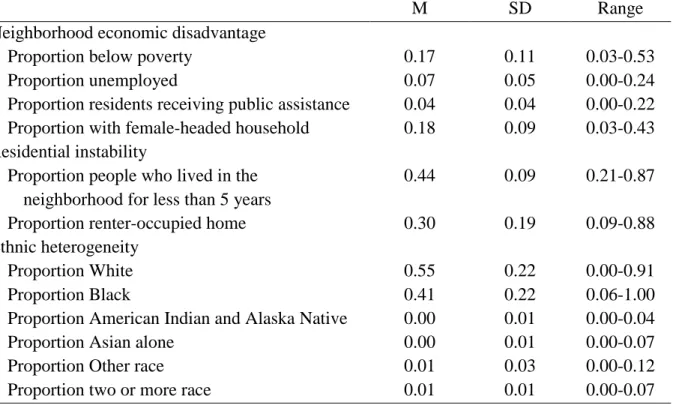
Structural Characteristics. Across studies that use census tracts or block groups to define neighborhoods, economic disadvantage, residential instability, and ethnic heterogeneity are three
structural characteristics that have been found to be associated with violence perpetration and
community crime (Sampson & Groves, 1989; Shaw & McKay, 1942). Neighborhood economic
10
DeMaris, & Van Wyk, 2003; Li et al., 2010) such as percentage of residents whose income falls
below the poverty line, percentage who are unemployed, percentage who receive public
assistance, and percentage who live in female-headed households, each of which is examined in
this study. Residential instability reflects the residential movement over time (Fitchen, 1994). It
can also be measured as the residents’ housing outcome that incorporates frequency of moves,
number of moves and reasons for moves (Bebout, Drake, Xie, McHugo, & Harris, 1997), as well
as timing and entry into housing (Hurlburt, Hough, & Wood, 1996). Finally, racial heterogeneity
is a measure of the racial diversity in a block group. Conceptually, racial heterogeneity has
represented the probability that two randomly chosen persons from a neighborhood do not
belong to the same ethnic group (Herzog, 2009). This variable captures the degree to which those
individuals are evenly spread across racial categories.
Collective Efficacy. Collective efficacy, which is derived from Bandura’s concept of
perceived self-efficacy (Bandura, 1995), is defined as a construct that captures residents’ shared
expectations and mutual engagement in local social control (Sampson, Morenoff, & Earls, 1999). Like Bandura’s claims that a neighborhood’s strengths and efforts reside at least partly in
members’ common beliefs that they can solve a problem collectively (Bandura, 1995), collective
efficacy is an activated social process (Sampson, Morenoff, & Gannon-Rowley, 2002) that reflects community cohesiveness and residents’ willingness to work together to achieve an
intended effect. It also emphasizes members’ shared beliefs in their neighborhoods’ capability of
working together to achieve common goals (Sampson, Raudenbush, & Earls, 1997). Sampson et
al. (1997) proposed that collective efficacy comprises two elements: informal social control 1 and
1Informal social control includes a shared sense of norms in protecting neighborhood residents from crime, and the readiness of residents to act on these norms (Nash & Bowen, 1999). Compared to formal social control, which is more impersonal and often embodied in law and implemented by police, court, and other institutional
11
social cohesion. He and his colleagues then used data from a 1995 survey of 8,782 residents of
343 Chicago neighborhoods to test the construct of collective efficacy. They found that informal
social control and social cohesion were strongly related to each other across neighborhoods, so
they combined them into a summary measure of “collective efficacy.”
Physical Disorder. Unlike perceived order, which is a state of peace, safety and
observance of the law, physical disorder is evidenced by existence of a dirty, unsafe and noisy
neighborhoods where buildings are in bad repair, crime is high and vandalism and graffiti are
common (Ross, Mirowsky, & Pribesh, 2001). Neighborhood physical disorder is indicated by
visible cues that residents perceive to be signs of the breakdown of social order and control (Ross
& Mirowsky, 1999). Thus, the term “neighborhood physical disorder” means disorder that is characterized by residents’ reports of graffiti, litter and abandoned buildings or by the absence of
well-maintained homes.
Examining Neighborhood Characteristics Beyond Urban Areas
The data used for this dissertation are from adolescents and their parents living in rural
areas in North Carolina. One of the limitations of extant neighborhood-level research is that
urban settings have been the dominant focus for the study of neighborhood influences on
adolescent behaviors. Recent research has queried the extent to which neighborhood effects on
adolescent health behaviors based on youth living in urban areas can be applied to youth residing
in rural areas (Osgood & Chambers, 2000; Reisig & Cancino, 2004; Witherspoon & Ennett,
2011). Osgood and Chambers (2000) extended the study of social disorganization and crime to
nonmetropolitan areas and found that several structural characteristics depicted in social
disorganization theory, which developed among urban neighborhoods, generalize well to rural
12
communities; for example, neighborhood residential instability, family disruption and ethnic
heterogeneity were significantly associated with rates of adolescent delinquency in rural as well
as urban communities. Using the same data set as the current study, Witherspoon & Ennett (2011)
examined how best to capture neighborhoods among rural residents and further found that
neighborhood economic disadvantage significantly predicted perceptions of risk for rural
families after controlling for several individual covariates such as age, race, and family structure.
Consistent with urban neighborhood studies, other rural neighborhood features such as
neighborhood supportiveness (De Haan, Boljevac, & Schaefer, 2010) and neighborhood norms
(Harbour, 2012) have been found to correlate with various adolescent problem behaviors after
controlling for individual characteristics.
In addition to the structural and social characteristics of neighborhoods, Evenson and
colleagues (2009) indicated that the “physical disorder” construct typically applied to areas that
are more urban, could also be extended to geographic areas that are more rural. After conducting
both exploratory factor analysis (EFA) and confirmatory factor analysis (CFA) to derive
constructs that describe both urban and rural neighborhoods, they found that the physical
incivilities (i.e., physical disorder) factor, which includes conditions such as litter, graffiti and
abandoned housing units, had similar construct validity and test-retest reliability in both urban
and rural neighborhoods. In addition, Pruitt, Jeffe, Yan, and Schootman (2010) found that the
internal consistency reliability of a physical disorder scale consisting of six items (There is a lot
of graffiti in my neighborhood; My neighborhood is noisy; Vandalism is common in my
neighborhood; There are lots of abandoned buildings in my neighborhood; My neighborhood is
clean; People in my neighborhood take good care of their houses and apartments) was
13
The negative effects of neighborhood physical disorder on residents living in rural areas
have also been demonstrated in research. For example, Hennessy and colleagues (2010) found
that some physical and socioeconomic features of the environment in rural neighborhoods, such
as no sidewalks or shoulders, vacant homes, bad street conditions and trash/debris, were risk
factors for child and adolescent physical inactivity. Lagrange, Ferraro and Supancic (1992) also
found that rural residents were as likely as urban residents to be bothered by neighborhood
physical disorder, which was further found to correlate with perceptions of risk to crime.
Even though it has not been conclusively shown that the theoretical constructs developed
in urban areas are equally applicable in rural contexts, given the above findings it is plausible
that neighborhood characteristics such as neighborhood economic disadvantage, residential
instability, racial heterogeneity, collective efficacy and physical disorder, which have been
identified as risk factors in urban samples, are also applicable to rural residents.
Methodological Issues
Disentangling neighborhood effects from individual effects on behaviors is difficult. Two
concerns contribute to the difficulties: selection effects and compositional effects. Selection
effects reflect the selection of persons with similar socioeconomic characteristics into particular
types of neighborhoods. The association between neighborhood characteristics and individual
outcomes may reflect the selection effects rather than effects of neighborhood per se on
behaviors. If left unaccounted for, observed neighborhood effects would reflect the decision
making of parents/families rather than a true neighborhood effect. Unfortunately, studies rarely
measure the process by which parents/families select neighborhoods, so the degree to which
selection biases exist is unknown. The best way to control for selection effects is through an
14
The other concern in analyzing neighborhood effects is the possibility that such effects
are spurious due to individual characteristics that influence both the selection of the
neighborhood and the behaviors. This is referred to as compositional effects. For example, if
adolescents with certain attributes are more likely to live in disadvantaged neighborhoods, and if
these attributes also influence adolescents to perpetrate dating violence, then the association
between neighborhood disadvantage and dating violence perpetration will appear to be stronger
than it really is. In other words, the effects of neighborhood disadvantage on adolescent dating
violence perpetration could be confounded by the individual compositional factors (i.e.,
adolescent attributes).
Traditionally, studies of the association between neighborhood characteristics and
adolescent risk behaviors have attempted to address compositional effects, by controlling for
child (e.g., sex and age) and family characteristics (e.g., income, parent education, family
structure) in analytic models (Leventhal & Brooks-Gunn, 2004). Some researchers (Brody et al.,
2001; Ingoldsby et al., 2006) have suggested that this approach in lieu of experimental designs,
may also help control for selection effects. For this dissertation, I reviewed the literatures on
neighborhood effects on various risk behaviors and examined how each controlled for
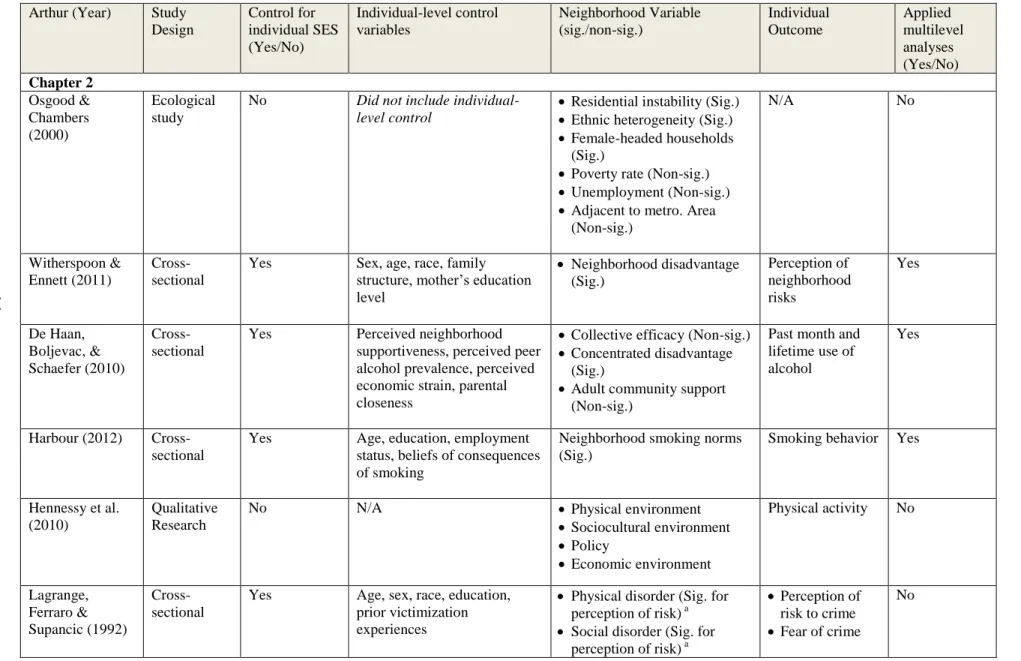
compositional and selection effects. Table 1 presents a summary of this review. As can be noted,
most controlled for individual characteristics. The common controls were sex, age, race/ethnicity, parents’ education, family structure, and family income. Few studies did not control for
individual-level covariates (Fox & Benson, 2006; Swahn & Bossarte, 2009; Wilcox, Augustine,
& Clayton, 2006) or individual-level socioeconomic variables (Rothman et al., 2011; Santiago,
Wadsworth, & Stump, 2011).Among the four dating violence studies reviewed, all controlled for
15
(Jain et al., 2010; Schnurr & Lohman, 2013) included indicators of socioeconomic status in the
models.
In the current study, to control for compositional effects (and possibly selection effects
to some degree), adolescents’ sex, race/ethnicity, moving status, and family socioeconomic status (parents’ education level and family structures) were included in the model. Age was
originally included as a control but was removed due to its insignificant relationship with
outcome. Dating status and failed school year(s) were also controlled in the model. Multilevel
analyses were used to examine the longitudinal relationship between neighborhood
characteristics and development of dating violence perpetration above and beyond individual
Table 1. Neighborhood Research Reviewed in Current Study Arthur (Year) Study
Design Control for individual SES (Yes/No) Individual-level control variables Neighborhood Variable (sig./non-sig.) Individual Outcome Applied multilevel analyses (Yes/No) Chapter 2 Osgood & Chambers (2000) Ecological study
No Did not include individual-level control
Residential instability (Sig.) Ethnic heterogeneity (Sig.) Female-headed households
(Sig.)
Poverty rate (Non-sig.) Unemployment (Non-sig.) Adjacent to metro. Area
(Non-sig.)
N/A No
Witherspoon & Ennett (2011)
Cross-sectional
Yes Sex, age, race, family structure, mother’s education level
Neighborhood disadvantage (Sig.) Perception of neighborhood risks Yes De Haan, Boljevac, & Schaefer (2010) Cross-sectional
Yes Perceived neighborhood supportiveness, perceived peer alcohol prevalence, perceived economic strain, parental closeness
Collective efficacy (Non-sig.) Concentrated disadvantage
(Sig.)
Adult community support (Non-sig.)
Past month and lifetime use of alcohol
Yes
Harbour (2012) Cross-sectional
Yes Age, education, employment status, beliefs of consequences of smoking
Neighborhood smoking norms (Sig.)
Smoking behavior Yes
Hennessy et al. (2010)
Qualitative Research
No N/A Physical environment
Sociocultural environment Policy
Economic environment
Physical activity No
Lagrange, Ferraro & Supancic (1992)
Cross-sectional
Yes Age, sex, race, education, prior victimization experiences
Physical disorder (Sig. for perception of risk) a Social disorder (Sig. for
perception of risk) a
Perception of risk to crime Fear of crime
No
1
Chapter 3
Neighborhood Structural Characteristics and Adolescent risk Santiago,
Wadsworth & Stump (2011)
Longitudinal No Age, Sex Neighborhood Education
(Sig. for withdrawn) Neighborhood Poverty (Sig.
for social problem)
Neighborhood unemployment (Sig. for aggression, attention problems, and social
problem)
Neighborhood Mobility (Sig. for delinquency and thought problems) Psychological syndromes (i.e., aggression, delinquency, attention problems, social problems, anxious/depressed , withdrawn, Somatic complaint, and thought problems) Yes Wickrama & Bryant (2003) Cross-sectional
Yes Race/ethnicity, sex, family economic hardship, parental education, single parenthood
Neighborhood poverty (Non-sig.)
Ethnic heterogeneity (Sig.) Formal social integration
(Sig.)
Collective socialization (Non-sig.)
Depressive symptoms
Yes
Ingoldsby et al. (2006)
Longitudinal Yes Family income, maternal education, race/ethnicity
Neighborhood disadvantage (Sig.)
Neighborhood problem (Sig.)
Antisocial behavior No Swahn & Bossarte (2009) Cross-sectional
No Did not include individual-level control Neighborhood disadvantage (Sig.) Risky behavior (e.g., vandalism, theft, violence, and selling drugs …etc.)
No
De Coster et al. (2006)
Cross-sectional
Yes Sex, race/ethnicity, age, female-headed household, parents education, parents receiving public assistance
Urban neighborhood (Non-sig.)
Community disadvantage (Sig.)
Violence No
Kalff et al. (2001)
Cross-sectional
Stewart, Simons, & Conger (2002)
Cross-sectional
No Family structure, sex, and number of children per household
Neighborhood violence (Non-sig.)
Neighborhood affluence (Sig.)
Violent behavior No, but standard errors were corrected for clustering within neighborhoods Hart & Marmorstein (2009)
Longitudinal Yes Sex, age, race/ethnicity, parental education, parental marital status, received public assistance or not
% under 15 in the neighborhood (Sig. in longitudinal analyses) % urban neighborhood (Sig.
only in cross-sectional analyses)
Neighborhood poverty (Sig. only in cross-sectional analyses)
Racial heterogeneity (Sig. only in cross-sectional analyses)
Aggression Yes
Benson et al. (2003)
Longitudinal Yes Race, age, man’s education, male drinking/drug problem, female social support
Concentrated disadvantage (Sig.)
Residential instability (Sig.)
Intimate partner violence
No
Cunradi, Caetano, Clark, & Schafer (2000)
Cross-sectional
Yes Race/ethnicity, age, sex, income, employment status, marital status, number of children, education.
Neighborhood poverty (Sig.) Intimate partner violence
Yes
Fox & Benson (2006)
Cross-sectional
No Did not include individual-level control Neighborhood disadvantage (Sig.) Intimate partner violence No
O’Campo et al. (1995)
Cross-sectional
Yes Age, marital status, education, employment status, income, parity, and race, partner’s drug use, social support.
Ratio of home owners to renters (Sig.)
Unemployment (Sig.) Per capita income less than
$13,500 (Sig.)
Intimate partner violence
Yes
Van Wyk et al. (2003)
Cross-sectional
Yes Duration of union, marital status, SES of the couple, subjective financial satisfaction, race
Neighborhood economic disadvantage (Sig. only in model w/o race)
Intimate partner violence
No
1
DeMaris et al. (2003)
Cross-Sectional
Yes Relationship duration, cohabiting unmarried, women’s age at union, both in first union, man’s isolation, number of children,
employment status, education, gender ideology, substance abuse, frequency of disagreement, disagreement style Neighborhood economic disadvantage (Sig.) Intimate partner violence No
Li et al. (2010) Cross-sectional
Yes Race/ethnicity, age, no paying job, education level, use of alcohol, mastery, self-esteem, age at first vaginal intercourse.
Concentrated disadvantage (Non-sig.)
Residential stability (Sig.) Violent crime (Non-sig.)
Intimate partner violence
Yes
Browning (2002) Cross-sectional
Yes Race/ethnicity, age, income, touched sexually during childhood, education, marital status, jealousy as source of conflict, number of conflict sources, relationship duration, and years resident in the neighborhood, social embeddedness, disclosure opportunity
Concentrated disadvantage (Non-sig)
Residential stability (Non-sig)
Immigrant
concentration(Non-sig) Collective efficacy (Sig.) Norm of nonintervention
(Sig.)
Violent victimization (Non-sig.)
Intimate partner violence
Yes
Jain et al. (2010) Longitudinal Yes Age, sex, parental education, race/ethnicity
Concentrated poverty (Non-sig.)
Collective efficacy (Sig.) Perceived violence
Collective efficacy and adolescent risk Echeverria et al.
(2008)
Cross-sectional
Yes Age, sex, income, education, race/ethnicity, length of residency in neighborhood
Neighborhood problems (Sig. for all outcomes) a Neighborhood social
cohesion (Sig. for all outcomes except for depression) a
Depression Current
smoking Drinking Not walking for
excise
No
Browning et al. (2004)
Longitudinal Yes Race/ethnicity, age, sex, immigrant generation, family SES, family structure
Residential instability Immigrant concentration Collective efficacy
The timing of first intercourse
Yes
Cradock et al. (2009)
Longitudinal Yes Race/ethnicity, education, sex, overweight BMI status, age cohort
Neighborhood social cohesion (Sig.)
Availability of youth service (Non-sig.)
Proportion of adults with high school education or higher (Non-sig.)
Physical activity Yes
Odgers et al. (2009)
Longitudinal Yes Sex, family SES, domestic violence, physical child maltreatment, parents’ antisocial behavior
Collective efficacy (Sig. for antisocial behavior
intercept)
Neighborhood problem (Non-sig.) Antisocial behavior Yes Dekeseredy, Schwartz, and Tomaszewski (2003) Cross-sectional
Yes Age, received government assistance or not, education, household income, marital status, employment status
Perceived collective efficacy (Sig. for all outcomes) a
Intimate partner violence Public/sexual harassment Violent victimization by strangers and acquaintances Property crime
victimization No Caetano, Ramisetty-Mikler, and Harris (2010) Cross-sectional
Yes Race/Ethnicity, age, income, education, employment status, working class, alcohol volume, binge drinking
Census poverty (Non-sig.) Social cohesion (Sig.) Social control (Non-sig.)
Intimate Partner Violence
Yes
Rothman et al. (2011)
Cross-sectional
No Sex, race, nativity Collective efficacy (Sig.) Social control (Sig.) Social cohesion (Non-sig.) Neighborhood disorder
(Sig.)
Distrust in the police in neighborhood (Non-sig.) Gang problems (Non-sig.)
Physical dating violence perpetration
Yes
Jain et al. (2010) See above “Neighborhood Structural Characteristics and Adolescent risk” section Neighborhood physical disorder and adolescent risk
Kimbro et al. (2011)
Cross-sectional
Yes Sex, race/ethnicity, age, have older sibling or not, health status, mother’s education, marital status, weight
Physical disorder (Sig. for outdoor play and television watching)
Weight status Outdoor play Television watching No, but standard errors were adjusted for clustering at the city-level. Slater et al.
(2010)
Cross-sectional
Yes Sex, grade, race or ethnicity, highest level of schooling completed by father and mother, inflation-adjusted total weekly student income (earned and unearned, such as allowance), whether students worked, mother’s work status
Physical disorder (Sig. for physical activity, obesity and BMI)
Outdoor physical activity (PA) related settings (Non-sig.)
Availability of commercial PA-related outlets (Sig. for physical activity)
Perceived safety (Sig. for physical activity) Traffic danger (Sig, for
physical activity)
Local compactness (Sig. for physical, obesity and BMI)
Physical Activity Obesity Body Mass
Index (BMI)
Yes
21
1
Grafova (2008) Cross-sectional
Yes Age, sex, race/ethnicity, total family wealth and income to needs ratio, mother's BMI, primary care giver’s education, age, number of children in the household, whether household is female-headed, mother's annual hours of work, region of residence.
Population density (Non-sig.) Connectivity (Non-sig.) Urban Design (Sig.)
Pedestrian danger (Non-sig.) Physical disorder (Sig.)
Overweight No, because of low level of geographical clustering
Lang et al. (2010)
Cross-sectional
Yes Age, income, sex, race, parent marital status, parental norms about sex, problems in family communication, number of psychological symptoms, study site
Neighborhood environment (Sig.) a
Neighborhood cohesion (Non-sig.) a
Sexually transmitted infections
No
Ford & Rachel (2012)
Cross-sectional
Yes Sex, age, race/ethnicity, foreign born, household income, parental education, live with two parents, adolescent overall health, received physical examine in the past year, parental physical and mental health,
Neighborhood physical disorder (Sig.) a Neighborhood social
isolation (Non-sig.) a
Lack of neighborhood safety (Non-sig.) a
Depression No
Wilcox et al. (2006)
Cross-sectional
No Did not include individual-level control
Neighborhood “adult businesses” (Non-sig.) Neighborhood
“youth-oriented businesses” (Non-sig.)
Neighborhood “general businesses (Non-sig.) Neighborhood vacancy (Sig.
for Student victimization and perception of school crime)
Reyes (2008) Cross-sectional
No Sex, grade, age, single parent, substance use among the family
Neighborhood social disorder (Sig.) a
Neighborhood physical disorder (Sig.) a
Violence No
Molnar et al. (2004)
Cross-sectional
Yes Sex, age, race and ethnicity, family socioeconomic status, whether the youth knew that a gun was kept at home, whether a family member had been shot with a gun, whether the youth had high exposure to violence in the past year, whether he or she had committed other acts of delinquency and/or aggression in past 6 months.
Neighborhood unsafe for children to play (Sig.) Neighborhood social disorder
(Sig.)
Neighborhood physical disorder (Sig.)
Collective efficacy (Sig.) Neighborhood disadvantage
(Sig.)
Conceal firearm carrying
Yes
Cundrdi (2007a) Cross-sectional
Yes Drinking level, race/ethnicity, education, age, drinking days in past 12 months
Neighborhood disorder (Sig.) a Intimate partner violence
No
Cunradi (2007b) Cross-sectional
Yes Age, education, employment status, household income, born in U.S., language preference, drinking problems
Neighborhood disorder (Sig.) a Intimate partner violence
No
Rothman et al. (2011)
See above “Neighborhood Collective efficacy and Adolescent risk” section
Champion et al. (2008)
Cross-sectional
No Sex, race, and other individual-risk factors
Low community fear a Neighborhood organization a Local laws enforced a Drugs and guns not available
a
Neighborhood connectedness a
Dating violence perpetration
No
Chapter 4
Collective Efficacy as a Moderator Chung &
Docherty (2011)
Cross-sectional
Yes Age, sex, education level, employment status, time spent in neighborhood
Neighborhood disorder (Sig. for both outcome)a
Moderator: Neighborhood trust and cooperation (Sig.) a
Kim & Ross (2009)
Cross-sectional
Yes Age, race, sex, household income, education level, marriage status,
Neighborhood disorder (Sig.) a Moderators: Neighborhood
social support & social ties (Sig.) a
Depression No
Kurlychek et al. (2012)
Cross-sectional
No Sex, race, age Predictors are at individual-levels when examining buffering effect Moderators:
1.Collective efficacy (Non-Sig.)
2.Reciprocal exchange (Non-sig.)
3.Social integration (Sig.) 4.Neighbor support (Sig.) 5.Neighborhood integration
(Sig.)
Youth violence Yes
Simons et al. (2005)
Cross-sectional
Yes Sex, household income, family
structure, parents’ education Predictor is at individual-level (e.g., authoritative parenting) Moderator: Collective efficacy
(Sig. for both outcomes)
Affiliation with deviant peers Delinquency Yes Schnurr & Lohman (2013)
Longitudinal Yes Sex, race, maternal education. (Family income, family structure, time in
neighborhood, and number of moves were first examined in the model but excluded from the final model due to their insignificant associations with the outcome.)
Racial segregation Concentrated economic
disadvantage
Residential instability Neighborhood crime
Dating violence perpetration
No
Molnar et al. (2008)
Longitudinal Yes Age, race, sex, family SES, family size, caregivers’ marital status
Predictors are at individual-level (e.g., family, peer and mentoring resources)
Moderator: Collective efficacy (Sig. for both outcomes)
Aggression Delinquency
Yes
Odgers et al. (2009)
See above “Chapter 3: Collective Efficacy and Adolescent Risk” section
Jain et al. (2010) See above “Chapter 3: Neighborhood Structural Characteristics and Adolescent risk” section
Ross & Jang (2000)
Cross-sectional
Yes Age, sex, race, marital status, number of children, education level, household income
Neighborhood disorder a Moderators:
1.Informal integration (Sig. for both outcomes)a 2.Formal integration (Sig.
only on fear of victimization)a
Fear of victimization Mistrust
No
Collective Efficacy as a Mediator Sampson,
Raudenbush and Earls (1997)
Cross-sectional
Yes Sex, marital status, homeownership, ethnicity, mobility, age, years in neighborhood, SES
Concentrated disadvantage (Sig.)
Immigrant concentration (Sig.) Residential stability (Sig.) Mediator: Collective efficacy
(Sig.)
Violence Yes
Xue et al. (2005) Longitudinal Yes Adolescents’ sex, age, race, and wave 1 depression; maternal education, marital status, unemployment status, receipt of public assistance, mothers’ depression, whether a teenage mother
Concentrated disadvantage (Sig.)
Immigrant concentration (Non-sig.)
Residential instability (Non-sig.)
Mediator: Collective efficacy (Sig.)
Mental health Yes
Elliott et al. (1996)
Cross-sectional
Yes Age, sex, SES, family structure, length of residency
Neighborhood disadvantage (Sig.)
Mediator: Informal network, informal social control, and social integration (Sig.)
Prosocial competence Conventional friends Problem behaviors Note: When examining mediation hypotheses, these individual outcomes were aggregated to neighborhood-level
No when examining mediation hypotheses
Browning (2002) See above “Chapter 3: Neighborhood Structural Characteristics and Adolescent risk” section Gapen et al.
(2011)
Cross-sectional
No Age, trauma exposure Neighborhood physical disorder (Sig.)a
Mediator: Community cohesion (Sig.) a
PTSD symptoms No
a
measures are at individual-level
Kruger, Reischl, & Gee (2007)
Cross-sectional
Yes Age, sex, marital status, education, race, employment status
Neighborhooddeterioration (Sig.)
Mediators:
1.Neighborhood Social contact (Sig.)
2.Neighborhood social capital (Sig.)
3.Neighborhood satisfaction (Non-sig.)
Mental health No, because of low ICC
27
Chapter 3: The Relationships between Neighborhood Characteristics and Physical Dating Violence Perpetration Trajectories (Study 1)
Introduction
The specific aim of Study 1 is to determine whether three types of neighborhood
characteristics (structural factors, collective efficacy, and physical disorder) influence the
trajectory (intercept and slope) of physical dating violence perpetration after controlling for
individual demographic covariates (see figure 1). Sex differences in these relationships were also
examined. The below sections describe findings related to the influence of each neighborhood
characteristic examined on adolescent health-related behaviors in general, adolescent aggression
and violence, adult intimate partner violence, and dating violence specifically when available. It
also describes why each of the three neighborhood characteristics are expected to influence the
development of dating abuse perpetration, and presents the hypotheses for Study 1.
Dating violence perpetration trajectory Neighborhood structural characteristics
- Neighborhood economic disadvantage - Neighborhood residential instability - Neighborhood ethnic heterogeneity
Neighborhood collective efficacy
Neighborhood physical disorder
28
Neighborhood Structural Characteristics and Adolescent Risk
According to social disorganization theory (Sampson et al., 1997; Shaw & McKay, 1942),
neighborhood structural characteristics including economic disadvantage, residential instability
and ethnic heterogeneity are associated with increased delinquency and crime. These structural
characteristics are thought to lead to the disruption of neighborhood social organization, to lessen
the ability of a neighborhood structure to establish norms and values of its residents and maintain
effective social control, and to result in increased rates of crime and violence. Several studies
(Jelleyman & Spencer, 2008; Santiago et al., 2011; Wickrama & Bryant, 2003) have found that
poor neighborhood structural characteristics were negatively associated with adolescent health
and can also contribute to the perpetration of youth aggression, violence and delinquency
(Ingoldsby et al., 2006; Swahn & Bossarte, 2009; Valois et al., 2002). For example, children and
adolescents who live in more affluent neighborhoods are less likely to report using violence than
those who reside in less affluent neighborhoods after controlling for individual demographic
covariates (De Coster et al., 2006; Kalff et al., 2001; Stewart, Simons, & Conger, 2002). A high
neighborhood residential instability rate, which often creates conflict between current and new
residents (Salamon & Tornatore, 1994), was found to predict delinquency among children and
adolescents above and beyond individual characteristics (Santiago et al., 2011), with more
instability predicting more delinquency. Also, in a multilevel regression model, ethnic
heterogeneity was found to be positively associated with adolescent aggression at baseline after adolescents’ sex, race/ethnicity, age and other family socioeconomic status measures were taken
into account (Hart & Marmorstein, 2009).
Most specific to the focus of this study, the correlations between neighborhood structural
29
albeit with a greater focus on the effect of neighborhood economic disadvantage (Benson et al.,
2003; Cunradi, Caetano, Clark, & Schafer, 2000; Fox & Benson, 2006). In a pioneering effort to
investigate the association between neighborhood characteristics and partner violence, O’Campo
and colleagues (1995) analyzed both the neighborhood- and individual-level predictors of male
partner violence using census tract data from 157 women residing within 76 census tracts in
Baltimore. Using multilevel analysis, the results suggested that after controlling for individual
SES characteristics, the risk of experiencing intimate partner violence for women who reside in
neighborhoods that fall within the lowest percentile of per capita income was more than four
times that of women who live in neighborhoods that fall within the highest percentile of per
capita income.
More recent evidence has also supported this link between neighborhood economic
disadvantage and intimate partner violence. For example, Van Wyk and colleagues (2003) found
that after controlling for individual demographic and socioeconomic characteristics,
male-to-female partner violence was more than twice as likely to occur in highly disadvantaged
neighborhoods than in those that were relatively well-to-do. Using National survey data,
DeMaris and colleagues (2003) examined factors that associate with intimate partner violence
and found that after controlling for several individual-level covariates (e.g., education,
employment status, age, and substance abuse), couples who live in economically disadvantaged
neighborhoods have a greater risk of involvement in intense intimate partner violence than those
who do not live in such neighborhoods.
Less research has been done on the influence of other neighborhood structural aspects on
adult intimate partner violence; moreover, the findings of the research that has been done are less
30
example, one of the few studies that used a multilevel analysis to examine the association
between neighborhood factors and intimate partner violence above and beyond individual- and
household- level factors among low-income pregnant women found that in contrast to the
traditional perspective of high neighborhood mobility being a risk factor for intimate partner
violence, neighborhoods with lower levels of residential mobility were associated with a higher
prevalence of intimate partner violence (Li et al., 2010). However, in a multilevel study
conducted by Browning (2002), neither the main effects of residential instability nor ethnic
heterogeneity on adult intimate partner violence were significant after controlling for individual
characteristics. These inconsistent results may be due to the inconsistent measures that were used
to assess these neighborhood structural characteristics in different studies. In the study by Li and
colleagues (2010), residential instability was operationalized as the percentage of households
staying in the same residence for at least 5 years, whereas in Browning’s (2002) study,
residential instability was measured by a combined assessment of housing tenure (the percentage
of subjects who had not moved since 1985) and the percentage of houses occupied by owners.
Different study designs (i.e., cross-sectional vs. longitudinal), methods of statistical analysis (i.e.,
multi-level analysis vs. linear regression) and sample characteristics (e.g., Whites vs. Blacks)
may also have contributed to the discrepancies in research findings.
Empirical evidence has shown the similarity in risk factors for adolescent dating violence
and adult intimate partner violence (Shorey, Cornelius, & Bell, 2008). These include poor
communication skills (Cornelius, Shorey, & Beebe, 2010; Follingstad, Bradley, Laughlin, &
Burke, 1999), alcohol abuse (Hines & Straus, 2007; Reyes et al., 2011) and jealousy (Giordano,
Soto, Manning, & Longmore, 2010; O'Leary, Slep, & O'Leary, 2007). Therefore, the association
31
between neighborhood structural characteristics and adolescent dating violence. However,
studies that have examined the relationship between neighborhood structural characteristics and
dating violence perpetration among adolescents are scarce. One of the few that has examined this
relationship, by Jain and colleagues (2010), consisted of a longitudinal multilevel analysis of
adolescents aged 13 to 19 to examine the neighborhood effects on dating violence perpetration
and victimization. Its results indicated that neighborhood concentrated poverty does not have a
significant main effect on dating violence perpetration and victimization, after accounting for
individual-level covariates including sex, age, race/ethnicity and parental education. Foshee et al.
(2008) similarly found that neighborhood economic disadvantage was not associated with
trajectories of physical dating violence perpetration while other individual covariates were also
in the model. Due to the limited number of studies, the relationships between neighborhood
economic disadvantage and dating violence perpetration remain unclear.
Several reasons have been proposed for why neighborhood structural characteristics may
influence adolescent dating violence. First, it is thought that neighborhoods can influence
adolescent dating violence through deviant peer affiliation. Adolescents who live in more
disadvantaged neighborhoods have been found to have a higher probability of affiliating with
violent peer groups (Brody et al., 2001; Rankin & Quane, 2002). According to Bandura’s (1989)
social cognitive theory and other empirical findings (Guerra, Huesmann, & Spindler, 2003),
adolescents who are exposed to violent peer groups tend to internalize social norms that are more
accepting of violence and be less likely to expect negative consequences when using violence.
Adolescent affiliation with deviant peers may also prevent such adolescents from developing
constructive conflict resolution skills (Bukowski & Sandberg, 1999); these skills have been
32
adolescents who live in disadvantaged neighborhoods may be more likely to perpetrate violence
toward their dating partners through peer influences by having more permissive social norms
regarding violence and fewer constructive conflict resolution skills. Cultural spillover theory
(Straus, 1991) extends the tenets of social cognitive theory also suggesting that violence that is
legitimized in one area of life will influence violence in other contexts. Thus, since adolescents
living in disadvantage neighborhoods are more likely to see their peers using violent behaviors,
they may also be more likely to use violence toward dates once they start dating because of
violence spillover effects.
Second, the lack of prosocial adult role models in disadvantaged neighborhoods may
contribute to the risk of dating violence perpetration. According to the evidence cited above that
the prevalence of adult intimate partner violence is higher in structurally disadvantaged
neighborhoods, adolescents who live in such neighborhoods may be more likely to use violence
in their dating relationships because of the collective presence of neighborhood adults who
model violence against partners, which may impact adolescent dating violence perpetration by
influencing their norms and acceptance of violence.
Lastly, living in structurally disadvantaged neighborhoods may influence adolescent
dating violence perpetration indirectly through adults’ lack of monitoring. Studies have found
that adolescents living in disadvantaged neighborhoods are less effectively monitored by parents,
resulting in increased risk of several adolescent risk behaviors such as delinquency (Stern &
Smith, 1995), substance use (Chuang, Ennett, Bauman, & Foshee, 2005), and antisocial behavior
(Odgers et al., 2012). Similarly, poor parental monitoring in structurally disadvantaged
neighborhoods may lead to higher risk of adolescent dating violence perpetration.