EFFECTS OF ECOSYSTEM STATE CHANGE AND LANDSCAPE VARIABILITY ON SEDIMENT NUTRIENT FLUXES
Olivia Marie Torano
A thesis submitted to the faculty at the University of North Carolina at Chapel Hill in partial fulfillment of the requirements for the degree of Master of Science in the Curriculum for the
Environment and Ecology in the College of Arts and Sciences.
Chapel Hill 2018
ABSTRACT
Olivia Marie Torano: Effects of ecosystem state change and landscape variability on sediment nutrient fluxes
(Under the direction of Michael F. Piehler)
Lake Mattamuskeet, located in North Carolina’s coastal plain, recently underwent a shift in vegetative state. While the west basin of the lake was unvegetated since the early 1990s, the east basin supported dense benthic vegetation until 2014. After vegetation loss in the east basin, the dominant primary producer across both basins became phytoplankton. Sediment and water column nutrient concentrations and transformations were measured between 2016 - 2018 to understand the impact of this primary producer shift on nutrient dynamics. Data collected
ACKNOWLEDGEMENTS
I would like to thank the members of my advisory committee Drs Hans Paerl, Joel Fodrie, and Mike Piehler for their guidance over the last two years. I am greatly appreciative of all of the members of the Piehler lab including graduate students Adam Gold, Kathleen
Onorevole and Mollie Yacano, technicians Joe Gould and Peggie Mullin, and in particular the Piehler lab manager Suzanne Thompson. Thank you for assistance in the field and lab, answering my endless questions, and making the lab a fun and supportive place. I would like to thank Michelle Moorman, Pete Campbell, Debbie McGowan, Zoe Carroll, Rebecca Nishida and all of the staff at the Lake Mattamuskeet National Wildlife Refuge for sharing their expertise of the lake and assistance in the field. I would additionally like to thank Tania Laporte, Calyb Hare and all of the staff at Wetland Plants Inc., as well as Ted West and Taylor Vigliotti for their
assistance with restoration efforts.
TABLE OF CONTENTS
LIST OF TABLES ... vii
LIST OF FIGURES ... viii
LIST OF ABBREVIATIONS ... ix
INTRODUCTION ...1
SECTION 1: EFFECT OF STABLE STATE CHANGE ON NUTRIENT SEDIMENT FLUXES ...8
Introduction ...8
Methods...10
Sediment nutrient flux...10
Water column measurements ...12
Statistical analyses ...12
Results ...13
Discussion ...20
SECTION 2: EFFECT OF WATER COLUMN NUTRIENT CONCENTRATIONS ON DNF RATES ...23
Introduction ...23
Methods...25
Sediment nutrient flux...25
Water column measurements ...26
Results ...27
Discussion ...35
SECTION 3: WETLAND NUTRIENT FLUXES UNDER AMBIENT AND NUTRIENT SPIKED CONDITIONS ...37
Introduction ...37
Methods...39
Sediment nutrient flux...39
Water column measurements ...40
Statistical analyses ...40
Results ...41
Discussion ...49
SECTION 4: INVESTIGATING CONTROLS ON DNF, PHYTOPLANKTON NUTRIENT LIMITATION, AND LONG-TERM TRENDS WITHIN THE LAKE USING HISTORICAL DATA ...53
Introduction ...53
Long term trends in water column nutrient and chl α concentrations ...53
Current and historic nutrient limitation...56
Controls on DNF ...58
Discussion ...63
LIST OF TABLES
Table
LIST OF FIGURES
Figure 1. Map of 2016 sampling locations ...9
Figure 2. 2016 fluxes, sediment %OM, and chl α divided by vegetative state ...14
Figure 3. 2016 fluxes, sediment %OM, and chl α divided by basin ...15
Figure 4. 2016 fluxes sediment %OM, and chl α divided by basin and vegetative state ...17
Figure 5. 2016 linear regressions of variables combined by basin ...18
Figure 6. 2016 linear regressions of east basin variables ...18
Figure 7. 2016 linear regressions of west basin variables ...19
Figure 8. Map of 2016 monitoring sites and 2017 sampling sites ...24
Figure 9. 2017 fluxes, sediment %LOM, %ROM, and chl α divided by sampling location ...28
Figure 10. 2017 fluxes, sediment %LOM and %ROM, and chl α divided by basin ...29
Figure 11. 2017 fluxes sediment %LOM and %ROM, and chl α divided by basin and site ...30
Figure 12. 2017 linear regressions of variables combined by basin ...32
Figure 13. 2017 linear regressions of east basin variables...33
Figure 14. 2017 linear regressions of west basin variables ...34
Figure 15. 2018 fluxes, sediment %LOM, %ROM, and chl α divided by sampling location ...42
Figure 16. 2018 fluxes, sediment %LOM and %ROM, and chl α divided by basin ...43
Figure 17. 2018 fluxes sediment %LOM and %ROM, and chl α divided by basin and site ...46
Figure 18. 2018 significant linear regressions of variables in the east and west basins ...48
Figure 19. Regression of 2016 turbidity and attenuation measurements ...51
Figure 20. 2005 – 2017 bioassay chlorophyll α (μg/L) measurements...58
Figure 21. Correlation plot of east and west combined variables ...60
LIST OF ABBRIVIATIONS
C:N carbon to nitrogen ratio
CDOM chromophoric dissolved organic material
Chl α chlorophyll α
Cond conductivity
CV currently vegetated
DIC dissolved inorganic carbon
DIN dissolved inorganic nitrogen
DNF denitrification
DO dissolved oxygen
DOC dissolved organic carbon
DON dissolved organic nitrogen
HU historically unvegetated
IMS UNC Institute of Marine Sciences
Kd attenuation coefficient
%LOM percent labile organic matter
MIMS membrane inlet mass spectrometer
NaNO3 sodium nitrate
NCCF North Carolina Coastal Federation
NCDEQ North Carolina Department of Environmental Quality NCWRC North Carolina Wildlife Resources Commission
NH4+ ammonium
NOx-N nitrate and nitrite
O2 oxygen gas
%OM percent organic matter
PO43− phosphate
%ROM percent refractory organic matter
RU recently unvegetated
Sal salinity
SAV submerged aquatic vegetation
Sed sediment
SOD sediment oxygen demand
TKN total Kjeldahl nitrogen
TN total nitrogen
TSS total suspended solids
USFWS US Fish and Wildlife Service
INTRODUCTION
The collapse of macrophyte communities and proliferation of phytoplankton in shallow lakes is a well documented, worldwide phenomenon (Berger & Vaate, 1983; Moss et al., 1986; Clugston, 1963; Engel & Nichols, 1994; Blindow, 1992, Wu et al., 2007). This shift in trophic structure is most often observed in shallow instead of deep lakes due to different impacts of abiotic factors, including light attenuation, and mixing regimes. Benthic vegetation, commonly referred to as submerged aquatic vegetation (SAV), is relegated to littoral areas in deep lakes due to light attenuation. In shallow lakes, there is relatively greater area for macrophyte growth, but actual presence is determined by a number of interacting biotic and abiotic environmental factors (Scheffer et al., 1993; Karlsson et al., 1976; Hargeby, 1994; Schleske et al., 1995; Janssen et al., 2014).
The suite of environmental variables that influence lake vegetation are those that directly or indirectly affect light attenuation. These include sediment and nutrient load, water depth, wave action, algal biomass, zooplankton and fish communities, and the presence of SAV. Once
established, SAV creates self-sustaining positive feedbacks by preventing sediment resuspension, providing refuge for phytoplankton grazers (i.e. zooplankton), and reducing nutrients in the water column that would otherwise be available for algal growth (Horpilla & Nurminen, 2003, Timms & Moss, 1984; Van Donk et al., 1989; Scheffer et al., 1993). Macrophytes die off and phytoplankton proliferate in lakes with conducive water column
nutrient levels, and where light cannot penetrate to the sediment. When this happens, the positive feedbacks from benthic vegetation are lost, resulting in cascading changes that, without external forcing, prevent a shift back to a clear water state (Scheffer et al., 1993, 2001).
After transitioning to phytoplankton dominance, returning nutrient levels to pre-shift conditions may not necessarily restore a clear water state (Scheffer et al., 1993). Both vegetative states can persist under elevated nutrient conditions until a critical threshold, dependent on the environmental factors listed above, is passed (Scheffer, 1993). This complex relationship
between nutrients and vegetative state has led to many studies investigating the fate of nutrients, specifically nitrogen and phosphorus, in between SAV and bare sediment shallow lakes and other aquatic ecosystems.
al., 1989). There have, however, been several studies with conflicting findings; Holmroos et al. (2015) found DNF rates within a shallow Finnish lake were lower in areas with SAV compared to areas with floating plants or no vegetation, due possibly to competition for DIN between SAV and sediment bacteria. Holmroos et al. (2012) suggested that resuspension, as results from SAV loss, increases rates of sedimentary DNF by promoting conditions favorable for nitrification. While most studies have documented an overall nutrient limiting effect of SAV, these studies are generally conducted as comparisons between vegetated and unvegetated areas within the
riverine, estuarine, or lake environment investigated, and therefore do not capture the shift in DNF rates and nutrient fluxes that results from a transition between SAV and phytoplankton dominance.
Study Site
allowing water level management by the US Fish and Wildlife Service (USFWS) or private citizens.
The lake is divided into two basins, east (~105 km2) and west (~60 km2), by US highway 94 (Cahoon, 1953). The basins of the lake are connected hydrologically by culverts passing beneath the highway. Despite this, the division of the east and west basins by road construction in the 1940’sresulted in a divergence of vegetative states (Waters, 2010). Until recently, the east basin was clear and macrophyte dominated, and the west basin was turbid and phytoplankton dominated (Waters, 2010). Between 2013 and 2014 the vegetation in the east basin almost completely disappeared, and algal biomass increased. During this time an area of roughly 70 km2 in the east basin that had supported dense SAV coverage transitioned to sparse or very sparse coverage (Moorman et al., 2017). Prior to this collapse, the dominant species within the vegetative community was Vallisneria americana. Other species present included Najas gudalupensis, Potamogeton perfoliatus, and Chara sp. (Sponberg & Lodge, 2005; Waters,
2010).
The timing and magnitude of vegetation loss within Lake Mattamuskeet makes it an ideal site for measuring changes in nutrient dynamics after a shift in trophic state. Unlike many
previous investigations into SAV and bare sediment nutrient cycling, this study allows a more detailed investigation of how nutrients are internally cycled before and after the loss of
vegetation. Due to the accumulation of sediment and nutrients in vegetated areas, we
hypothesized that these areas would act as a large source of nutrients once vegetation was lost. It was also hypothesized that the loss of oxic/anoxic interfaces provided by root structures would prevent the removal of bioavailable nitrogen via DNF. An increase of phytoplankton within the water column may also alter nutrient cycling by acting as a nutrient sink, which would be undetected by simply comparing bare and vegetated sediment. This nutrient sink would alter the cycling of nutrients within the system, and potentially limit sediment processes.
To investigate these hypotheses, three flow through incubations of intact sediment cores were used to measure nutrient fluxes at the sediment water interface. These cores were collected during the summers of 2016, 2017, and 2018. The sites of core extractions were chosen to investigate different factors that may impact nutrient cycling within the variable landscape of the reserve. In 2016, cores were taken within areas of the east and west basins with differing
were also measured at each coring location. Denitrification is an anaerobic process were nitrate is reduced to N2 by organic carbon, therefore factors including organic matter content of the soil and water column nutrient conditions provide context to measured nutrient fluxes.
In addition to sediment core flux measurements, two nutrient addition bioassays were conducted during the summers of 2016 and 2017. The goal of these bioassays was to investigate the phytoplankton growth response under elevated nutrient concentrations. Increased growth with nutrient addition, compared to ambient conditions, could indicate nutrient limitation within phytoplankton community. Bioassays alone are unable to show the internal cycling of nutrients between senescing and growing potions of the community, and cannot confirm nutrient
competition with sediment bacteria. They do however, give insight to the current state of nutrient limitation, identify which nutrients are most limiting, and show growth potential under elevated nutrient conditions.
Additional impetus for sediment flux experiments, nutrient addition bioassays, and water quality monitoring was the presence of previously unpublished DNF, water column and sediment quality parameter, and bioassay data collected between 2005 and 2008 (Piehler, unpublished). Comparisons could therefore be made between current to historic conditions on a longer time scale than would have otherwise been possible within the scope of this project. Data from United States Geological Survey (USGS) gages located in the east and west basins were also available and provide a time series of various water quality parameters which were used to contextualize the 2016 – 2018 summer field work experiments and provide insight into the water quality trends within both lake basins.
affect the internal loading and water quality of shallow lakes. Despite the shifting of vegetative state being a common problem in shallow lakes, and nutrients playing a key role in this
transition, a relatively small number of studies (31) have looked at nutrient cycling in vegetated versus unvegetated sediment (Hilt et al., 2017). As described above, results of such studies have been mixed, but a few include data that encompasses a transition in state.
The direct application of the work in this thesis lies in informing the watershed management activities currently underway at the Mattamuskeet wildlife refuge. Like many shallow lakes, Lake Mattamuskeet provides numerous ecosystem services. The water quality of the lake impacts the viability of recreational fishing and crabbing, as well as the habitat quality for a diverse assemblage of flora and fauna. A major motivating factor for understanding the decline in water quality is the importance of the lake as a wintering grounds for migratory waterfowl. One of the goals of the watershed management plan formulated by USFWS and local stakeholders is to restore the lake to a clear water state (NCWRC, unpublished). The actions that will be taken to do so are still being decided and must not come at the cost of the other goals of the restoration plan or livelihood of the surrounding agricultural community. A clear
SECTION 1 – EFFECT OF STABLE STATE CHANGE ON NUTRIENT SEDIMENT FLUXES
Introduction
It was also hypothesized that DNF would be highest in currently vegetated areas due to the supply of nutrients and organic matter supplied by SAV to sediment bacteria (Christensen & Sorensen, 1986; Forshay & Dodson, 2010; Risgaard-Peterson & Jensen, 1997; Caffery & Kemp, 1990; Reddy et al., 1989). Additionally, it was hypothesized that DNF rates would be positively correlated with sediment oxygen demand due to low water column nitrate concentrations. In low nitrate systems, DNF is fueled by nitrate produced via nitrification, a process which consumes oxygen (Piehler, unpublished; Piehler & Smyth, 2011, Seitzinger, 2006). In addition to sediment cores, water quality measurements were made which allowed an investigation into the impact of water column conditions on sediment processes and vice versa.
Methods
Sediment Nutrient Flux
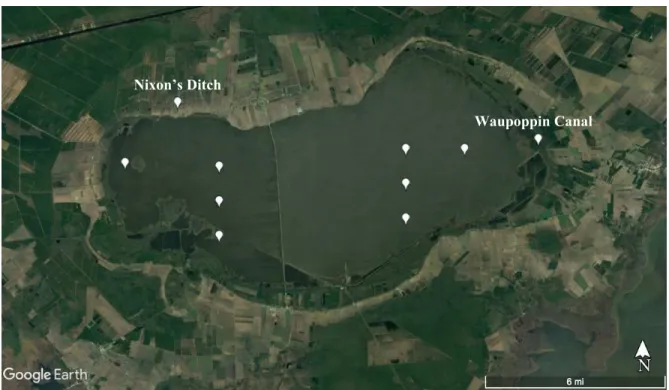
In June of 2016 USFWS vegetation survey maps were used to separate areas within the east and west basins into three categories based on the history of SAV cover (Moorman et al., 2017). Areas with moderate to dense benthic vegetation present during the 2015 vegetation survey were categorized as currently vegetated (CV), areas that lost vegetation between 2014 and 2015 were categorized as recently unvegetated (RU), and areas with no vegetation prior to 2014 were categorized as historically unvegetated (HU) (Fig. 1). One location from each category was chosen for sampling in each basin and, when possible, in a central location within the delineated area.
and analyzed for chlorophyll α (sed chl α) as a measure of benthic microalgae (Lorenzen, 1967). All samples and 75 L of overlying water were collected from each basin and transported to the Institute of Marine Sciences, Morehead City, NC (IMS).
Top rubber stoppers were removed and sediment cores were submerged in aerated basin specific water. Cores were allowed to equilibrate overnight in a dark environmental chamber (Bally Inc) until they returned to the ambient water temperature at time of collection. Caps perforated with in and outlets were inserted into core tubes, excluding air bubbles as described by Gold et al. (2017). Cores were connected to a flow through system pumping 1 mL/minute of aerated basin specific water into and out of each core via peristaltic pump (Eyre et al., 2002). Aerated feed water was introduced at the top of the water column and outflow water was removed via outlet tubes overlying the surface of the sediment by approximately 2 cm. Capped cores were preincubated for 22 hours, allowing complete water replacement within the core roughly three times, for gas fluxes to come to steady state. Cores were kept in low light conditions during set up and incubation. This was done to prevent the production of oxygen bubbles via photosynthesis.
species (DIN; NH4+, NOx–N) were subtracted from TN values to calculate dissolved organic nitrogen (DON). Dissolved organic and inorganic carbon were also measured by flow injection analysis on a Li-Cor LI-7000 CO2/H2O Analyzer. Values from inlet and core outlet water nutrient analyses, including DIC and DOC, and MIMS measurements were used to calculate fluxes based on core size and flow rate. The following equation was used to calculate fluxes (Piehler and Smyth, 2011; Miller-Way and Twilley 1996).
Flux= (Outflow concentration (μM – Inflow concentration (μM *Flow rate(L hr -1) Surface area of core sediments (m2)
After incubation, surface (3 cm) sediments from cores were collected and analyzed for percent organic matter (%OM) via loss on ignition (Byers, 1978).
Water column measurements
Temperature, conductivity, salinity, dissolved oxygen (DO), and turbidity were measured in situ in surface and bottom water using a YSI 6600EDS-S water quality sonde. Grab samples from surface water were collected at each site and, upon return to IMS, were immediately filtered on GF/F filters. Filters were analyzed for chl α (Welschmeyer, 1994), and filtrate was analyzed for nutrients. Absorbance of chromophoric dissolved organic material (CDOM) between 250-750 nm in filtered samples was measured on a Shimadzu UVmini-1240
spectrophotometer. Total suspended solids (TSS) in 1 L of water from the east and west basins was also measured by measuring the weight difference of a filter dried at 105º C and pre-weighed.
Statistical analyses
Post Hoc analyses were performed using Tukey’s HSD. The homogeneity of variance and normality of sediment quality parameter and flux data were assessed using Levene’s test and the Shapiro-Wilk test on ANOVA residuals, also at a 95% confidence interval. Linear regressions were used to investigate the relationship between DNF rates and sediment oxygen demand (SOD), sed chl α concentration, and %OM. Linear regressions were first performed on combined data from the east and west basins, and again on basin specific data. This was done due to the
large influence of basin on flux rates. All analyses were conducted using R version 3.3.3.
Results
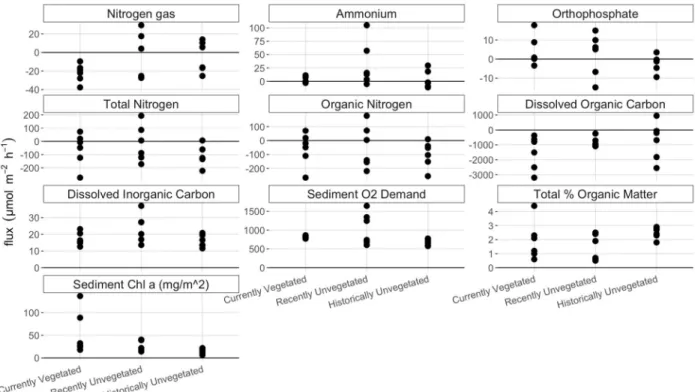
Flux and sediment parameter measurements were combined by basin and vegetative state to investigate general trends (Figs. 2, 3). All fluxes of nitrate were zero and were therefore not included in the following figures. Vegetative state did not appear to have a significant influence on the nutrient fluxes or sediment %OM and sed chl α across basin. This can be seen from the overlapping values in figure 2. Ammonium fluxes, SOD, and sed chl α did appear to have higher values in the RU or CV sites compared to other sites, however these measurements had high variance. For six of the ten variables, including fluxes of organic and inorganic nitrogen species, SOD and DIC fluxes, values from RU sites had higher variance than HU and CV sites.
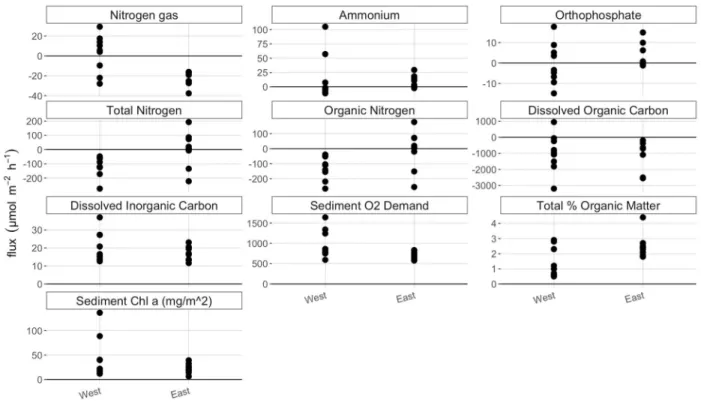
Basin appeared to have a larger influence on nutrient fluxes and sediment parameters than vegetative state. DNF was only seen in the west basin, while the east basin had only negative N2 fluxes. This N2 consumption may be indicative of nitrogen fixation (NFix), the process by which atmospheric nitrogen is transformed into bioavailable nitrogen. The variance in
west, while all fluxes in the west basin were negative. Fluxes of DIC, DOC, the SOD and sed chl α were all more variable in the west basin compared to the east. The west basin tended to have higher DIC efflux, SOD, sed chl α and lower sediment %OM.
Figure 2. Nutrient fluxes, sediment %OM, and chl α divided by vegetative state. Units on all values are in μmol m-2 hr-1 except %OM and chl α (mg/m2), as indicated in the plot title. Positive values indicate higher values in outlet compared to inlet water, i.e. efflux. Negative values indicate lower values in outlet compared to inlet water, i.e. influx. Overlap between sites
Figure 3. Nutrient fluxes, sediment %OM, and sediment chl α divided by basin. Clustering of variables by basin, and larger differences between variables when separated by basin, compared to vegetative state, indicates that basin had a larger influence on fluxes and sediment properties than vegetative state.
Tests for normality using the Shapiro-Wilk test showed that measurements of
ammonium, %OM and sed chl α were not normally distributed across basin and vegetative state at a 95% confidence interval. Due to the pairwise design of this experiment, ANOVA was still used to compare these values. ANOVA results (α = 0.05) indicated that basin and site had a significant influence on some, but not all, fluxes and sediment parameters. Basin, site, and their interaction had a significant influence on N2 fluxes, SOD, and %OM (p<0.05). Ammonium and DOC fluxes, and sed chl α were not significantly different between basins or vegetative states, and were not influenced by the interaction of basin and state (p>0.05). The interaction of basin and state had a significant influence on phosphate fluxes (p<0.05), but not basin or site
total and organic nitrogen fluxes were influenced by basin and the interaction of basin and site (p<0.05). The significance of the interaction term in this case indicates that the influence of vegetative state on measured variables was dependent on lake basin.
Results of post hoc testing are shown in figure 4. The only sites with positive DNF rates were the west RU and HU sites, which were significantly different than all other sites (p<0.05). Ammonium fluxes in the west RU site had higher values than all other sites, but due to the high variance were not significantly different. The interaction of basin and site had a significant effect on phosphate fluxes (p<0.05), but this was not seen in post hoc testing due to the higher
Figure 4. Nutrient fluxes sediment %OM, and chl α divided by basin and vegetative state. Positive values indicate higher values in outlet compared to inlet water, i.e. efflux. Letters indicate Tukey post hoc groupings. All flux values are in μmol m-2 hr-1, sediment chl α measurements are in mg/m2 and organic matter is the percent of sample that was combusted.
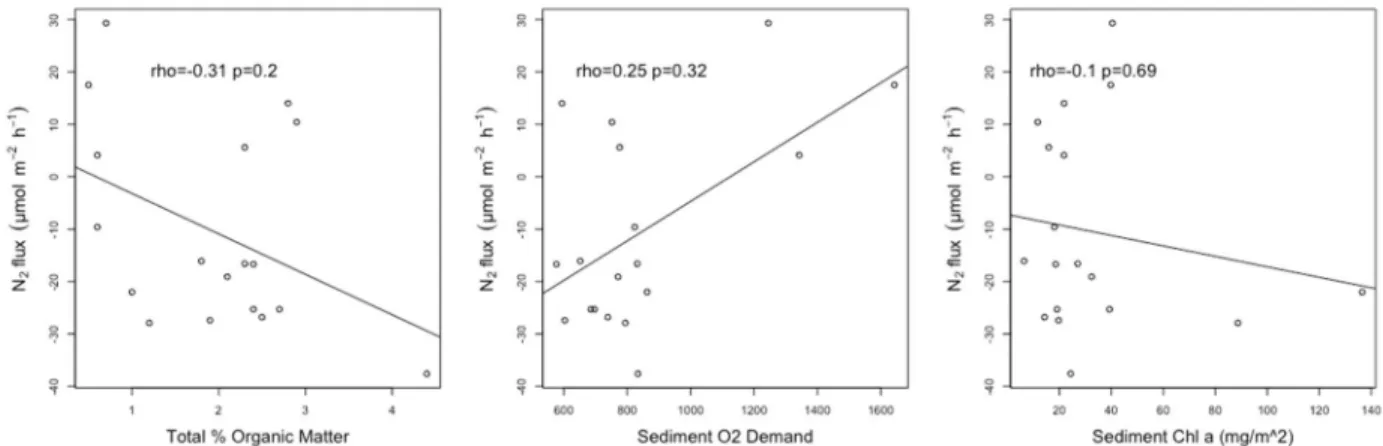
When combined by basin, SOD, sed chl α and %OM were not able to predict N2 gas flux
rates (Fig. 5). In the east basin (Fig. 6), N2 flux was negatively correlated with the sediment
%OM (ρ = -0.55), but this relationship was not statistically significant (p>0.05). All N2 gas
fluxes were negative, therefore N2 consumption increased with higher %OM. In the west basin
(Fig. 7), similar to the combined basin results, none of the three independent variables were able
Figure 5. Linear regressions between N2 flux values and sediment chl α, %OM and SOD (μmol m-2 hr-1) combined by basin. Spearman’s rank correlation coefficient (rho) and corresponding p values shown in plot.
Figure 7. Linear regressions between N2 flux values and sediment chl α, %OM and SOD (μmol m-2 hr-1) in the west basin. Spearman’s rank correlation coefficient and corresponding p values shown in plot.
Water column parameters measured at each site during the extraction of cores showed
that, similar to the flux data, basin wide trends were more apparent than trends between
vegetative states. During data collection, measurements were taken at the surface and bottom of
the water column. Due to the lack of thermal stratification within the water column, there was no
reason to suspect thermal resistance to mixing, therefore only surface measurements were
included in this analysis. While basin appeared to have a larger influence on parameters than
vegetative state, variation between basins was small for most parameters. Water clarity
parameters including attenuation and CDOM were higher in the west basin, while others
including TSS, water column chl α concentration, and turbidity varied by site and were not
consistently higher in either basin. Total and organic dissolved nitrogen concentrations were
higher in the west basin and did not vary between vegetative state in either basin.
Inorganic nutrient concentrations were low in all sampling locations (<5 μM), and
positive fluxes of nutrients from the sediment did not necessarily result in higher water column
lowest concentration of ammonium (0.6 μM), compared to the HU (1.27 μM) and CV (0.92 μM)
sites. Phosphate concentrations were highest in the RU site in the east basin, but only slightly.
The concentration in the RU site was 0.4 μM compared to 0.34 μM at the east CV site and 0.031
μM at the east HU site. Nitrate concentrations were below detection at all but one site: the east
HU site (0.28 μM). Water column chlorophyll α concentrations did not vary consistently
between vegetative state. In the east basin the CV site had highest chl α concentration (68.04
μg/L), followed by HU (40.2 μg/L) and RU (14.88 μg/L). In the west basin the RU (39.78 μg/L)
site had highest chl α, followed by CV (26.43 μg/L) and HU (8.32 μg/L).
Discussion
Denitrification was observed in the west HU and RU cores, but not in either the east or
west CV cores. This does not support the hypothesis that areas with vegetation would promote
DNF rates compared to bare sediment. Despite low water column nitrate concentrations, N2
fluxes were not correlated with SOD. Two possible explications are that in areas with DNF,
denitrifiers did not rely on nitrate from nitrification, or that little nitrification was occurring.
While not statistically significant, there was a relationship between the amount of organic matter
in the sediment and the amount of nitrogen fixation in the east basin (higher fixation rates with
higher %OM). This trend was not seen in the west basin.
Fluxes of nutrients including nitrate, ammonium, organic nitrogen, and phosphate were
not higher in unvegetated versus vegetated areas. The hypothesis that efflux from the sediment
would be highest in areas that had most recently lost vegetation, followed by areas that had
historically been unvegetated, was not supported by these data. Fluxes of phosphate were higher
in RU areas of the east basin compared to HU and CV areas, however these differences were not
these were not significantly higher than CV or HU areas. The few areas that had positive nutrient
fluxes from the sediment did not necessarily have higher water column concentrations of these
nutrients according to grab samples.
The negative fluxes of DOC, positive fluxes of DIC, and drawdown of O2 (positive SOD)
are all indicative of aerobic respiration. The cores did not become anoxic at any point during the
incubation, having 5-8 mg/L of dissolved oxygen at the final collection point during the
experiment. The lack of DNF in most of the cores suggests that one or more of the resources
necessary for this process was limiting. In several areas of the lake the sediments contained a
relatively high fraction of organic matter (2-4%) (Christensen & Sorensen, 1986). These areas
included West RU and east RU and CV, only one of which had net DNF. Other areas, including
west HU, the only other site with DNF, had a lower organic matter fraction in the sediment
(<2%). Regression analysis showed that in the east basin, there was a relationship between
higher %OM in the sediment and higher rates of nitrogen fixation. The correlation between these
two variables may have been coincidence, as it did not hold in the west basin. In all of the cores
there was a large uptake of DOC, and it is possible that this intake, along with or instead of OM
in the sediment, was fueling bacterial metabolism.
Denitrifying organisms are present in most aquatic ecosystems, but function as
facultative aerobes (Zumft, 1997). If oxygen concentrations were high in the sediment during the
incubation it is possible that denitrifiers were inhibited or respiring aerobically. Fluxes of nitrate
and concentrations of nitrate in all but one grab sample (east HU) were below detection,
therefore lack of sufficient reductant may have been limiting. Water column ammonium
limited the supply of nitrate formed during nitrification. This nitrate limitation hypothesis will be
SECTION 2 – EFFECT OF WATER COLUMN NUTRIENT CONCENTRATIONS ON DNF RATES
Introduction
The 2016 sediment core nutrient flux experiment showed low rates of N2 production
(DNF) in two areas, recently and historically unvegetated areas in the west basin, and N2
consumption (NFix) in the vegetated areas of both basins as well as recently and historically
unvegetated areas of the east basin. Vegetation did not appear to promote DNF as was predicted
from previous studies. Despite low rates of DNF, inorganic nitrogen species were low in the
water column. It was therefore hypothesized that denitrifying bacteria may be limited by low
nitrate concentrations and possibly by organic carbon availability.
In 2016, as part of a monitoring initiative funded by USFWS, ten locations were chosen
across the lake (five in each lake basin) for monthly water quality measurements (Fig. 8). This
was conducted from April to November, excluding August and September (Piehler,
unpublished). Most locations had nitrite/nitrate concentrations below detection, as was seen in
water samples taken during the 2016 flux experiment. The only areas that had detectable NOx-N
were the ditch and canal sampling locations. Lacking riverine input, these manmade structures
are the only inlets and outlets to and from the lake. Ditches and canals are present all around the
lake, and are distinguished by water flow directions. Structures where the flow direction is most
often inflow to the lake are considered ditches, and canals are typically outlets. This does not
always hold, as flow direction is dependent on water level and wind (Moorman et al., 2017). The
phosphorus concentrations than the open lake sampling sites (Piehler, unpublished). It is unclear
if these elevated concentrations were present due to the lower algal biomass in ditches and
canals, or as a result of dilution as water enters the lake.
Figure 8. Ten sampling locations, five in each basin, sampled seasonally in 2016 are shown in white. YSI data and water column nutrient concentrations were measured in four main lake locations and one canal location during each sampling event.
In the east basin, monthly samples were taken in Waupoppin Canal (35°31'7.21"N, 76°
3'40.21"W), where NOx -N concentrations ranged from 0 to 1.2 μM and peak concentrations
were seen in May and November. In the west basin, samples were taken in Nixon’s Ditch
(35°32'10.79"N, 76°16'28.63"W), one of many farm ditches flowing into the lake. NOx -N
concentrations ranged from 1.2 to 21 μM and peak concentrations were observed during the
spring and fall months.
To measure the impact of elevated water column nutrient concentrations on sediment
bacterial processes, sediment cores were taken at a ditch outfall, canal inlet, and open lake
location in each basin in June of 2017. This allowed a comparison of DNF rates in areas where Waupoppin Canal
NOx -N concentrations were on average higher than the lake proper. Denitrifying bacteria can use water column nutrients to fuel their metabolism (Scott et al., 2008). It was therefore
hypothesized that DNF rates would be higher in ditch and canal locations compared to open lake
locations. Fluxes of nutrients from cores were also measured, as was done in 2016, to investigate
the relationship between sediment nutrient fluxes and water quality parameters, including
nutrient concentrations.
Results from the 2016 flux experiment showed a trend between the sediment %OM and
the amount of NFix in the east basin, with higher organic content correlated with higher rates of
NFix. This finding was counter to hypothesized results, which predicted more DNF in sediment
with more organic material. Additional procedures were carried out in 2017 to determine the
lability and quality of organic matter present in the sediment. It was hypothesized that labile
sediment organic material would result in higher bacterial metabolism, and higher rates of DNF
due to the metabolic availability.
Methods
Sediment Nutrient Flux
In June of 2017 one ditch outlet, canal inlet, and adjacent open lake location were chosen for sampling with input from USFWS employees. This was done in part based on accessibility within the lake, as lake level limited boat access to some areas. Previously measured water column nutrient concentrations were also considered, and areas with high nutrient concentrations were targeted (Michelle Moorman & Pete Campbell, personal communication).
water (75 L) was collected at each coring location to be used as inflow and capping water. This alteration was made to ensure that nutrients in the overlying water at each location would be available to sediment bacteria. Samples of outlet water were collected five times over two days of core incubation at intervals of ~6 hours (1 turnover). Topsediment (3 cm) samples were collected at each location and analyzed with a Costech ECS 4010 CHNS-O Elemental Analyzer (Costech Analytical Technologies Inc., Valencia, CA, USA) to determine bulk percent nitrogen, and percent carbon and the C:N ratio. After incubation, surface sediments from cores were collected and analyzed for percent labile and refractory organic matter (%LOM, %ROM) via stepwise thermogravimetry as a two-step combustion (Kristensen, 1990). Fluxes of DOC and DIC were not measured in 2017.
Water column measurements
Modifications to 2016 methods are as follows. Since there was little thermal stratification was seen in 2016, temperature, conductivity, salinity, DO, and turbidity were measured in situ in top water only. To measure water column nutrients in ditch, canal, and open lake locations in both basins, 40 mL of each inflow water from the sediment core incubation was filtered on GF/F filters, and filtrate was analyzed as described in Section 1. TSS and CDOM were not measured in 2017.
Statistical analyses
test on ANOVA residuals. Post Hoc analyses were performed using Tukey’s HSD. Linear regressions were used to compare DNF rates to SOD, sed chl α concentration, %LOM and %ROM in the sediment. The same method employed in Section 1 was used: models were first fit with combined east and west data, then each basin individually.
Results
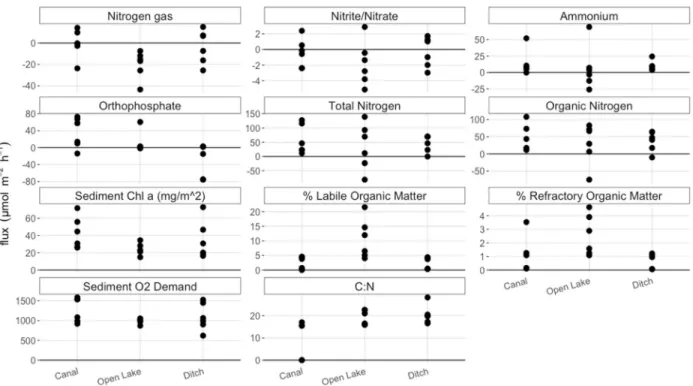
Figure 9. Nutrient fluxes, sediment %LOM, %ROM, and chl α divided by sampling location. Units on all values are in μmol m-2 hr-1 except %LOM, %ROM, the ratio of C:N (moles), and sed chl α (mg/m2), as indicated in the plot title. Positive values indicate higher values in outlet compared to inlet water, i.e. efflux. Negative values indicate lower values in outlet compared to inlet water, i.e. influx. Overlap between sites suggests that location within the lake did not have a large influence on fluxes and sediment parameters.
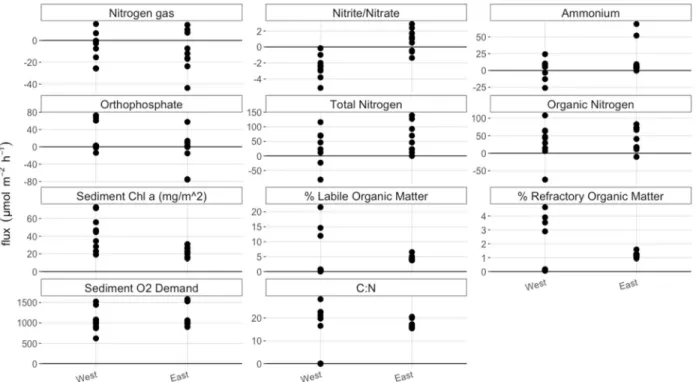
Figure 10. Nutrient fluxes, sediment %LOM and %ROM, and chl α divided by basin. Units on all values are in μmol m-2 hr-1 except %LOM, %ROM, the ratio of C:N (moles), and sed chl α (mg/m2), as indicated in the plot title. Nitrate and ammonium fluxes, as well as the two measures of %OM, and C:N ratios appeared to cluster by basin. These variables may have been more influenced by basin than location within the lake, but a clear divide between basin was less obvious in 2017 data compared to 2016 data.
site and basin (p<0.05). SOD, and fluxes of total and organic nitrogen were significantly
influenced by the interaction of basin and site (p<0.05). The significance of the interaction term in this experiment indicates that the influence of location (ditch, canal, or open lake) was dependent on lake basin.
Results of post hoc testing are shown in figure 11. There were no net positive fluxes of N2, and there were no significant differences in fluxes between sites. Nitrate fluxes in the west open lake site were significantly lower than all sites in the east basin (p<0.05), but not the ditch or canal sites in the west basin. The east open lake site had the highest ammonium flux, but fluxes between sites were not significantly different. Phosphate fluxes in the east ditch site and west canal site were significantly different (p<0.05), with the ditch site having higher influx and the canal site having a higher efflux. There were significant differences between fluxes of total nitrogen between the open lake sites in both basins (p<0.05). There were not significant
Figure 11. Nutrient fluxes, sediment %LOM and %ROM, and chl α divided by basin and site. Letters indicate Tukey post hoc groupings. Units on all values are in μmol m-2 hr-1 except %LOM, %ROM, the ratio of C:N (moles), and sed chl α (mg/m2), as indicated in the plot title. Positive values indicate higher values in outlet compared to inlet water, i.e. efflux. Negative values indicate lower values in outlet compared to inlet water, i.e. influx.
Figure 12. Linear regression between N2 flux values and sediment chl α, %LOM, %ROM and SOD (μmol m-2 hr-1) combined by basin. Spearman’s rank correlation coefficient (rho) and corresponding p values shown in plot.
When combined by basin SOD was able to predict N2 gas flux rates (ρ = 0.46, p=0.05).
N2 flux was positively related with SOD, and positive rates (DNF) were correlated with higher
SOD. No other variables, including sed chl α, %LOM, and %ROM were correlated with N2 flux
(Fig. 12). In the east basin (Fig. 13), no variables were significantly correlated with N2 flux. In
the west basin (Fig. 14), SOD was positively correlated with N2 flux (ρ=0.82, p<0.05). The
correlation of N2 and SOD seen when east and west were combined was due to the strong
Figure 14. Linear regression between N2 flux values and sediment chl α, %LOM, %ROM and SOD (μmol m-2 hr-1) in the west basin. Spearman’s rank correlation coefficient (rho) and corresponding p values shown in plot.
Due to an equipment malfunction, several water quality parameters are missing from the 2017 dataset including water column chl α measurements from the east and west canal locations, specific conductivity and optical DO concentrations in the west canal location and turbidity in the east basin. Some parameters showed similar trends to 2016 data, where basin-wide trends appeared to dominate the variation in measurements. The temperature and salinity were
higher in the open lake locations of both basins compared to the ditch location, the only other sites with data.
Ditch and canal outfalls and inlets in both basins had low nutrient concentrations, despite high anticipated concentrations based on previous measurements. Additionally, nutrient
concentrations did not vary consistently between sites. The highest nitrite/nitrate concentration measured was in the west open lake location (0.14 μM), and all other concentrations were below detection. Ammonium concentrations were highest in the west open lake location (2.11 μM), followed by west ditch (1.44 μM); all other measurements were ≥ 0.5 μM. The site with the highest phosphate concentration was the east ditch site (4.26 μM), and all other concentrations were <1 μM. Total and organic N concentrations did not vary consistently between site or basin, and were similar between all sites (66 – 78 μM).
Discussion
Ditch and canal inlets and outlets did not have higher DNF rates compared to open lake sites. This was the predicted outcome due to higher nutrient concentrations measured during a 2016 monitoring initiative. When inflow water was tested, however, nutrient concentrations were much lower than expected from previous sampling events. It is possible, therefore, that this sediment flux experiment did not capture the nutrient gradient intended. Due to this, these
canal/ditch – lake interface. With the elimination of variable nitrate concentrations impacting DNF rates, it would be anticipated that the nutrient fluxes and relationship of fluxes with water column and sediment parameters would mirror those of the 2016 flux experiment. In 2016, N2 flux rates ranged from -38 to 29 μmol m-2 hr-1 and in 2017 rates ranged from -43.5 to 15 μmol m-2 hr-1.
Due to the similarity in rates, it may be expected that the relationships between N2 fluxes
and sediment properties found in 2016 would be the same in 2017, but this was not the case. In
2016, the amount of NFix increased with increasing %OM. In 2017 there was no relationship
between N2 fluxes with %LOM or %ROM, but there was a positive relationship between N2 gas
fluxes and O2 consumption. The two-step combustion showed that LOM composed a higher fraction of the total OM than ROM in most samples. The total %LOM ranged from 0 to 22% percent, all areas except the west ditch and canal locations having ≥ 4%. This fraction of the organic matter pool is available to sedimentary bacteria, including denitrifying bacteria: therefore, organic matter was likely not limiting to bacterial metabolism at most sampling locations.
SECTION 3 – WETLAND NUTRIENT FLUXES UNDER AMBIENT AND NUTRIENT SPIKED CONDITIONS
Introduction
After the 2017 water column nutrient analyses were completed, it became clear that efforts to capture a nutrient gradient, and the impact of this gradient on DNF at the sediment water interface, were not successful. Findings from the 2016 and 2017 flux experiments also showed that vegetation loss within the lake did not have a clear impact on nutrient efflux or DNF. Nitrogen gas fluxes were negative in almost all areas of the lake, possibly indicative of NFix. This lack of DNF raised the question: how are DIN concentrations within the water column below detection while nutrient loading from the watershed is high?
Estimates of nutrient loading to the lake from the combined effects of agricultural runoff, wet and dry atmospheric deposition, impoundment drawdown, and inputs from migratory
reflected within the lake. It was therefore still a question: which factors within the environment keep the DIN concentrations low?
One possible explanation is that there exists a discrepancy between the DIN entering the watershed and the concentration reaching the lake. This hypothesis is supported by a depth of literature regarding the nutrient retention and removal capacity of wetland areas. Emergent wetland plants, like SAV, have been shown to enhance denitrification (Reddy et al., 1989). DIN running off the watershed may be removed in wetland areas before reaching the lake. Another hypothesis is that phytoplankton growth is sequestering DIN species within biomass. This will be explored further in Section 4.
Along with testing the hypothesis that wetlands are removing nutrients before they enter the lake, there was additional interest in measuring DNF and nutrient fluxes in wetland areas in order to better understand how nutrient dynamics are impacted by the timing of impoundment drawdown. Impoundments are distinguished from natural wetlands by the presence of water control structures. These structures include flash-board risers and water pumps, which allow passive and active management of water level by the USFWS (Winton et al., 2016).
To measure the nutrient retention and removal in wetland, dry, and flooded
impoundments, and compare them to open lake rates, a third round of sediment cores were collected in June of 2018. In the west basin, cores were taken in a littoral wetland area, flooded impoundment, and open lake area. In the east basin a dry (instead of flooded) impoundment was sampled along with wetland and open lake locations. The dominant vegetation in the flooded impoundment and wetland areas included Phragmites australis, Nymphaea sp. and Juncus sp. Two types of impoundments, moist soil managed wetland impoundments (wetland
impoundments) and agricultural, are present within the Mattamuskeet refuge. However, for this experiment only wetland impoundments were sampled. The landscape surrounding the lake has been greatly modified over many years and few areas of disconnected unmanaged wetland with emergent aquatic vegetation are present. For this reason, littoral wetland areas connected to the lake were sampled. To further investigate the nitrate limitation hypothesis outlined in Sections 1 and 2, each inflow water source was given a nitrate addition (N addition) midway through the incubation. Fluxes measured before this addition are considered ambient. Those measured after, referred to as spiked, represent fluxes occurring under high nitrate conditions such as a storm event following fertilizer application.
Methods
Sediment Nutrient Flux
water for cores collected at this site. Basin specific lake water was used for all other cores. This was done to account for the large difference in measured water quality parameters between open lake and west impoundment water. Samples of outlet water were collected six times over two days at intervals of ~6 hours. After collection of the third sample (32 hours after start of incubation) NaNO3 was added to bring the nitrate concentration of feed waters to 20 μM NO3-. Along with water samples for MIMS analysis taken three times after nutrient addition, a second set of 40 mL samples was collected during the fifth collection period (48 hours after start of incubation) and analyzed for nutrients as described in Section 1. The %LOM and %ROM were measured as described in Section 2. Fluxes of DOC and DIC were not measured in 2018. Water column measurements
Modifications to 2016 methods are outlined in Section 2. Additional modifications are as follows. Sediment pore water was collected via hand vacuum pump modified from Winger & Lasier (1991) using mesh lined tubing instead of an air stone. These samples were collected in the east and west wetland and impoundments, and the west open lake site. The east open lake site was not sampled due to an equipment malfunction. Pore water samples were filtered on GF/F filters and analyzed for nutrients as described in Section 1.
Statistical analyses
variance and normality of values for each variable were assessed using Levene’s test and the Shapiro-Wilk test on ANOVA residuals. Post Hoc analyses were performed using Tukey’s HSD. Linear regressions were used to compare DNF rates to SOD, sed chl α, %LOM and %ROM from sediment samples. The same method employed in Section 1 was used here: models were first fit with combined east and west data, then each basin individually.
Results
As was observed in 2017, site had a significant impact on some, but not all, nutrient fluxes and sediment parameters. Figure 15 shows these values combined by basin and N addition. Ambient values are those observed before the nitrate additions, and spiked values are those observed after. Sediment parameters were only measured once during core collection, as these values were not expected to change significantly as a result of increased water column nutrients.
conditions between all sites. SOD was highest in the wetland site, while the lake and impound sites were roughly equivalent, and no fluxes changed significantly after the N spike. All sediment parameters, sed chl α, %LOM, %ROM, and C:N ratios were highest in the wetland sites.
Figure 15. Nutrient fluxes, sediment %LOM and %ROM, and sediment chl α divided by site and N addition. Units on all values are in μmol m-2 hr-1 except %LOM, %ROM, the ratio of C:N (moles), and sed chl α (mg/m2), as indicated in the plot title. Open lake sites noted as “Lake”.
basins after the spike. Phosphate fluxes were similar between basins and ambient vs. spiked conditions. The west basin under ambient conditions had the highest efflux, but had a wide spread in values, resulting in similar mean values between basins. Fluxes of TN and DON were higher in the west basin under ambient conditions, and were lower on average after the spike. The spike had little effect on the SOD in either basin. All samples had net positive oxygen demand, and values were higher in the east basin. Both basins had similar sed chl α levels, however values in the west basin had higher variance. The %LOM and %ROM were higher in the west basin, and the C:N ratio was higher in the east basin.
Nutrient flux measurements were not normally distributed at a 95% confidence interval. However, due to the pairwise design of this experiment ANOVA was still used on these data. Differences in fluxes and sediment parameters split by site, basin, and N addition are shown in figure 17, and results of post hoc testing are summarized in table 1. N2 fluxes were significantly different between basin and site (p<0.05). Ammonium fluxes were influenced by the N addition, the interaction of basin and site, and the interaction of basin, site, and N addition (p<0.05). Phosphate fluxes were not significantly different between basin, site, or before after the N addition. TN and ON fluxes were significantly different between sites, and were significantly influenced by the interactions of basin and site, basin and N addition, site and N addition, and the interaction of all three basin, site, and N addition (p<0.05). SOD was significantly influenced by basin, site, and the interaction of these two variables (p<0.05). Sediment chl α concentrations were significantly different between sites, and were influenced by the interaction of basin and site (p<0.05). The two measures of %OM of the sediment were significantly influenced by basin, site, and the interaction of basin and site. This interaction also significantly influenced the C:N ratio of the sediment. The three-way interaction term indicated that the influence of site
depended on basin, and the interaction of basin and site varied between ambient and spiked conditions.
Among the spiked cores, the west impound site had the most uptake, significantly more than all sites but the east wetland (p<0.05). Nitrogen addition did not result in significant changes in ammonium fluxes within cores, the significant differences that emerged after the spike were between non-corresponding sites within and between basin. For example, the east wetland cores had significantly more ammonium efflux than the east impound, east lake, and west lake ambient conditions (p<0.05). Differences such as this, between spiked and ambient cores of
non-corresponding site or basin, are not informative in the context of this experiment and will not be discussed in detail but are shown in table 1. Mean phosphate flux was highest in the west lake site under ambient conditions, but there were no significant differences between fluxes. Fluxes of TN and ON were highest in the west wetland site but this trend was not significant. Rate of ON and TN efflux in the west wetland site significantly decreased after the N addition (p<0.05). No other TN flux change significantly after the N addition. ON fluxes changed significantly after the spike in all west sites, although in different directions. The impound site switched from net influx to net efflux, while the wetland and lake sites went from net efflux to no net change (p<0.05). The N addition had no significant impact on the SOD of any cores, before and after the spike. The east wetland site had significantly higher demand than any other site (p<0.05).
ratio was highest in the east wetland site, significantly higher than the east impound and west wetland sites (p<0.05).
Figure 17. Nutrient fluxes, sediment %LOM and %ROM, and chl α divided by site, basin, and N addition. Units on all values are in μmol m-2 hr-1 except %LOM, %ROM, the ratio of C:N
Table 1. Results of post hoc testing of two and three-way ANOVAs of fluxes and sediment parameters. Letters indicate groupings of site, basin, and N addition where groups sharing at least one letter are not statistically different from each other. N addition is indicated as either ambient or spike, indicating fluxes measured under ambient lake conditions or after the NO3 -addition. NAs are present for parameters that were measured once under ambient conditions.
relationships are summarized in figure 18.
Figure 18. Linear regression between N2 flux values, SOD (μmol m-2 hr-1), and %ROM in the west basin after N addition, and east basin under ambient conditions. Spearman’s rank
correlation coefficient (rho) and corresponding p values shown in plot.
Water column parameters were measured at sites where feed water was collected, which included the east and west main lake sites and the west impound site. The west impound site had slightly lower salinity and lower DO (1.5 mg/L) than the main lake locations, which had > 9 mg/L. NOx-N concentrations were zero in all sites. The west impound site had much higher ammonium (11 μM) compared to the lake sites. All sites had high TN and DON, and low
phosphate (<1 μM). Porewater was collected at all but the east main lake location. The results of pore water sampling showed that the west wetland, east wetland, and east impoundment
locations had detectable NOx-N concentrations. The wetland locations had higher concentrations (3-5 μM) compared to the impoundment location (0.3 μM). All sites had high porewater
than the west basin sites. TN levels were also very high, reflecting the high ammonium, resulting in low calculated ON concentrations. Within the west basin, the only basin with a complete set of porewater measurements, concentrations were highest in the wetland site followed by the open lake, then the impoundment sites. Phosphate was highest in the dry east impoundment (3 μM) and <1 μM in all other sites.
Discussion
The wetland and impoundment areas were expected to have higher rates of nutrient uptake and DNF than open lake locations due to the presence of emergent vegetation and high nutrient delivery from the watershed. The dry impoundment site in the east basin was the only site to have a positive N2 flux. All other sites showed NFix, or rates not significantly different than zero. Cores collected in the dry east impoundment were inundated with water during the flow through experiment. These cores therefore represent a recently flooded landscape, as would be seen during seasonal impoundment flooding. This suggests that recently flooded
impoundments have the highest DNF potential compared to inundated impoundments, wetland and open lake areas. Under ambient conditions, the wetland and impoundment areas in both basins did not have consistently higher nutrient influxes to the sediment compared to open lake sites. Sediment OM content was the only significant predictor of N2 fluxes, though this
relationship was only significant in the east basin under ambient conditions. There was also no distinction between LOM and ROM fractions as both were significant predictors.
flux trends present under ambient conditions to become significantly different between sites. This finding suggests that the addition of nitrate is not enough to stimulate DNF. Although further analyses would be needed to determine the cause of low measured DNF rates, another hypothesis is that sediment oxygenation, as a result of resuspension, could be a factor. As
discussed in Section 1, the uptake of nitrate by denitrifying organisms is inhibited in the presence of oxygen (Zumft, 1997).
Direct measurements of oxygen penetration depths have not been done, but the existing data gives several hints as to the microenvironment within the sediment. Wind driven
resuspension is one method of oxygenating the top layer of sediment. From field work at Lake Mattamuskeet, it is apparent that there is wind driven mixing within the lake. The sediment in most areas of the lake has a gelatinous consistency, the top layers of which are composed mostly of water. Upon collection of cores the water clarity within the cores is poor. Water clarity
Figure 19. 2016 measurements of total suspended solids (mg/L) and attenuation combined by basin and month. The linear relationship suggests there is a strong influence of the concentration of suspended solids on light attenuation.
Between 2016 and 2018 the influences of submerged and emergent vegetation, sediment organic matter, benthic microalgae, and nitrate limitation on DNF rates were explored. The results of these experiments did not conclusively point to a certain habitat type or vegetative state as a site of nutrient retention and removal. From these findings arose several questions, the first of which was how, without high rates of removal within the sediment via DNF, the DIN
(particularly nitrate concentrations within the lake) were minimal. It was hypothesized that phytoplankton uptake may explain these concentrations, and a series of bioassays were
SECTION 4 – INVESTIGATING CONTROLS ON DNF, PHYTOPLANKTON NUTRIENT LIMITATION, AND LONG-TERM TRENDS WITHIN THE LAKE USING
HISTORICAL DATA
Introduction
There has long been interest in understanding the differences in ecosystem function between the east and west basins of Lake Mattamuskeet. Prior to the collapse in vegetation, the lake persisted in two vegetative states despite similar physical and environmental conditions between basins. This prompted several studies and monitoring projects investigating the differences in nutrient processing, primary producer nutrient limitation, and water column
parameters between basins over time. Within the Piehler lab, two sediment core flux experiments were conducted in July and August of 2008 which measured nutrient transformations, including DNF. Four nutrient addition bioassays were conducted between 2005 and 2006, and water quality monitoring was conducted seasonally in 2008. In addition to these data, USGS gage stations began collecting data in both basins of the lake in 2012. The parameters measured by these stations include temperature, gage height, specific conductivity, dissolved oxygen, pH, salinity, and turbidity. USFWS also has a lake monitoring data set that includes water column nutrient concentrations dating back to 1985, with consistent sampling from 2012 – 2015.
Long term trends in water column nutrient and chl α concentrations
having highest concentrations in the east basin. NOx-N concentrations were generally low, median value 0.33 μM, with a highest recorded value 11.77 μM. NH4+ had a median value of 1.3 μM and peak of 33.3 μM. ON had a median value of 84.5 μM and peak of 127 μM in August, while TN had a median value of 89.5 μM and peak value of 127 μM in August. Phosphate had a median value of 0.08 μM and peak value of 0.57 μM. The N:P ratio was above 16 in 80% of samples, except in in March and August, which may indicate phosphorus limited phytoplankton growth (Redfield, 1953), at least historically. This, however, is difficult to determine solely by nutrient ratios, as freshwater phytoplankton have high variability in their elemental stoichiometry (They et al., 2017).
In the 2016 monitoring initiative described in Section 2, NOx-N concentrations were below detection at all open lake locations, and peak concentrations were found in canals. The highest concentration measured was at the east canal location, 57.8 μM. The median NH4+ value was 1.3 μM, and peaked in November at 4.2 μM, excluding ditch sampling locations. The second highest concentrations were recorded in April. Within the canals, the peak value was 154.3 μM in the west basin in July. While ditch sampling locations had much higher DIN concentrations, open lake locations had median values similar to those measured in 2008. NOx-N was
basin in June. The N:P ratios shifted towards nitrogen limitation in the 2016 measurements, with only 11 of the 58 total measurements having ratios over 16.
Although nutrient concentrations were very high in canal sampling locations, water column chl α was much lower than open lake sampling locations. This could be due to flushing of canal water, or higher turbidity at these sites resulting in light limitation. Chl α measurements were collected in March, May, July, and August of 2008, see Section 1 for methods. The median chl α in 2008 was 36.6 μg/L and a peak value of 68 μg/L occurred in March. In 2016 the median chl α concentration, excluding canals, had risen to 59.85 μg/L, with a peak value of 105.5 μg/L in July.
Grab samples collected by USFWS date back 34 years, but represent an inconsistent time series of lake conditions. Measured variables include total and inorganic phosphorus, total Kjeldahl nitrogen (TKN), NOx-N, NH4+, total nitrogen, and water column chl α. Investigation of this data set suggests that dissolved nutrient concentrations have not increased in the lake’s recent history. Nitrate and ammonium concentrations were below detection in almost all
From the 2008 and 2016 seasonal data, it appears that nutrient concentrations have not increased, but the timing of peak concentrations have shifted from spring to summer for most nutrients. Nutrient limitation within the phytoplankton community may have shifted from phosphorus limited to nitrogen limited conditions. To investigate this shift, two nutrient addition bioassays were carried out between 2016 and 2017 and compared to historic bioassays conducted between 2005 and 2006.
Current and historic nutrient limitation
Figure 20. 2005 – 2017 bioassay chlorophyll α (μg/L) measurements at the 48 hour collection point. Colors indicate nutrient treatments, and years are shown along the x axis. Lines indicate +/- standard error. The 2017 bioassays conducted on canal water is shown as ‘6/19/17 Canal’. Controls on DNF
In July and August of 2008, six sediment cores were taken in each basin of the lake, totaling twelve cores, all in open lake areas. A flux experiment was conducted according to Section 1 methods, though fluxes of DIC and DOC were not measured. During these samplings, water column and sediment quality parameters were also measured, according to methods in Section 1. Two-step combustion was not performed on sediment samples in 2008. These data were compiled with data from 2016, 2017, and 2018 (Table 2). In the cases where two
Table 2. Sediment fluxes, sediment quality, and water column parameters measured by year. Highlighted in gray were the unique measurements taken during each sampling event chosen for correlation analysis. Fluxes of nutrients are labeled as chemical forms; water column nutrients are labeled with ‘W’ preceding forms.
Figure 22. Correlation plot of west and east basin limited to variables with highest correlation coefficients. Along the diagonal of the plot variables are listed. The top and bottom of the plot, divided diagonally, are two representations of the Spearman’s rank-order correlation coefficients. The size and color of circles in the top diagonal represent the degree of correlation and if this correlation is positive or negative. Correlation coefficients are shown in the bottom diagonal.
When correlations of combined east and west basin measurements were calculated, there were no significant correlations of N2 with any other variables. Of the variables with highest correlation coefficients with DNF, DON, %OM, and water column turbidity were positively correlated, and SOD, water column ON, sed chl α, and water conductively were most negatively correlated. When separated by basin, variables with highest correlation to DNF changed (Fig. 22). In the west basin, N2 flux was negatively correlated to SOD, conductivity, and dissolved oxygen, and positively correlated to %OM. In the east basin, DNF was negatively correlated with %OM and water column chl α, and positively correlated to dissolved oxygen. Even when separated by basin, none of these correlations became statistically significant.
around 500 μS/cm. There are no distinct seasonal fluctuations. For comparison, the conductivity of seawater (35 ppt salinity) is 53,000 μS/cm at 25°C. The decrease in conductivity roughly coincided with the establishment of the Mattamuskeet drainage association watershed restoration plan, put in place between 2010 and 2013, which decreased freshwater drainage into Pamlico Sound (NCDEQ, NCCF). Oxygen levels fluctuate seasonally, with highest concentrations present late winter/early spring and lowest concentrations in late summer/early fall. The DO measurements used for this correlation matrix only captured summer variability, and
concentrations ranged from 1.5 – 11.8 mg/L. In the east basin DNF was positively correlated with DO, and in the west these variables were negatively correlated. If DO has an influence on DNF, this may influence seasonal fluctuations in rates of DNF. This seasonality of
Discussion
Lake Mattamuskeet and the surrounding watershed has a long history of human impact, and has experienced declines in water quality and shifting vegetative state likely as a result (Cahoon, 1953; Moorman et al., 2017). Measuring the nutrient dynamics within shallow lakes like Mattamuskeet is important for understanding how these ecosystems function, and how this function changes with anthropogenic influence. Submerged vegetation has been shown to promote nitrogen removal via DNF (Christensen & Sorensen, 1986; Forshay & Dodson, 2010; Jensen & Risgaard-Peterson, 1997; Caffery & Kemp, 1990; Reddy et al., 1989), therefore a shift in ecosystem state was hypothesized to alter these services. The experiments conducted for this work have shown that the loss of vegetation has not greatly impacted the nutrient retention or removal services within Lake Mattamuskeet.
DNF potential appears to be relatively low throughout the lake and watershed, with the exceptions being certain areas of the west basin and impoundments shifting from dry to flooded conditions. The experimental addition of nitrate did not promote DNF, and areas of the lake were not correlated with higher concentrations of nitrate in the water column. It is therefore unlikely that nitrate limitation is leading to these low rates of DNF. Also explored was the relationship between DNF and the amount of organic matter and benthic microalgae (sed chl α) in the sediment. Generally, there was an increase in Nfix in areas with higher %OM, and little