BALANCING GROWTH: MECHANISMS UNDERLYING CEREBELLAR DEVELOPMENT AND MEDULLOBLASTOMA PATHOGENESIS
Jennifer Karín Ocasio Adorno
A dissertation submitted to the faculty at the University of North Carolina at Chapel Hill in partial fulfillment of the requirements for the degree of Doctor of Philosophy in the Biological
and Biomedical Sciences Program (Neuroscience Curriculum) in the Graduate School.
Chapel Hill 2019
Approved by: Timothy R. Gershon
ii © 2019
iii
ABSTRACT
Jennifer Karín Ocasio Adorno: “Balancing growth: mechanisms underlying cerebellar development and medulloblastoma pathogenesis”
(Under the direction of Timothy R. Gershon)
Development of the nervous system requires precise regulation of proliferation to prevent neurological diseases such as microcephaly or cancer. Particularly, postnatal neurogenesis in the cerebellum gives rise to the largest population of neurons in the brain, cerebellar granule neurons (CGNs). Thus, cerebellar neurogenesis must be tightly regulated to prevent growth failure which could give rise to cerebellar hypoplasia or hyperproliferation, which can lead to the formation of tumors like medulloblastoma. While the mechanisms driving proliferation in the cerebellar granule neuron progenitors (CGNPs) is widely known to be mostly dependent on Sonic Hedgehog signaling (SHH), little is known about the mechanisms that oppose growth and promote differentiation. Furthermore, whether CGNP-derived medulloblastomas require similar mechanisms to promote growth remains unclear.
iv
Pharmacological inhibition of GSK-3 in vitro was sufficient to block CGNP and medulloblastoma tumor cell growth. Together, our research suggests that endogenous GSK-3 is necessary to prevent WNT signaling in the cerebellum and medulloblastoma to promote SHH-driven proliferation.
In Chapter 3, we used single-cell transcriptomics analysis to probe the response of medulloblastoma tumor cells to a SHH pathway inhibitor, vismodegib. Administration of vismodegib produced a heterogenous response in SHH-driven tumor cells, leading to recurrence. We identified distinct cell types in untreated tumors, including stromal cells and tumor-derived cells in a spectrum of proliferative and differentiated states, through Drop-Seq. Vismodegib reduced a subset of proliferative tumor cells and enriched cells in a differentiated state. However, a subset of proliferative tumor cells, which expressed stem cell markers or persistent SHH-pathway activation remained after vismodegib treatment. Our findings demonstrate diversity within tumors that can confer inherent resistance to targeted inhibitor therapies.
v
Dedicated to my family and friends, you have made this journey worthwhile. Para mi familia, especialmente mis padres, Jenny y Félix, y mi hermana, Jessica. Gracias por su apoyo a través de todos estos años. Me han enseñado el valor del trabajo y de hacer las cosas bien desde un principio. Gracias por las noches tardes y las mañanas tempranas. Los quiero
vi
ACKNOWLEDGEMENTS
First and foremost, I would like to thank my graduate advisor and mentor, Dr. Tim Gershon. Thanks to Dr. Gershon, who believed in me from the start, I have achieved more than I ever thought possible. It has been an honor and a joy to work in the Gershon lab for my graduate career and I am immensely grateful for all of the opportunities and the advice I have received. I will be sure to take the lessons I’ve learned with me wherever I go.
I would also like to thank the faculty and staff in the Neuroscience Curriculum, the Biological and Biomedical Sciences Program (BBSP), and the Initiative for Maximizing Student Diversity (IMSD). I have received a lot of support and advice from many wonderful people along the way who have gone above and beyond to make me feel like I belong. Thank you to my committee, Drs. Stephanie Gupton, Ben Major, Juan Song, and Steve Crews, who have helped shape my projects and encouraged me over the years. Thank you to my co-mentor, Dr. Mohanish Deshmukh, whose support helped me assure funding to support my work and who has always been available for a chat, science-related or not.
vii
present, who are too numerous to list, who have become my friends, and who will hopefully become collaborators in the future.
viii
TABLE OF CONTENTS
LIST OF FIGURES ... xii
LIST OF TABLES ... xiv
LIST OF ABBREVIATIONS AND SYMBOLS ... xv
CHAPTER 1: INTRODUCTION ... 1
Cerebellar development depends on SHH signaling ... 1
Medulloblastoma is a disorder of cerebellar development ... 3
WNT signaling regulates proliferation and differentiation in diverse cell types ... 6
Single-cell sequencing deconvolutes cellular diversity in complex tissues ... 7
Microcephaly genes may provide new targets for medulloblastoma treatment ... 8
CHAPTER 2: GSK-3 IS NECESSARY TO SUPPRESS WNT/CDKN1A SIGNALING DURING CEREBELLAR DEVELOPMENT AND MEDULLOBLASTOMA GROWTH ... 10
Introduction ... 10
Results ... 13
Gsk-3DKO mice exhibit severe cerebellar hypoplasia ... 13
Loss of Gsk-3 impairs proliferation early in postnatal development but does not induce apoptosis ... 13
Molecular signatures of Gsk-3 deletion include WNT and CDKN1A signaling ... 15
CTNNB activation drives hypoplasia in Gsk-3 deleted cerebella ... 16
ix
Pharmacological inhibition of GSK-3 blocks CGNP proliferation ... 19
Deletion of Gsk-3 in medulloblastoma-prone mice blocks tumor growth ... 19
Pharmacological inhibition of Gsk-3 blocks tumor growth in vitro ... 21
Discussion ... 22
Methods ... 24
Figures ... 29
Tables ... 36
CHAPTER 3: SINGLE-CELL TRANSCRIPTOMICS REVEALS CELLULAR HETEROGENEITY IN SHH-DRIVEN MEDULLOBLASTOMAS WITH DIFFERENTIAL RESPONSES TO VISMODEGIB ... 42
Introduction ... 42
Results ... 44
Vismodegib initially slows medulloblastoma growth in M-Smo mice ... 44
Drop-seq analysis defines discrete subsets of stromal and tumor cells ... 45
SHH-driven medulloblastomas contain cells in a range of differentiation states that resemble CGNP development ... 46
M-Smo tumor cells exhibit two discrete fate trajectories ... 47
Lineage tracing identifies tumor cell differentiation along a glial trajectory ... 49
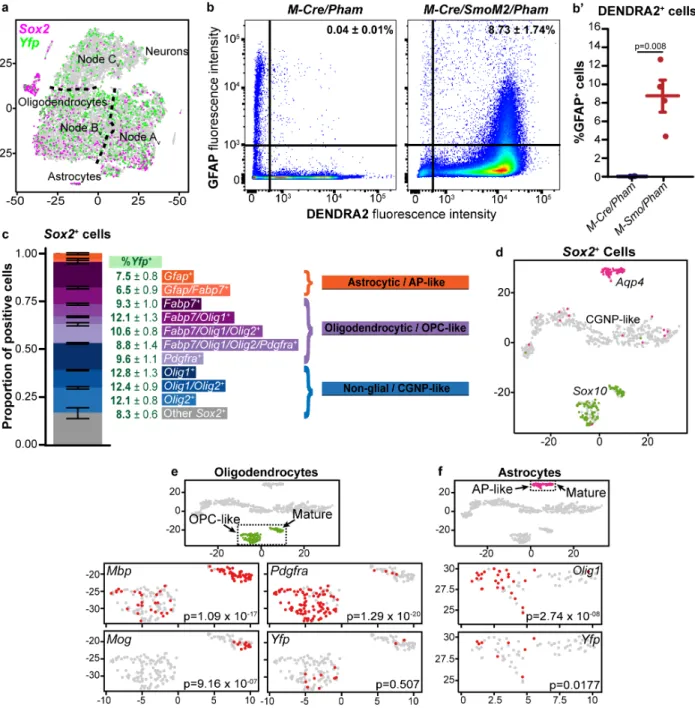
Tumors contain a diverse set of cells expressing stem cell markers ... 51
Inhibiting SHH signaling at SMO promotes differentiation ... 52
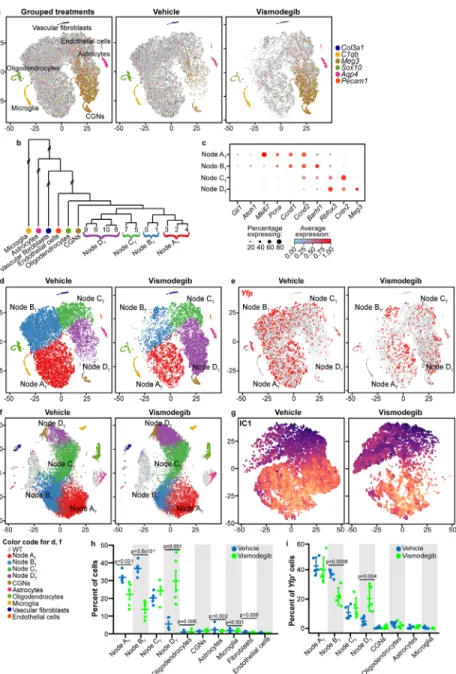
Uneven depletion of proliferative tumor subtypes indicates variation in vismodegib sensitivity ... 53
SHH pathway activation persists in vismodegib-resistant medulloblastoma cells ... 54
x
Potential factors regulating vismodegib resistant tumor cells ... 57
Sox2+ cells respond heterogeneously to vismodegib ... 59
Discussion ... 59
Methods ... 62
Figures ... 73
Tables ... 81
CHAPTER 4: ONGOING WORK: RNA-PROCESSING THROUGH MAGOH IS NECESSARY TO PROMOTE CEREBELLAR GROWTH ... 97
Introduction ... 97
Results ... 100
Magoh haploinsufficiency impairs cerebellar growth ... 100
Conditional deletion of Magoh depletes CGNPs by inducing DNA damage and apoptosis ... 101
Magoh deletion induces DNA damage and apoptosis in proliferating CGNPs ... 102
Loss of Magoh induces DNA damage throughout the cell cycle ... 102
DNA damage response in Magoh-deleted cells depends on p53 ... 103
Magoh is required for SHH-driven medulloblastoma growth ... 103
Discussion ... 104
Methods ... 106
Figures ... 109
Tables ... 115
CHAPTER 5: DISCUSSION ... 118
GSK-3 regulates SHH-driven growth in the cerebellum and medulloblastoma ... 118
xi
Cellular heterogeneity in medulloblastomas causes treatment failure
in response to vismodegib ... 125
Future Directions ... 126
MAGOH is required to prevent cell death in CGNPs and CGNP-derived tumor cells ... 128
Future Directions ... 129
Figures ... 133
APPENDIX: SUPPLEMENTAL MATERIALS ... 134
Supplemental materials for Chapter 2 ... 134
Supplemental materials for Chapter 3 ... 138
xii
LIST OF FIGURES
Figure 2.1. Gsk-3 deletion in CGNPs causes cerebellar hypoplasia
early in development without inducing apoptosis. ... 29
Figure 2.2. GSK-3 is required for CGNP proliferation and cell cycle progression. ... 30
Figure 2.3. GSK-3 inhibition blocks proliferation in vitro. ... 31
Figure 2.4. Transcriptional analysis reveals upregulation of WNT/ CDKN1A signaling in Gsk-3DKO mice. ... 32
Figure 2.5. CTNNB modulates CGNP proliferation downstream of GSK-3. ... 33
Figure 2.6. Reduced proliferation in Gsk-3-mutants is independent of p53 and CDKN1A. ... 34
Figure 2.7. GSK-3 is required for Shh-driven medulloblastoma tumor growth ... 35
Figure 3.1. Vismodegib treatment induces initial tumor response in M-Smo mice followed by rapid recurrence ... 73
Figure 3.2. Single cell transcriptomic identifies discrete types of cells in M-Smo tumors ... 74
Figure 3.3. The tumor cells predominantly map to CGNPs when projected on the WT P7 cerebellum ... 75
Figure 3.4. ICA on CGNP-like tumor cells demonstrates the latent factors of self-renewal and differentiation ... 76
Figure 3.5. Tumors show lineage expansion and stem cell marker expression ... 77
Figure 3.6. Vismodegib advances differentiation while depleting specific subsets of proliferative tumor cells ... 78
Figure 3.7. HES1 and MYOD1 mark vismodegib-responsive and vismodegib-resistant subsets of medulloblastoma cells ... 79
Figure 3.8. Factors that maintain proliferative and stem-like phenotypes after vismodegib ... 80
Figure 4.1. Magoh loss in CGNPs inhibits cerebellar growth ... 109
Figure 4.2. Deletion of Magoh at the peak of postnatal neurogenesis inhibits cerebellar growth ... 110
Figure 4.3. Loss of Magoh induces DNA damage and apoptosis through activation of p53 and CDKN1A ... 111
xiii
Figure 4.5. Co-deletion of trp53 partially rescues the MagohCreER phenotype ... 113
Figure 4.6. Conditional deletion of Magoh in medulloblastoma-prone SmoA1 mice inhibits tumor growth... 114
Figure 5.1. Maximal tolerated dose (MTD) study in WT mice treated with increasing doses of CHIR-98014 ... 133
Figure A.1. Morphological abnormalities in Bergmann glia and Purkinje neurons in Gsk-3DKO cerebella ... 134
Figure A.2: GSK-3 inhibitors decrease proliferation in cultured CGNPs ... 135
Figure A.3: Gsk-3 deletion does not induce apoptosis in medulloblastoma-prone mice... 136
Figure A.4: CHIR98 decreases cyclin D2 levels in cultured medulloblastoma cells ... 137
Figure A.5. Identification of distinct neuronal cell types in P7 WT cerebella and medulloblastoma ... 138
Figure A.6. ICA reveals a gradient of differentiation states in vehicle-treated tumors ... 139
Figure A.7. Differential expression of proliferation and differentiation markers across vehicle-treated tumor cells ... 140
Figure A.8. Vismodegib treatment produces differential responses in medulloblastoma tumor cells ... 141
Figure A.9. SHH activation persists in a subset of vismodegib-treated tumor cells ... 142
Figure A.10. HES1 and MYOD1 mark tumor cells with differential responses to vismodegib ... 143
Figure A.11. HES1 and MYOD1 are heterogeneously expressed in human medulloblastomas ... 144
xiv
LIST OF TABLES
Table 2.1. List of differentially expressed genes in Gsk-3DKO mice
as compared to M-Cre/Gskα+/- controls ... 37 Table 2.2: List of reagents and materials used in Chapter 2 with
concentrations, vendor name, and catalog number listed where applicable ... 41 Table 3.1. Cluster-specific differential expression profiles from vehicle-treated tumors ... 82 Table 3.2. Cluster-specific differential expression profiles from P7 WT cerebella ... 84 Table 3.3: The top 30 genes at the extremes of the 4 ICs from
the analysis of vehicle-treated tumors... 85 Table 3.4: The set of genes up-regulated in the Sox2+ population
compared to all other cells from vehicle-treated tumors ... 86 Table 3.5: Cluster-specific differential expression profiles from ICA
of Sox2+ cells from vehicle-treated tumors ... 88 Table 3.6: The top 50 genes at the extremes of the 4 ICs from
the analysis of vismodegib-treated and control tumors ... 89 Table 3.7: The set of genes differentially up-regulated in Cluster 0
in vehicle-treated tumors compared to all other vehicle-treated cells ... 90 Table 3.8: Set of genes up-regulated in vismodegib-treated cells
of Node AT compared to vehicle-treated cells of Node BT ... 91 Table 3.9. The set of gene expression thresholds used to generate the feature plots ... 93 Table 3.10. List of reagents and materials used in Chapter 3 with
concentrations, vendor name, and catalog number listed where applicable ... 96 Table 4.1. List of reagents and materials used in Chapter 4 with
xv
LIST OF ABBREVIATIONS
APC Adenomatous polyposis coli ANOVA Analysis of variance
cC3 cleaved Caspase-3
CDKN1A Cyclin-dependent kinase inhibitor 1A; p21 CDKN1B Cyclin-dependent kinase inhibitor 1B; p27 CGN Cerebellar granule neuron
CGNP Cerebellar granule neuron progenitor CTNNB β-Catenin
EGL External granule layer EJC Exon junction complex
FFPE Formalin fixed paraffin embedded GABA gamma-Aminobutyric acid
GLI Glioma-associated oncogene GSK-3 Glycogen synthase kinase 3 IC Independent component
ICA Independent components analysis IGL Internal granule layer
I.P. Intra-peritoneal kNN k-Nearest neighbor
LEF Lymphoid enhancer binding factor LRP Lipoprotein-receptor related protein
xvi NMD Nonsense-mediated decay
PBS Phosphate buffered saline PC Principal component
PCA Principal component analysis PCNA Proliferating cell nuclear antigen PCR Polymerase chain reaction PFA Paraformaldehyde
qRT-PCR Quantitative reverse transcription polymerase chain reaction SHH Sonic hedgehog
Smo Smoothened
SmoA1 Smoothened with activating point mutation A1 SmoM2 Smoothened with activating point mutation M2 SVZ Subventricular zone
TCF T-cell transcription factor
t-SNE t-distributed Stochastic Neighbor Embedding VZ Ventricular zone
1
CHAPTER 1: INTRODUCTION Cerebellar development depends on SHH signaling
Cerebellar development occurs postnatally, in the first two weeks of life in mice and the first year of life in humans (Carletti and Rossi, 2007; Ten Donkelaar and Lammens, 2009; Marzban et al., 2015). The cerebellum is home to multiple cell types, of which inhibitory GABA-ergic Purkinje neurons are the sole output, and excitatory glutamergic cerebellar granule neurons (CGNs) are the most numerous cell type (Morales and Hatten, 2006; White and Sillitoe, 2013). Cerebellar development is characterized by the rapid expansion of cerebellar granule neuron progenitors (CGNPs), which give rise to CGNs. The cerebellum forms from the dorsal plate of the neural tube as part of the metencephalon and comprises cells from at least two germinal zones (Goldowitz and Hamre, 1998). The ventricular zone (VZ) around the fourth ventricle gives rise to Purkinje neurons, interneurons, and glial cells, while the rhombic lip gives rise to CGNs (Morales and Hatten, 2006).
2
for CGNP proliferation, such as Gli1/2 (Dahmane and Ruiz i Altaba, 1999; Dahmane et al., 2001). CGNPs also express mouse atonal homolog (Math1; aka Atoh1), a basic-helix-loop-helix (bHLH) transcription factor necessary for cerebellar neurogenesis (Ben-Arie et al., 1997; Lumpkin et al., 2003; Wang et al., 2005; Chizhikov et al., 2006). After proliferation, CGNPs begin to migrate along radial glial (Bergmann glia) processes across the molecular and Purkinje cell layers, eventually depleting the EGL, where they then differentiate into mature granule neurons in the internal granule layer (IGL) by P15 (Martinez et al., 2013). This migratory phenotype might be regulated by the interaction of neuregulin (NRG), expressed by granule neurons, and Erb-B2 Receptor Tyrosine Kinase 4 (ERBB4), expressed by Bergmann glia (Rio et al., 1997). Cerebellar growth is largely thought to be complete by P21 in mice.
3
Molecular pathways underlying cerebellar hypoplasia are poorly understood and highly variable. Granule cells are frequently absent in cases of cerebellar hypoplasia and although Purkinje neurons are present, they show abnormal morphology such as swollen dendrites (Sarnat and Alcalá, 1980). Global deletion of Wnt1 and targeted deletion of Ctnnb in Wnt1-expressing cells both resulted in a loss of the midbrain and cerebellum (McMahon and Bradley, 1990; Thomas and Capecchi, 1990; (McMahon and Bradley, 1990; Thomas and Capecchi, 1990; Brault et al., 2001). Subsequent studies also demonstrated hypoplastic phenotypes in the cerebellum with the deletion of Ctnnb in cells expressing the neuronal stem cell marker, Nestin (Schuller and Rowitch, 2007). These early studies set the stage to define a role for WNT signaling during cerebellar development, although currently poorly understood.
Medulloblastoma is a disorder of cerebellar development
4
Survival rates drastically improved in the 1950s with Edith Paterson’s seminal work detailing craniospinal radiation as a treatment for medulloblastoma (Paterson and Farr, 1953). With radiation therapy and the eventual addition of chemotherapeutics such as vincristine, a microtubule inhibitor, overall survival rates have increased to 80%. Nevertheless, radiation and chemotherapy are aggressive treatments and commonly cause severe side effects
In the last ten years, multiple labs have made a concerted effort to characterize medulloblastoma according to molecular markers, copy number variation, and clinical features in the hopes of identifying novel therapeutic targets. By 2011, multiple researchers reached a consensus reviewed to classify medulloblastoma into four distinct molecular subgroups based on transcriptomic analysis conducted on formalin fixed paraffin embedded (FFPE) human brain tumor samples (Northcott et al., 2011; Northcott et al., 2012a). Activating mutations in developmental signaling pathways characterized the SHH and WNT subgroups coined in 2012. Two other two subgroups established at the time were named Group 3 and Group 4 for lack of distinguishable biologically significant markers.
5
and MYCN/GLI2 amplifications, while SHHβ is associated with presentation in infants, frequent metastases, and poor outcome. Survival within the SHH subgroup remains heterogeneous, with an overall survival rate of approximately 60-75% (Northcott et al., 2011; Cavalli et al., 2017; Schwalbe et al., 2017).
WNT subgroup medulloblastoma is typified by homogenous activation of the WNT signaling pathway and comprises around 10-15% of all medulloblastomas. Common genes expressed at high levels in WNT subgroup medulloblastomas include Ctnnb, Wif1, Lef1, and Axin2. Recently, WNT subgroup medulloblastomas have been further subdivided into two subgroups partly based by age of diagnosis, with WNTα frequently having monosomy 6 in young
children and WNTβ being diagnosed in adults (Cavalli et al., 2017). WNT subgroup presents with the most favorable prognosis (98% 5-year event free survival) (Northcott et al., 2011; Cavalli et al., 2017; Schwalbe et al., 2017).
6
that SHH and WNT may play opposing roles in cerebellar development and medulloblastoma according to cell of origin.
WNT signaling regulates proliferation and differentiation in diverse cell types
Although first discovered and purified in 1980 as a key enzyme in glycogen metabolism, glycogen synthase kinase-3 (GSK-3) is now recognized as an important kinase for the regulation of multiple cellular functions such as proliferation, differentiation, and apoptosis (Tejeda-Muñoz and Robles-Flores, 2015). GSK-3 is encoded by two distinct genes that produce proteins with 98% homology in the central 30 kDa kinase domain (Plyte et al., 1992). Although the GSK-3 isoforms differ in the N- and C-terminals, both GSK-3α and GSK-3β can redundantly regulate WNT
signaling in differing cell types (Force and Woodgett, 2009).
Canonically, GSK-3 functions to regulate the WNT signaling pathway by phosphorylating
the main WNT signaling effector, β-Catenin (CTNNB), to signal it for degradation. Phosphorylation of CTNNB at Ser45, Thr41, Ser37, and Ser33 by GSK-3 primes CTNNB for proteosomal degradation (Hagen and Vidal-Puig, 2002). When Wnt ligand is present, however, it interacts with Frizzled (FZD), lipoprotein-receptor related proteins (LRP), and disheveled (DVL). DVL then sequesters GSK-3 in a complex with adenomatous polyposis coli (APC) and Axin to prevent the destruction of CTNNB. CTNNB can then translocate into the nucleus and bind to transcription factors such as lymphoid enhancer binding factor 1 (LEF1) and T-cell transcription factor (TCF) to promote transcription.
7
activating a transcriptional repressor in the SHH signaling pathway, Gli3 (Yu et al., 2008). However, the role of WNT signaling in cerebellar growth is currently unclear.
Single-cell sequencing deconvolutes cellular diversity in complex tissues
Although modern neuroscience has embraced the concept of cellular diversity within the central nervous system, it was the work of Santiago Ramón y Cajal in the late nineteenth century which began to unravel the complexity of the brain. His revolutionary work carefully outlined morphologically and functionally distinct cells within the brain, establishing principles that would later be proved with technological advancements (Garcia-Lopez et al., 2010). Recently, the advent of single-cell RNA-sequencing (scRNA-Seq) has provided researchers with a new approach to better understand cellular heterogeneity in complex tissues like the brain (Macosko et al., 2015; Rosenberg et al., 2018). The ability to generate transcriptomic profiles from individual cells has shed some light on tissue complexity, brain development, and tumor heterogeneity (Puram et al., 2017; Saunders et al., 2018; Loo et al., 2019; Vladoiu et al., 2019).
8
While scRNA-seq experiments have largely been exploratory in nature, scRNA-seq can be used for more targeted experiments. Transgenic mice have provided researchers with a powerful tool to study the effects of a single oncogenic stressor in vivo. Coupling scRNA-seq with mouse tumor models allows for more flexibility. For example, it is now possible to study how a single targeted therapy can provoke heterogenous responses in tumor cells in a mouse model. These studies may provide new insights into cellular diversity, potential cell of origin, and mechanisms of resistance within tumors.
Microcephaly genes may provide new targets for medulloblastoma treatment
Understanding the mechanisms underlying cellular growth during normal brain development may provide new therapeutic targets for neurodevelopmental diseases caused by dysregulation of neural progenitor amplification. In the cerebellum, neurogenesis mostly occurs postnatally, in which CGNPs proliferate rapidly to give rise to CGNs. We have previously shown that loss of function mutations in genes such as Aspm, which have been associated with autosomal recessive microcephaly (Naveed et al., 2018; Okamoto et al., 2018), are required for cerebellar growth (Williams et al., 2015). Cancers like medulloblastoma retain some molecular and genetic properties of their cells of origin (Dirks, 2008; Dirks et al., 2014; Vladoiu et al., 2019). Therefore, microcephaly-related genes like Aspm and Atr may also be necessary for growth in tumors such as medulloblastomas (Williams et al., 2015; Lang et al., 2016; Lang and Gershon, 2018).
9
al., 2016). Therefore, regulation of mRNA by the EJC may be necessary to promote cell cycle progression and cell specification during normal development (Inaki et al., 2011; Silver et al., 2013; Fukumura et al., 2016; Pilaz et al., 2016; Baralle and Giudice, 2017).
10
CHAPTER 2:
GSK-3 IS NECESSARY TO SUPPRESS WNT/CDKN1A SIGNALING DURING
CEREBELLAR DEVELOPMENT AND MEDULLOBLASTOMA GROWTH1
Introduction
Proliferation must be precisely controlled during brain development. Insufficient proliferation causes microcephaly while excessive proliferation causes tumorigenesis (Ten Donkelaar and Lammens, 2009; Bosemani and Poretti, 2016; Lerman-Sagie et al., 2018; Haldipur and Millen, 2019). Cerebellar neurogenesis occurs in the first two weeks of postnatal life in mice and the first year of life in humans (Ten Donkelaar and Lammens, 2009; Marzban et al., 2015). During this proliferative period, CGNPs in the external granule layer of the cerebellum proliferate rapidly in response to SHH secreted by nearby Purkinje neurons to give rise to the largest population of neurons in the central nervous system (Wechsler-Reya and Scott, 1999). SHH has long been known as the main driver of CGNP proliferation during early postnatal development. Moreover, increased cerebellar proliferation can lead to medulloblastoma, the most common malignant pediatric brain tumor (Dahmane et al., 2001; Yang et al., 2009; Dey et al., 2012). Transcriptomic analysis of patient-derived medulloblastomas have identified four main molecular subgroups (Northcott et al., 2011). SHH activation and WNT activation recapitulate medulloblastomas from distinctly different pre-malignant cells that derive from different regions of the rhombic lip (Schüller et al., 2008; Gibson et al., 2010; Vladoiu et al., 2019).
1 The work described in this chapter has been published at Development:
11
Studies performed in the last ten years have implicated WNT signaling as a potential negative regulator of cerebellar growth (Schuller and Rowitch, 2007; Lorenz et al., 2011; Moreno et al., 2014). WNT signaling is a known driver of proliferation in multiple cell types, such as intestinal stem cells (Harada et al., 1999; Giles et al., 2003) and progenitors in the CNS (Spittaels et al., 2002; Kim et al., 2009; Morgan-Smith et al., 2014). Notably, a series of studies have identified GSK-3 as a necessary brake on proliferation in forebrain progenitors. Uncommitted neural progenitors express Nestin throughout the brain during prenatal development and in select postnatal neurogenic regions (Mignone et al., 2004; Bernal and Arranz, 2018). Deletion of both isoforms of Gsk-3 in Nestin+ progenitors led to a massive increase in Sox2+ stem cells, a folded neocortex, and a decrease in both intermediate and fully differentiated neurons. This increase in proliferative early progenitors was linked to an increase in WNT signaling, as demonstrated by increased CTNNB and Axin2. Interestingly, the authors also demonstrated an increase in SHH signaling markers after genetic deletion of Gsk-3, including an increase in the transcription factors Gli1 and Gli2 and the SHH receptor, Patched (Ptch). Deletion of Gsk-3 also led to an increase in c-Myc, which is commonly activated in various cancer types (Kim et al., 2009; Morgan-Smith et al., 2014).
12
postnatal development (Selvadurai and Mason, 2011). Deletion of the CTNNB destruction complex member, APC, in committed Math1+ cerebellar progenitors resulted in a mild hypoplastic phenotype in the cerebellum. APC-deleted cerebella lacked CGNs in the rostral regions of the cerebellum and demonstrated ectopic expression of CGNs in the molecular layer of the cerebellum (Lorenz et al., 2011). Constitutive activation of CTNNB in Math1+ cells also resulted in a hypoplastic cerebellum, with a significantly smaller cerebellar area, fewer CGNPs during proliferation, and fewer CGNs. Understanding the role of WNT signaling during SHH-driven cerebellar growth may lead to better understanding of cerebellar development and new targeted therapies for medulloblastomas.
13
Results
Gsk-3DKO mice exhibit severe cerebellar hypoplasia
To explore the function of GSK-3 in CGNPs, we targeted deletion of both isoforms of Gsk-3 to MATH1+ CGNPs by breeding Gsk-3α-/- and Math1-Cre/Gsk-3βloxP/loxP mice. CGNPs are the predominant cell type expressing MATH1 in the cerebellum. Math1-Cre induces recombination at loxP sites in CGNPs from E12.5 from the anterior to posterior regions of the cerebellar cortex in a rostro-caudal progression (Machold and Fishell, 2005; Wang et al., 2005). Mice with either Gsk-3α (Gsk-3α-/-) or Gsk-3β (Math1-Cre/Gsk-3βloxP/loxP) deleted exhibited no phenotypic changes. However, breeding these genotypes to generate Math1-Cre/Gsk-3α-/-/Gsk-3βloxP/loxP (Gsk-3DKO) produced mice with severe cerebellar growth failure (Fig. 2.1A, P21), demonstrating that GSK-3 is required for normal cerebellar growth and that either isoform of Gsk-3, Gsk-3α or Gsk-3β is sufficient to maintain growth.
Gsk-3DKO mice were born with the expected Mendelian frequency and were viable neonatally. However, by P12, mice exhibited severe tremors, were unable to be weaned by P20-22 and did not survive beyond P25. At birth, Gsk-3DKO mice exhibited normal cerebellar architecture, with a clearly defined external granule layer populated by CGNPs (Fig. 2.1A, P0). By P3, Gsk-3DKO cerebella lacked foliation and the EGL was markedly thinned, indicating a lack of progenitor expansion between P1-3 (Fig. 2.1A, P2-3). Additionally, the internal granule layer (IGL) where the differentiated progeny of CGNPs, cerebellar granule neurons (CGNs), reside was markedly reduced by P7 (Fig. 2.1A, P7). These findings demonstrate the failure of Gsk-3DKO CGNPs to generate an appropriately large population of neurons.
14
deleted or Gsk-3α/β intact with cleaved Caspase-3 (cC3) as a marker for apoptotic cell death. We have previously found that deletion of the DNA repair gene, Atr (Math1-Cre/AtrloxP/loxP; AtrcKO), induces extensive cC3-mediated cell death in CGNPs (Lang et al., 2016), which we used as a positive control for cC3 detection. We did not detect an increase in cC3+ cells in Gsk-3DKO mice at P2, before the onset of hypoplasia, or at P3 (Fig. 2.1B, C). To determine if CGNPs or CGNs were undergoing Caspase-independent death, we also performed Terminal deoxynucleotidyl transferase dUTP Nick End Labeling (TUNEL) staining at each time point and found no indication of increased cell death in Gsk-3DKO cerebella (data not shown).
We next examined whether Gsk-3 deletion altered proliferation. While we found no changes in apoptosis as labeled by cC3, we found decreased proliferation and a trend toward increased differentiation in P2 and P3 Gsk-3DKO cerebella as labeled by PCNA and CDKN1B (p27) respectively (Fig. 2.1D, E). This pattern of staining indicated an increase in cell cycle exit. Staining for the cell cycle progression marker phosphorylated RB (p-RB) demonstrated marked decreased in p-RB-expressing CGNPs in Gsk-3DKO mice at P2 and P3, supporting the possibility of increased cell cycle exit (Fig. 2.1F, G).
15
confirming reduced CGNP proliferation at P2 and P3 (Fig. 2.2A, B). Moreover, the cell cycle exit fraction was significantly increased in Gsk-3DKO CGNPs (Fig. 2.2C), indicating that the CGNP that were proliferating in these mice showed reduced self-renewal relative to CGNPs in control littermates.
Molecular signatures of Gsk-3 deletion include WNT and CDKN1A signaling
To identify the transcriptomic changes induced by Gsk-3α/β deletion, we performed expression microarray analysis. We compared whole cerebella dissected from Gsk-3DKO and control littermates at P2, before the onset of severe hypoplasia in Gsk-3DKO mice. We compared Gsk-3DKO cerebella to cerebella from Math1-Cre/Gsk-3α+/-/Gsk-3βloxP/loxP mice, which retain a single Gsk-3α allele but have no Gsk-3β alleles in CGNPs, and No Cre/Gsk-3α+/-/Gsk-3βloxP/+ mice, which retain a single Gsk-3α allele and retain two Gsk-3β alleles in CGNPs. We identified 68 genes that were differentially expressed in Gsk-3DKO cerebella, with 14 genes significantly down-regulated and 54 genes significantly up-down-regulated as determined by a fold change > |2| and an FDR p-value < 0.05 (Fig. 2.3A; Table 2.1). In the genes that were down-regulated, we identified Gsk-3, consistent with genetic disruption, as well as neuronal markers, ChrnaGsk-3, Chrnb4, and Cadps2, consistent with the decreased neuronal population in Gsk-3DKO mice.
16
EGL, morphology, and expression of FABP7 (Fig. A.1). In Gsk-3DKO cerebella, however, labeled The
cellular distributions of LEF1, CDKN1A and TCF7 show that disrupting GSK-3 in CGNPs caused both cell autonomous and non-cell autonomous WNT activation, and cell autonomous, CGNP-specific induction of CDKN1A. To resolve the roles of WNT activation, p53, and CDKN1A in the pathogenesis of the Gsk-3DKO phenotype, we performed a series of co-deletion experiments. CTNNB activation drives hypoplasia in Gsk-3 deleted cerebella
GSK-3 negatively regulates the WNT signaling pathway by phosphorylating CTNNB to signal proteasomal degradation (Hagen and Vidal-Puig, 2002). To determine if CTNNB is required for cerebellar growth, we conditionally deleted Ctnnb in Math1+ CGNPs by crossing breeding Math1-Cre and CtnnbloxP/loxP mice to produce Math1-Cre/CtnnbloxP/loxP (CtnnbcKO) mice. CtnnbcKO mice were born at the expected Mendelian frequency, were viable, and exhibited no phenotypic changes as compared to control littermates with only one copy of Ctnnb deleted. However, at the peak of cerebellar proliferation at P7, CtnnbcKO cerebella exhibited foci of hyperproliferation, marked by increased EGL thickness. CGNPs in the thickened regions of EGL were PCNA+ and p-RB+ (Fig. 2.4A). This hyperproliferation did not lead to tumor formation, and by P15, all CGNPs in CtnnbcKO mice had exited the cell cycle and migrated to the IGL, as in Ctnnb-intact controls (Fig. 2.4A, P15). These findings are consistent with a physiologic role for CTNNB in CGNPs that can be compensated by additional, redundant mechanisms that limit CGNP proliferation.
17
than Gsk-3DKO mice (Fig. 2.4B). Gsk-3/CtnnbTKO mice also experienced significantly less falls over a 120 second span as compared to Gsk-3DKO mice (Fig. 2.4C). Consistent with the improved phenotype, Gsk-3/CtnnbTKO cerebella exhibited a defined foliated, EGL at P3 that persisted through the peak of proliferation at P7 (Fig. 2.4D, P3, P7). Gsk-3/CtnnbTKO CGNPs were PCNA+ and p-RB+ at P7, indicating a rescue of the proliferation deficit observed in Gsk-3DKO mice (Fig. 2.4E). The percent of p-RB+ cells quantified in the Gsk-3/CtnnbTKO mice was not significantly different from age-matched controls (Fig. 2.4F).
Although proliferation was rescued with Ctnnb co-deletion, migration was not rescued. We observed ectopic regions of CGNs and overall disrupted cerebellar organization in adult Gsk-3/CtnnbTKO mice, indicating a deficit in CGNP migration across the Purkinje cell layer into the IGL (Fig.2.4D, adult). Migration defects in Gsk-3/CtnnbTKO were present by P7, as demonstrated by increased thickness in the EGL and a thinned IGL, despite the presence of other cell types such as Purkinje neurons and Bergmann glia, as labeled by Calbindin and FABP7 staining respectively (Fig. 2.4F). Although both Purkinje neurons and Bergmann glia showed some morphological abnormalities, such as smaller dendritic arbors in Purkinje neurons and more sparse Bergmann glial processes, they were largely intact in Gsk-3/CtnnbTKO cerebella and appeared more organized than in Gsk-3DKO cerebella (Fig. A.1). These findings indicate a cell-autonomous deficit in migration induced by Gsk-3 deletion that was unable to be rescued by Ctnnb co-deletion.
Trp53 or Cdkn1a co-deletion are unable to rescue hypoplasia induced by loss of Gsk-3
18
the genotype Math1-Cre/Gsk-3α-/-/Gsk-3βloxP/loxP/Trp53loxP/loxP (Gsk-3/p53TKO) (Marino et al., 2000). Gsk-3/p53TKO mice exhibited severe cerebellar hypoplasia similar to Gsk-3DKO mice and did not survive beyond P20-22. Gsk-3/p53TKO, like Gsk-3DKO mice, did not show apoptotic rates as labeled by cC3 staining, but demonstrated decreased PCNA+ and p-RB+ and increased CDKN1B+ and CDKN1A+ CGNPs throughout the EGL (Fig. 2.5A). These studies demonstrate that p53-mediated transcription is not required for the induction of CDKN1A, nor for the premature cell cycle exit and growth failure in Gsk-3DKO CGNPs.
To determine if CDKN1A mediates the growth failure in Gsk-3DKO mice, we next co-deleted Cdkn1a and Gsk-3α/β. Global Cdkn1a deletion in mice produces no phenotypic changes during development but progenitors exhibit impaired G1 checkpoint control (Deng et al., 1995). Therefore, we bred Cdkn1a-/- and Gsk-3DKO mouse lines to generate Math1-Cre/Gsk-3α-/- /Gsk-3βloxP/loxP/Cdkn1a-/- (Gsk-3/Cdkn1aTKO) mice. Similar to Gsk-3/p53TKO mice, Gsk-3/Cdkn1aTKO exhibited severe cerebellar hypoplasia (Fig. 2.5B) with ataxia and early mortality similar to Gsk-3DKO mice. Gsk-3/Cdkn1aTKO mice showed no significant differences in PCNA or p-RB as compared to Gsk-3DKO mice.
19
Pharmacological inhibition of GSK-3 blocks CGNP proliferation
To determine if a physiological reduction in SHH-driven proliferation could be achieved by pharmacologically reducing 3 activity in CGNPs, we pharmacologically inhibited GSK-3 in cultured CGNPs. We cultured freshly dissociated CGNPs from wild-type mice for 24 hours in media with or without SHH, or with SHH plus increasing doses of the GSK-3 inhibitor, CHIR-98014 (CHIR98). After culturing CGNPs for 24 hours, we lysed cells and quantified phosphorylated CTNNB (p-CTNNB) as a measure of GSK-3 inhibition and p-RB as a measure of proliferation using western blot (Fig. 2.6A). We found that increasing doses of CHIR98 were able to suppress proliferation even in the presence of the mitogenic signal, SHH, as demonstrated by decreased p-RB and an increased CDKN1A in cultured CGNPs (Fig. 2.6B). CHIR98 was also able to decrease p-CTNNB expression at every dose as compared to the SHH control, demonstrating a physiologic role for CTNNB phosphorylation in CGNPs.
In a parallel experiment, CGNPs were treated with EdU 1 hour before fixing with 4% paraformaledyde for immunofluorescence analysis. GSK-3 inhibition with 1 µM CHIR98 decreased p-RB, EdU incorporation, and expression of the mitotic marker, phosphorylated Histone H3 (p-HH3) (Fig. 2.6C, D), demonstrating fewer cells in S-phase and M-phase. Treatment of CGNPs with the GSK-3 inhibitors LY2090314 (LY209), AZD1080, or LiCl did not decrease p-RB or p-HH3 levels or reduce EdU incorporation as effectively as CHIR98 at similar concentrations (Fig. A.2). These results show that modulation of SHH-driven proliferation by GSK-3 is seen outside of the context of genetic deletion and can be achieved within the dynamic range of physiological GSK-3 activity.
Deletion of Gsk-3 in medulloblastoma-prone mice blocks tumor growth
20
the constitutively active SHH receptor, Smoothened (SmoM2) targeted to Math1+ CGNPs (Math1-Cre/SmoM2loxP/+; M-Smo)develop medulloblastoma with 100% frequency by P12 (Schüller et al., 2008). We crossed Math1-Cre, Gsk-3DKO and SmoM2mouse lines mice to generate the genotype Math1-Cre/Gsk-3α-/-/Gsk-3βloxP/loxP/SmoM2loxP/+ (M-Smo/Gsk-3DKO). Although M-Smo/Gsk-3DKO mice could not survive beyond weaning at P20-22, like the Gsk-3DKO mice, we were able to analyze tumor growth during cerebellar development. We compared M-Smo, M-Smo/Gsk-3DKO cerebella to littermate controls with the genotypes Math1-Cre/Gsk-3α-/-/Gsk-3βloxP/+/SmoM2loxP/+ (M-Smo/Gsk-3α KOβHET) or Math1-Cre/Gsk-3α-/+/Gsk-3βloxP/loxP/SmoM2loxP/+ (M-Smo/Gsk-3α HETβKO).
Pathological analysis of brain sections showed that tumor growth in M-Smo/Gsk-3DKO mice was markedly reduced as compared to tumor mice with one allele of Gsk-3 intact (M-Smo/Gsk-3α KOβHET or M-Smo/Gsk-3α HETβKO) (Fig. 2.7A). Primary tumor area normalized to total cerebellar area was significantly decreased in Gsk-3-deleted tumors when compared to Gsk-3-intact tumors (Fig. 2.7B). PCNA staining at P12 and P15 demonstrated small foci of proliferating cells in the otherwise hypoplastic M-Smo/Gsk-3DKO cerebella (Fig. 2.7C). Co-staining with CDKN1B demonstrated pockets of differentiating cells in Gsk-3DKO tumors that were absent in Gsk-3-intact tumors (Fig. 2.7C).
21
deletion blocked tumor growth by restricting cell cycle progression, rather than by increasing cell death. We also noted induction of CDKN1A in M-Smo/Gsk-3DKO tumors, indicating that the GSK-3/CTNNB/CDKN1A axis that we noted in CGNPs remains intact in SHH-driven medulloblastoma.
Pharmacological inhibition of Gsk-3 blocks tumor growth in vitro
The growth restriction in tumors deficient for Gsk-3 indicated a potential physiologic role for GSK-3 in SHH-driven tumors. To determine if pharmacological inhibition could exert a similarly growth suppressive effect, we used an in vitro culture assay to examine the function of GSK-3 in promoting medulloblastoma growth. Briefly, we harvested primary M-Smo tumors from P15 mice, dissociated the tumor cells and plated them in serum-free media. We then cultured the dissociated tumors with or without GSK-3 inhibitor CHIR98. After 24 hours, we collected cells for western blot or flow cytometry. Given the intrinsic increase in SHH signaling in M-Smo tumors, we cultured tumor cells in the absence of SHH. The presence of exogenous SHH in cultured M-Smo tumor cells did not produce a discernable effect in tumor cell growth.
22
Discussion
In this study, we explored the function of GSK-3 in cerebellar development and medulloblastoma growth through genetic, molecular, and pharmacological studies. We showed that GSK-3 is required to promote SHH-driven proliferation in the developing cerebellum and in medulloblastoma. Conditional deletion of both isoforms of Gsk-3 during cerebellar development was sufficient to block cerebellar growth by inhibiting cell cycle progression and promoting cell cycle exit, without inducing cell death. Pharmacologic inhibition of GSK-3 produced similar growth suppression. Our transcriptomic and molecular studies identified WNT and CDKN1A activation as a consequence of Gsk-3 loss. Co-deletion experiments demonstrated that up-regulation of CDKN1A was independent of p53-mediated transcription and that CDKN1A was not required for the Gsk-3DKO phenotype. Rescue studies with co-deletion of Ctnnb demonstrate that growth suppression and abnormal migration are aspects of the Gsk-3DKO phenotype that can be dissociated, as Ctnnb co-deletion in Gsk-3/CtnnbTKO mice allowed Gsk-3-deleted CGNPs to proliferate but not to migrate normally.
Previous studies have presented growth-promoting and growth-suppressive effects of GSK-3-mediated WNT signaling in both CGNPs (Knoepfler and Kenney, 2006; Penas et al., 2015) and in other cell types in the brain (Kim et al., 2009; Morgan-Smith et al., 2014). In CGNPs, the negative regulation of MYCN by GSK-3 suggested a growth suppressive effect (Knoepfler and Kenney, 2006), while the destabilization of WEE1 by GSK-3 suggested a role in promoting cell cycle progression (Penas et al., 2015). Our Gsk-3DKO studies make clear that GSK-3 is required for proliferation, and our Gsk-3/CtnnbTKO studies show that the regulation of the WNT pathway by GSK-3 is sufficient to mediate this effect.
23
et al., 2014) and the gut (Harada et al., 1999; Giles et al., 2003). The contrasting response to WNT signaling we observe in CGNPs may be due to their specific reliance of SHH signaling. In the developing neural tube and in colon cancer cells WNT signaling induces the repressive SHH transcription factor, GLI3 (Alvarez-Medina et al., 2008; Song et al., 2015). In contrast, WNT activation in epidermal cells and cortical progenitors induces GLI1, which activates SHH-dependent transcription (Kim et al., 2009; Wang et al., 2018). Our finding that WNT signaling opposes SHH-driven proliferation is consistent with an antagonistic interaction between these developmental signaling pathways.
Our findings build on previous studies in which constitutive WNT signaling, induced by a mutant allele of Ctnnb, impaired cerebellar and medulloblastoma growth (Pöschl et al., 2013). We demonstrate a physiologic necessity for WNT during normal cerebellar growth by activating WNT signaling through a loss of function mutation, rather than engineering a gain of function. Deletion of Ctnnb induced hyperproliferation in CGNPs, further supporting the idea that GSK-3/WNT signaling is necessary for the normal regulation of cerebellar development. Importantly, GSK-3 is a kinase that can be manipulated by small molecule inhibitors. Our data suggest a potential deleterious impact of exposure to GSK-3 inhibitors during cerebellar development, as well as the potential of GSK-3 inhibitors to advance the treatment of SHH-driven tumors.
24
medulloblastomas are unknown and GSK-3 inhibition in WNT subgroup tumors might be expected to increase proliferation. Within the SHH subgroup however, WNT activation through GSK-3 inhibition may provide a new, targeted approach to therapy.
Methods
A detailed list of all reagents and materials used can be found in Table 2.2.
Mouse models
All animal handling and protocols were carried out in accordance with established NIH practices established by the Guide for the Care and Use of Laboratory Animals and approved under the University of North Carolina (UNC) Institutional Animal Care and Use Committee. All mice were maintained on a 12 hr:12 hr. light:dark cycle and given food and water ad libitum. Adult mice were group housed with 2 to 5 mice per cage.
Gsk-3α-/- and Gsk-3βloxP/loxP mice were generously shared by Dr. William Snider. Gsk-3α -/-harboring an exon 2 deletion and Gsk-3βloxP/loxP mice with exon 2 flanked by loxP sites have been previously described (MacAulay et al., 2007; Patel et al., 2008). Gsk-3α-/- and Gsk-3βloxP/loxP mice were bred with the Math1-Cre mouse line (Matei et al., 2005), generously shared by Dr. David Rowitch and Dr. Robert Wechsler-Reya, to produce Gsk-3DKO mice (Math1-Cre/Gsk-3α-/- /Gsk-3βloxP/loxP). Littermate Math1-Cre/Gsk-3α+/-/Gsk-3βloxP/loxP and Math1-Cre/Gsk-3α-/-/Gsk-3βloxP/wt (M-Cre/Gsk-3) mice were used as controls.
25
2000) and crossed with Math1-Cre/Gsk-3α+/-/Gsk-3βloxP/loxP mice to generate Math1-Cre/Gsk-3α +/-/Gsk-3βloxP/loxP/trp53loxP/loxP (Gsk-3/p53TKO) mice. Littermates heterozygous for Gsk-3 or p53 were used as controls. Cdkn1a-/- mice were purchased from Jackson Laboratories (Deng et al., 1995). These mice were bred with Math1-Cre/Gsk-3α+/-/Gsk-3βloxP/loxP to generate Math1-Cre/Gsk-3α -/-/Gsk-3βloxP/loxP/Cdkn1a-/- (Gsk-3/Cdkn1aTKO) progeny. Littermates heterozygous for Gsk-3 or Cdkn1a were used as controls.
Math1-Cre/Gsk-3α+/-/Gsk-3βloxP/loxP were crossed with SmoM2loxP/loxP mice purchased from Jackson Laboratories (Mao et al., 2006) to produce Math1-Cre/Gsk-3α+/-/Gsk-3βloxP/loxP/ SmoM2loxP/wt (M-Smo/Gsk-3αHET/Gsk-3βKO), Math1-Cre/Gsk-3α-/-/Gsk-3βloxP/wt/SmoM2loxP/wt (M-Smo/Gsk-3αKO/Gsk-3βHET), and Math1-Cre/Gsk-3α-/-/Gsk-3βloxP/loxP/SmoM2loxP/wt (M-Smo/Gsk-3DKO) mice. SmoM2loxP/loxP mice were also crossed with Cre mice to produce Math1-Cre/SmoM2 (M-Smo) progeny. All mice were maintained on a C57BL/6 background.
Cell culture
CGNPs were isolated by size selection and explanted as previously described (Kenney et al., 2003; Lang et al., 2016). Briefly, cerebella were dissected from P5 pups, dissociated with papain using the Papain Dissociation System (Worthington Biochemical Corporation) and selected on a density gradient of ovomucoid inhibitor, then allowed to adhere to coated culture wells at 37oC with 5% CO2 in DMEM/F12 with 25 mmol/L KCl, supplemented with heat inactivated FBS (HI-FBS) and N2. After 4 hours, media was replaced with identical serum-free media. Cells were maintained in 0.5 mg/mL SHH (#464SH, R&D Systems) or vehicle (0.1% BSA in 1x PBS).
26
after a 1 hour exposure to 20 µmol/L EdU. EdU was visualized using the Click-iTTM EdU Alexa Fluor Imaging Kits (#C10337, ThermoFisher Scientific) according to manufacturer’s protocol. Cell counts were performed using Olympus CellSens software. Tumor cultures from medulloblastomas freshly harvested from Math1-Cre/SmoM2 mice were prepared according to the CGNP culture protocol above, with SHH supplementation omitted.
Immunostaining cerebellar sections and quantification
Mouse brains were processed and immunostained as previously described (Crowther et al., 2016; Lang et al., 2016) using antibodies listed in Table 2.2. EdU was visualized using the Click-iTTM EdU Alexa Fluor Imaging Kits (ThermoFisher Scientific, #C10337) according to manufacturer’s protocol. Immunostained sections were counterstained with 200 ng/mL 4’6-diami-dino-2-phenylindole (DAPI/ #D1306, Thermo Fisher Scientific) in 1x PBS for 20 minutes. Stained slides were digitally acquired using an Aperio ScanScope XT (Aperio).
To quantify proliferating cell nuclear antigen (PCNA), CDKN1B/p27, phosphorylated Retinoblastoma (p-RB), CDKN1A/p21, cleaved Caspase-3, BrdU or EdU-positive cells, the EGL region was manually annotated on each section, which was then subjected to automated cell counting using Tissue Studio (Definiens) for fluorescent slides. Quantification of cultured cells was performed by randomly imaging 3 sections of each well and performing cell counts with binary images using the particle analyzer in ImageJ/Fiji. P values were determined by two-tailed Student’s t-tests with R version 3.6.0.
Cell cycle exit analysis
27
(#A10044, Life Technologies; 40 mg/kg in 25 µl of HBSS) and dissected 2 hours later. Brains were fixed in 4% PFA in 1X PBS for 48 hours at 4oC before being processed for histology.
Differential expression analysis
RNA was purified from whole P2 cerebella according to manufacturer’s protocol (RNeasy Mini Kit, #74104, QIAGEN). RNA quality and quantity were assessed by spectrophotometry and capillary gel electrophoresis. We quantified transcripts using the Affymetrix Mouse Gene 2.1 ST 24-Arrays. Differential gene expression analysis was performed by 2-way ANOVA, using the Partek Genomics Suite standard workflow for expression analysis.
Pathway analysis
Gene sets collected from microarray analysis were subjected to Gene Set Enrichment Analysis (GSEA) using freely available software from the Broad Institute (Mootha et al., 2003; Subramaniana et al., 2005). The Molecular Signatures Database (MSigDB) were used to provide annotated gene sets for comparative analysis and p-values were estimated by 1000 permutations.
Western blot analysis
28
Flow cytometry analysis
29
Figures
Figure 2.1. Gsk-3 deletion in CGNPs causes cerebellar hypoplasia early in development without inducing apoptosis. (A) Representative H&E-stained sagittal cerebellar sections of Gsk-3DKO cerebella
compared to Gsk-3 intact littermate controls. Black arrowheads identify the EGL. Red arrows identify the IGL. (B) Representative sagittal cerebellar sections of Gsk-3DKO mice and Gsk-3 intact controls stained for
cleaved Caspase-3 (cC3). AtrcKO cerebella were used as positive controls for apoptosis. Black arrowheads
highlight positive cells. (C) Quantification of cC3+ cells in the EGL at P2 and P3 performed using replicates
of the genotypes presented in 2.1B (n=6 per genotype at P2; n=5 per genotype at P3). (D) Immunostaining for PCNA and CDKN1B in Gsk-3 deleted and littermate control cerebella at P2 and P3. (E) Quantification of the PCNA+ and CDKN1A+ cells in the EGL at P2 or P3 using replicates of the genotypes presented in
1D (n=3 per genotype). (F) Immunostaining for phosphorylated RB (p-RB) in Gsk-3DKO and littermate
control cerebella. (G) Quantification of the p-RB+ cells in the EGL using replicates of the genotypes
30
Figure 2.2. GSK-3 is required for CGNP proliferation and cell cycle progression. (A) Representative Gsk-3 intact and Gsk-3DKO cerebella pulse-labeled by BrdU and EdU at the indicated age. (B) Quantification
of EdU+ cells in the EGL of Gsk-3DKO or littermate control cerebella from replicate mice as in 2A (P2
control: n=8; P2 Gsk-3DKO: n=4; P3 control: n=5; P3 Gsk-3DKO: n=7). (C) Quantification of cell cycle exit
fraction as determined by the proportion of BrdU cells not co-expressing EdU divided by the total BrdU+
population in Gsk-3-deleted CGNPs as compared to littermate controls from replicate mice as in 2A and
31
Figure 2.3. GSK-3 inhibition blocks proliferation in vitro. (A) Representative western blot images show p-RB, p-CTNNB, and CDKN1A protein levels in response to increasing concentrations of the GSK-3 inhibitor CHIR98. (B) Quantification of western blot data as in 3A, with luminescence normalized to actin and expressed as fold change relative to SHH control (n=3 per condition). Statistical significance denoted by *p<0.05, **p<0.01, ***p<0.001 as determined by ANOVA with Tukey HSD post-hoc test. (C)
Representative DAPI-stained and immunofluorescence images of cultured CGNPs treated as indicated and pulse-labeled with EdU 1 hour before fixation. Cells were stained for p-RB, EdU, and p-HH3. (D)
32
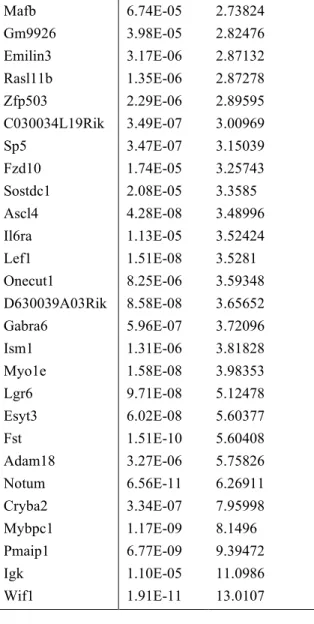
Figure 2.4. Transcriptional analysis reveals upregulation of WNT/CDKN1A signaling in Gsk-3DKO mice. (A) Volcano plot of log2(FC) vs. -log10(p-value) with color threshold (green dots) set at |log2(FC)| >
2 and FDR < 0.05 (lines). Significant genes are labeled and outlined in black dashed circles. Legend indicating dot color-coding in the bottom right corner (n=5 per genotype). (B) Dot plots show representative genes that were upregulated in Gsk-3 mutants, including WNT markers Lef1 and Tcf7, and Cdkn1a, as compared to M-Cre/Gsk-3α+/- and No-Cre/Gsk-3 controls. (C) GSEA analysis demonstrates upregulation
of WNT and p53 signaling pathways in Gsk-3 deleted cerebella as compared to M-Cre/Gsk-3α+/- controls.
(D) Immunostaining of select gene markers TCF7, LEF1, and CDKN1A identified from the microarray in Gsk-3DKO mice and littermate controls. The regions of the higher magnification images are outlined by
33
Figure 2.5. CTNNB modulates CGNP proliferation downstream of GSK-3. (A) Comparison of CtnnbcKO mice and littermate controls, in representative cerebellar sections stained with H&E at P7 and
P15, and for PCNA/CDKN1B and p-RB at P7. (B) Survival curve demonstrating cumulative survival of Gsk-3/CtnnbTKO mice as compared to Gsk-3DKO mice (n=6 per genotype). Statistical significance is denoted
by *p<0.05, **p<0.01, ***p<0.001 as determined by the Kaplan-Meier method and log rank test. (C)
Comparison of Gsk-3DKO and Gsk-3/CtnnbTKO mice by number of falls per 120s (n=3 per genotype). (D)
Comparison of Gsk-3DKO and Gsk-3/CtnnbTKO cerebella, in representative H&E stained slides at the
indicated ages. (E) Comparison of Gsk-3DKO and Gsk-3/CtnnbTKO in PCNA/CDKN1B, p-RB, or CDKN1A
stained cerebellar sections. (F) Quantification of p-RB+ cells in the EGL of Gsk-3/CtnnbTKO mice (n=4) and
Gsk-3-intact littermate controls (n=3), from replicate mice as in 5E. (G) Comparison of Gsk-3/CtnnbTKO
34
Figure 2.6. Reduced proliferation in Gsk-3-mutants is independent of p53 and CDKN1A. (A)
Comparison of control, Gsk-3DKO and Gsk-3/p53TKO cerebella, in representative H&E, PCNA/CDKN1B,
p-RB, and CDKN1A stained cerebellar sections (B) Comparison of control and Gsk-3/Cdkn1aTKO cerebella
in representative H&E, CDKN1A, or p-RB-stained sections. The regions of the higher magnification images are outlined by rectangles on the low magnification images. Scale bars measure 500 μm for low magnification images and 50 μm for higher magnification images in (A) or 700 μm for low magnification images and 50 μm for higher magnification images in (B).
35
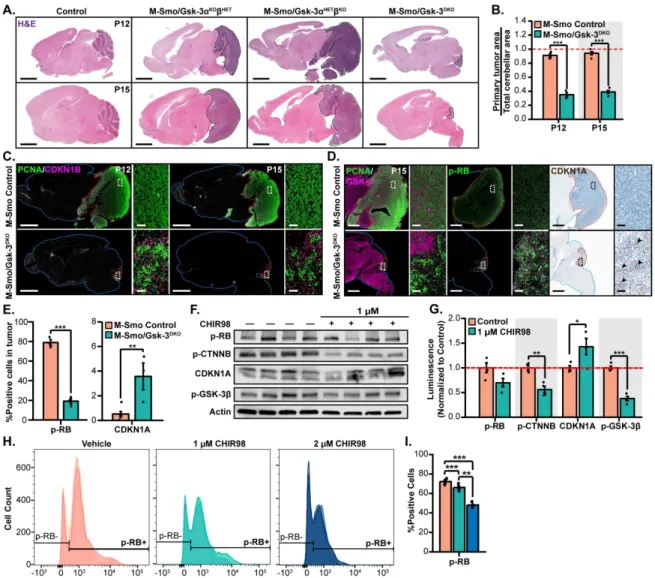
Figure 2.7. GSK-3 is required for Shh-driven medulloblastoma tumor growth. (A) Comparison of cerebellar regions in M-Smo/Gsk-3DKO mice and Gsk-3 intact Smo-mutant in representative H&E-stained
cerebellar sections at P12 and. Primary tumor area outlined with a black dashed line. (B) Comparison of tumor area in Gsk-3-deleted and control tumors, using replicates of the genotypes in 7A, normalized to total cerebellar area at P12 (n=4 for P12 control; n=3 per genotype) (C) Comparison of PCNA and CDKN1B immunostaining in Gsk-3-deleted and control tumors, using replicates of the genotypes in 7A. (D)
Comparison of PCNA, GSK-3 and CDKN1B immunostaining in Gsk-3-deleted and control tumors, using replicates of the genotypes in 7A. (E) Quantification of p-RB+ and CDKN1A+ cells comparing
Gsk-3-deleted and control tumors (P12 control: n=4; P12 Gsk-3DKO: n=3; P15 control: n=5; P15 Gsk-3DKO: n=3).
(F) Representative western blot images of p-RB, p-CTNNB, CDKN1A, p-GSK-3β, and actin protein levels in cultured M-Smo tumor cells treated with or without 1 μM of the GSK-3 inhibitor CHIR-98014. (G)
Quantification of western blot data from replicates as in 7F, normalized to actin and expressed as fold change relative to control tumor cells (n=4 per condition). (H) Histograms of p-RB+ and p-RB- tumor cells
treated in vitro with vehicle, 1 μM, or 2 μM of CHIR98. (I) Quantification of p-RB+ cells in biological
36
Tables
Gene FDR Fold Change
Chrnb4 4.62E-07 -3.56487
Mfap4 5.34E-08 -2.77489
Chrna3 4.04E-07 -2.54283
Gsk3a 2.76E-10 -2.53513
Rnf148 9.31E-06 -2.39022
Nhlh1 1.64E-06 -2.27388
Cadps2 1.25E-06 -2.21815
Pisd-ps3 0.026387 -2.15748 A930017K11Rik 2.42E-05 -2.15248
Gm10002 0.031835 -2.12494
Gm10002 0.031835 -2.12494
Slc22a6 0.010923 -2.07768
Esd 0.023577 -2.06687
Gm16169 8.85E-05 -2.00995
6430573F11Rik 8.99E-08 2.00458 LOC100503213 0.034094 2.01892
Bmp4 0.01273 2.06115
Gna14 3.35E-08 2.08821
Gm11744 2.32E-05 2.09393
Cbln4 0.021051 2.12643
Hoxb9 0.003801 2.12871
Nkd1 2.14E-05 2.15054
Mettl7a2 1.65E-06 2.21692
Lrrc26 0.000573 2.22882
Lrrc55 2.25E-05 2.24894
Igk 0.01754 2.26064
Adamts19 5.60E-07 2.29237
Cdkn1a 7.58E-09 2.32177
Dock5 6.89E-08 2.32746
Glra1 0.002186 2.33206
Gadd45g 3.03E-06 2.34539
Axin2 1.23E-09 2.36502
Dlx3 7.96E-09 2.3702
Gpr50 0.002571 2.49813
Syk 2.43E-05 2.49831
2700046A07Rik 7.68E-07 2.53502
Wnt10a 2.42E-05 2.53589
Tcf7 1.17E-08 2.54261
Spo11 4.61E-06 2.65145
37
Mylk 1.71E-05 2.6964
Mafb 6.74E-05 2.73824
Gm9926 3.98E-05 2.82476
Emilin3 3.17E-06 2.87132
Rasl11b 1.35E-06 2.87278
Zfp503 2.29E-06 2.89595
C030034L19Rik 3.49E-07 3.00969
Sp5 3.47E-07 3.15039
Fzd10 1.74E-05 3.25743
Sostdc1 2.08E-05 3.3585
Ascl4 4.28E-08 3.48996
Il6ra 1.13E-05 3.52424
Lef1 1.51E-08 3.5281
Onecut1 8.25E-06 3.59348
D630039A03Rik 8.58E-08 3.65652
Gabra6 5.96E-07 3.72096
Ism1 1.31E-06 3.81828
Myo1e 1.58E-08 3.98353
Lgr6 9.71E-08 5.12478
Esyt3 6.02E-08 5.60377
Fst 1.51E-10 5.60408
Adam18 3.27E-06 5.75826
Notum 6.56E-11 6.26911
Cryba2 3.34E-07 7.95998
Mybpc1 1.17E-09 8.1496
Pmaip1 6.77E-09 9.39472
Igk 1.10E-05 11.0986
Wif1 1.91E-11 13.0107
Table 2.1. List of differentially expressed genes in Gsk-3DKO mice as compared to M-Cre/Gskα +/-controls. A list of the differentially expressed genes in Gsk-3DKO cerebella as compared to Cre+ controls,
38
Reagent Concentration Source Identifier
Animal Studies
C57BL/6 mice N/A The Jackson
Laboratory Stock #000664
Math1-Cre mice N/A The Jackson
Laboratory Stock #011104
Gsk-3α-/- mice N/A Donated by Dr.
William Snider’s lab N/A Gsk-3βloxP/loxP mice N/A The Jackson
Laboratory Stock #029592 SmoM2-eYFPloxP/loxP mice N/A The Jackson
Laboratory Stock #005130 Trp53loxP/loxP mice N/A The Jackson
Laboratory Stock #008462 CtnnbloxP/loxP mice N/A The Jackson
Laboratory Stock #004152
Cdkn1a-/- mice N/A The Jackson
Laboratory Stock #016565
Isoflurane Vapor Piramal Critical
Care, Inc. NCD Code #66794-017-25 5-bromo-2-deoxyuridine (BrdU) 100 mg/kg in
25 µl of HBSS ThermoFisher Scientific Catalog #B23151 5-ethnynyl-2’-deoxyuridine (EdU) 40 mg/kg in 25
µl of HBSS Life Technologies Catalog #A10044
PCR
Tail lysis buffer 1X Allele
Biotechnology Catalog #ABP-PP-MT01 Cre Forward Primer: GCG GTC
TGG CAG TAA AAA CTA TC 200 µM Invitrogen JAX #oIMR1084 Cre Reverse Primer: GTG AAA
CAG CAT TGC TGT CAC TT 200 µM Invitrogen JAX #oIMR1085
Gsk-3α Forward Primer: CCC CCA
CCA AGT GAT TTC ACT GCT A 200 µM Invitrogen N/A Gsk-3α Reverse Primer: AAC ATG
AAA TTC CGG GCT CCA ACT CTA T
200 µM Invitrogen N/A
Gsk-3β Forward Primer: GCC ATC
AAG AAA GTT CTA CAG GA 200 µM Invitrogen JAX #32390 Gsk-3β Reverse Primer: GCT GAA
GTC CAG AGC AAG TCT 200 µM Invitrogen JAX #32391
Trp53 Forward Primer: GGT TAA
ACC CAG CTT GAC CA 200 µM Invitrogen JAX #oIMR8543
Trp53 Reverse Primer: GGA GGC
AGA GAC AGT TGG AG 200 µM Invitrogen JAX #oIMR8544
Ctnnb Forward Primer: AAG GTA
GAG TGA TGA AAG TTG TT 200 µM Invitrogen JAX #oIMR1512 Ctnnb Reverse Primer: CAC CAT
39 Cdkn1a 1 Primer: GTT GTC CTC
GCC CTC ATC TA 200 µM Invitrogen JAX #12427
Cdkn1a 2 Primer: GCC TAT GTT
GGG AAA CCA GA 200 µM Invitrogen JAX #12428
Cdkn1a 3 Primer: CTG TCC ATC
TGC ACG AGA CTA 200 µM Invitrogen JAX #12429
SmoM2-eYFP Forward primer:
AAG TTC ATC TGC ACC ACC G 400 µM Invitrogen JAX #oIMR0872 SmoM2-eYFP Reverse primer: TCC
TTG AAG AAG ATG GTG CG 400 µM Invitrogen JAX #oIMR1416 Apex Taq DNA Polymerase Master
Mix 1X Genessee Scientific Catalog #42-138
Platinum Blue PCR SuperMix 1X Invitrogen Catalog # 12580015
Dissociation
Papain Dissociation System Per
manufacturer’s instructions Worthington Biochemical Corporation Catalog #LK003150
Heat inactivated FBS 100% for dissociation 10% in media
Gibco Catalog #10437028
Hank’s Balanced Salt Solution 1X Gibco Catalog #14175-095 D-(+)-Glucose 6g/L (33 mM) Millipore Sigma Catalog #G7021
Cell Culture
Poly-L-Lysine 1X Sigma-Aldrich Catalog #P4832
DMEM/F12 1X Gibco Catalog #11330-032
N2 Supplement 1:10000 in
media BD Biosciences Catalog #35-100 Penicillin-Streptomycin 1:10000 in
media Sigma-Aldrich Catalog #P4333 Potassium Chloride (KCl) 2.5 µM Mallinckrodt Catalog #6858 Sonic hedgehog (SHH) 0.5 mg/mL R&D Systems Catalog #464SH Paraformaldehyde (PFA) 4% fixative
0.1% in sheath fluid
Sigma-Aldrich Catalog #P6148
Immunofluorescence and Western Blot
Antigen Retrieval 1:100 Vector Laboratories Catalog #H-3300 Phosphate Buffered Saline (PBS) 1X Corning Inc. Supplier #46-013-CM
Tween 20 0.3% in PBS Sigma-Aldrich Catalog #P9416
Donkey serum 2% in 0.3%
PBST Millipore Sigma Catalog #D9663 Tris Buffered Saline with Tween
(TBST) 1X Cell Signaling Technology Catalog #9997
Bovine Serum Albumin (BSA) 1% in 0.1% or
0.3% PBST Fisher Scientific Catalog #BP9700-100 Bicinchoninic acid (BCA) assay Per
manufacturer's instructions
Thermo Fisher
40 4-20% Mini-PROTEAN® TGXTM
Precast Protein Gels N/A Bio Rad Catalog #4561094
DAPI 1:2500 for IF Invitrogen Catalog #D1306
cleaved Caspase-3 (Asp175) 1:200 for IHC Cell Signaling
Technology Catalog #9661 GSK-3α/β (D75D3) 1:100 for IF Cell Signaling
Technology Catalog #5676
PCNA 1:2000 for IF Abcam Catalog #ab92552
CDKN1B/p27 1:1000 Cell Signaling
Technology Catalog #3686 phospho-RB (Ser807/811) 1:3000 for IF
1:500 for WB Cell Signaling Technology Catalog #8516 phospho-Histone H3 (Ser10) (6G3) 1:100 for IHC Cell Signaling
Technology Catalog #9706
LEF1 1:200 for IF Sigma Catalog #HPA002087
TCF1 (C63D9) 1:100 for IF Cell Signaling
Technology Catalog #2203
CDKN1A/p21 1:500 for WB
1:2000 for IHC Abcam Catalog #ab109199 phospho-CTNNB (Ser33/37/Thr41) 1:500 for WB Cell Signaling
Technology Catalog #9561
CTNNB 1:500 for WB Cell Signaling
Technology Catalog #8480 phospho-GSK-3β (Ser9) (D85E12) 1:500 for WB Cell Signaling
Technology Catalog #5558 Cyclin D2 (D52F9) 1:500 for WB Cell Signaling
Technology Catalog #3741
β-Actin (8H10D10) 1:5000 for WB Cell Signaling
Technology Catalog #3700 Goat anti-rabbit Alexa Fluor 488 1:400 for IF ThermoFisher
Scientific Catalog #A-11034 Goat anti-mouse Alexa Fluor 555 1:400 for IF ThermoFisher
Scientific Catalog #A-21424
Novolink Polymer Per
manufacturer’s instructions
Leica Biosystems Catalog #RE7200-CE
ImmPRESS™ HRP Anti-Rabbit
IgG Per manufacturer’s
instructions
Vector Laboratories Catalog #MP-7401
ImmPRESS™ HRP Anti-Mouse
IgG Per manufacturer’s
instructions
Vector Laboratories Catalog #MP-7402
Anti-mouse IgG, HRP-linked
Antibody 1.5:1000 for WB Cell Signaling Technology Catalog #7076 Anti-rabbit IgG, HRP-linked
Antibody 1.5:1000 for WB Cell Signaling Technology Catalog #7074 Click-iT™ EdU Cell Proliferation
Kit for Imaging, Alexa Fluor™ 488 Per manufacturer’s instructions
ThermoFisher