STI 2018 Conference Proceedings
Proceedings of the 23rd International Conference on Science and Technology Indicators
All papers published in this conference proceedings have been peer reviewed through a peer review process administered by the proceedings Editors. Reviews were conducted by expert referees to the professional and scientific standards expected of a conference proceedings.
Chair of the Conference
Paul Wouters
Scientific Editors
Rodrigo Costas Thomas Franssen Alfredo Yegros-Yegros
Layout
Andrea Reyes Elizondo Suze van der Luijt-Jansen
The articles of this collection can be accessed at https://hdl.handle.net/1887/64521
ISBN: 978-90-9031204-0
© of the text: the authors
© 2018 Centre for Science and Technology Studies (CWTS), Leiden University, The Netherlands
Xianwen Wang*, Yunxue Cui*, Shenmeng Xu** and Zhigang Hu*
*xianwenwang@dlut.edu.cn, zmxiaohai@mail.dlut.edu.cn, huzhigang@dlut.edu.cn
WISE Lab, Institute of Science of Science and S&T Management, Dalian University of Technology, Dalian, 116024 (China)
**xushenmeng@gmail.com
School of Information and Library Science, University of North Carolina at Chapel Hill, Chapel Hill, NC 27599-3360 (USA)
Introduction
Open access (OA) refers to unrestricted online access to documents published in scholarly journals. It emerged in the Internet age and is intrinsically tied to the development of the Internet (Swan and Brown 2004; Laakso et al., 2011). Open Access is changing the traditionally subscription-based scholarly publishing and communication landscape (Laakso et al., 2011).
There are two main types of Open Access: Gold OA and Green OA (Harnad et al., 2008). Gold OA means that publications, either completely or partly, are available directly from the publishers for free. Green OA refers to author self-archiving, which is the practice of depositing articles (peer-reviewed articles and/or not peer-reviewed preprints) in an open access repository. This can be an institutional or a subject repository, or to a personal website (Laakso et al., 2011; Tennant et al., 2016). In addition, Hybrid OA is an intermedium form of OA, providing opportunities for authors to free individual articles from access barriers in subscription-based journals (Walker, 1998; Prosser, 2003). Besides, the emergence of Open-access mega-journals (OAMJs), such as PLOS ONE, Scientific Reports, AIP Advances, and BMJ Open, indicates the increasingly important role of open access in the scholarly communication environment (Spezi et al., 2017).
OA journals have started to emerge since the early 1990s (Björk 2004). As of January 2018, there were approximately 10,780 open access journals listed in the Directory of Open Access Journals (doaj.org) from 122 countries, with around 2,800,000 articles published. Björk et al. (2010) suggested that 8.5% of all scholarly journal volume in 2008 could be found free through some form of Gold OA. A 2015 study by the Max Planck Society reported the share of gold open access articles was 13% of all research papers (Schimmer, Geschuhn & Vogler 2015). Archambault et al (2014) used automated web scraping to identify OA content to make a large-scale measurement of open access availability. According to their results, as of April 2014, more than 50% of the scientific papers published from 2007 to 2012 were open access. Torres-Salinas & Orduna-Malea (2014) analyzed data from WoS to investigate OA literature
STI Conference 2018 · Leiden
percentage (published in gold OA journals), before the agreement with ImpactStory. According to the survey of the Universities UK OA monitoring group (2017), 30% of UK outputs (vs. 19% globally) in 2016 were published on immediate Gold OA terms. In addition, UK has kept an annual growth rate of over 30% throughout the period of 2012 to 2016. ScienceMetrix (2018) shows that, as measured in Q3 2016, the global proportion of articles published on Gold OA terms rose from 17.4% in 2006 to 23.3% in 2014, but decreased to 19.3% in 2015. The percentages of OA across scientific domains are very different. For the publication year 2014, the proportion of Gold OA articles in health sciences was 33%; while in Arts & Humanities, the proportion was only 7%. At the country level, Brazil has 41% of its publications published on Gold OA terms in 2014, ranking the first in OA availability among the countries with the most papers indexed in the WoS. The SciELO repository, which is an effective platform used to diffuse scholarly papers published in Brazil, contributed to this. Sweden tied with Poland in the second place, with a gold OA proportion of 29%. In addition, the UK, Netherlands, and Switzerland had a gold OA proportion of 28%. Piwowar et al. (2017) estimated that at least 28% of the scholarly literature was published on OA terms (19M in total). The most recent year analyzed (2015) had the highest percentage of OA (45%), including 9.4% Hybrid and 11.3% Gold. Based on Norway’s data, Mikki (2017) suggested that 68% of all articles were openly available. Literature about the estimation of open access share of papers is controversial as different methods have been applied, and different results achieved.
Open access articles are more immediately recognized and cited than non-OA articles (Eysenbach 2006). OA articles receive 18% more citations than average (Piwowar et al. 2017). Wang et al. (2015) confirmed the OA citation advantage and extended the observations to downloads and social-media interest, reporting that OA articles were downloaded, cited, and mentioned more than non-OA articles.
Research Gap and research questions
Restricted by the availability of large-scale data, previous studies usually conducted small-scale analyses focusing on one specific field, journal, or institution. Therefore, they not only lack generalizability but also can sometimes produce contradictory findings.
In this research, with the availability of large-scale data from Web of Science, which indexes over sixty million documents, we explore the following research questions: What is the worldwide landscape of Gold Open Access? Considering the OA ratios, which countries are (not) active in open access implementations? How is the evolution of gold OA rates of different countries during the past three decades?
Data
Since December 2017, open access status has been provided across the Web of Science platform as a result of a partnership with ImpactStory, which launched oaDOI (https://oadoi.org/), a knowledgebase of Open Access (OA) content. oaDOI makes it possible to discover and link to legal Gold (journal level), Hybrid Gold (open content in an otherwise paywalled journal), and Green (author self-archived) OA content.
WoS is about 68.5%. In Web of Science, gold open access are identified as fully published articles available from the publishers without charge, including legel Gold and Hybrid Gold (https://images.webofknowledge.com/WOKRS527R13/help/WOS/hp_results.html).
With the open access status at the article-level, it is possible for us to conduct a large-scale study of the OA status of publications. In this research, the data are collected from Web of Science, including Science Citation Index Expanded (SCI) and Social Sciences Citation Index (SSCI). The document types are restricted to Articles, Proceeding Papers and Reviews. The period of study is from 1990 to 2016. On the interface of search results, we refine the results by selecting the checkbox of “Gold” in the “Open Access” field. Then we get the Gold OA records. Publications are classified into two categories, which are Gold Open Access (OA) and Toll Access (TA). It is necessary to note that only Gold Open Access is considered in this study. The Gold Open Access articles here include articles published in Gold OA journals and OA articles published in hybrid journals.
The top 15 countries with the most publications in the period from 1990 to 2016 are selected as our research objects.
Results
Growth trend
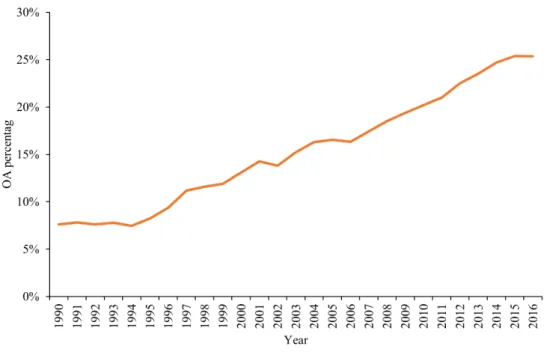
We calculate the percentage of Gold Open Access articles among all WoS articles; Figure 1 displays the growth trend of Gold OA articles from 1990 to 2016. The curve shows an obvious growing trend during this period. The open access articles take up a stable share of about 7.5% in the early 1990s and start to grow fast since 1995. Despite a few fluctuations in some years, the curve shows an overall upward trend. In 2015, the open access ratio has reached 25.40%, indicating that a quarter of articles are published in Gold OA. This ratio is a little higher than the result of 20.7% (11.3% Gold plus 9.4% Hybrid) reported in Piwowar et al. (2017). It is important to note that the evolution can be affected by the WoS journals coverage. Many OA journals emerged during the last decade, especially those OA mega-journals, e.g., PLOS One (which was launched in 2006), Scientific Reports, BMJ Open and AIP Advances (which were launched in 2011), etc. The fast growth of OA journals may have bias on the evolution of the OA percentage in WoS.
STI Conference 2018 · Leiden
Country analysis
Table 1 lists the top 15 countries with the most articles indexed in WoS from 1990 to 2016. The country of an article is determined by the authors’ affiliations. Therefore, an article may belong to different countries if the authors are from different countries. We also calculate the OA percentage for each country, as shown in Table 1. Brazil ranks the first with an OA percentage of 32.80%, followed by Netherlands (25.19%) and UK (24.11%). Russia has the lowest OA percentage of only 5.95%, which is lower than India (10.39%) and China (15.40%). For the other countries, the OA percentages fall in a narrow range from 18% to 23%.
Table 1. Top 15 countries with the largest number of WoS records
Rank Country OA articles Articles OA percentage
1 USA 1,599,449 7,927,016 20.18%
2 UK 500,401 2,075,315 24.11%
3 Japan 421,475 1,871,447 22.52%
4 Peoples R China 369,667 2,400,381 15.40%
5 Germany 367,542 1,994,905 18.42%
6 France 265,891 1,428,668 18.61%
7 Canada 239,576 1,175,806 20.38%
8 Italy 199,420 1,074,436 18.56%
9 Brazil 171,526 523,018 32.80%
10 Australia 167,913 817,933 20.53%
11 Netherlands 164,871 654,381 25.19%
12 Spain 154,599 837,630 18.46%
13 South Korea 125,004 666,523 18.75%
14 India 81,289 782,318 10.39%
15 Russia 39,962 671,293 5.95%
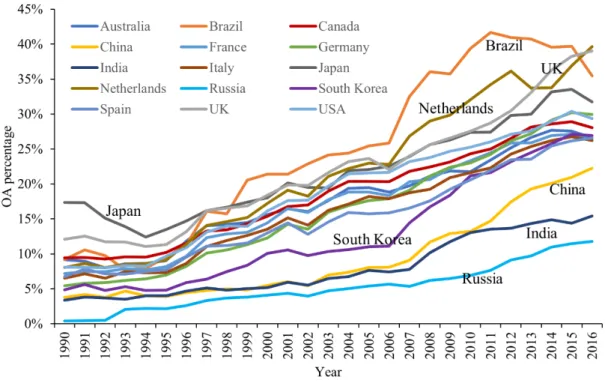
Figure 2 shows the temporal trend of the OA percentages of these 15 countries. Most countries fall in a narrow band with a similar temporal trend. However, there are some exceptions worthy to pay attention to. For instance, Japan had the highest OA percentage in the early 1990s and had kept a relatively high level among all countries until the late 1990s. For Brazil, the OA percentage was in the same range to most of the other countries in the beginning (1990 - 1996). Its remarkable growth began in 1997 and its OA percentage has been well ahead of the rest since then. In 2007, the growth of Brazil OA began to accelerate. The leading superiority of Brazil lasted from 1999 to 2015 until it was surpassed by the UK and Netherlands in 2016.The OA percentage of Brazil shows a downward trend since 2012.. For Russia, it has the lowest OA percentage and the lowest growth rate among all countries since 1990. In Russia, several federal and regional programs have been developed to render informational support to different domains as well as a program of electronic libraries construction. Most of them concentrate more on strategies rather than on the financing issues
most countries belong. The top three countries with the highest growth rate in the last five years are the UK, Netherlands and China, while most countries have declined slightly, including Japan, Canada, and Germany, etc.
Figure 2: Comparison of temporal trends of countries
Conclusions and discussion
The worldwide landscape of Gold OA shows that USA, UK and Japan are the top three countries with the most OA articles on WoS, followed by China and Germany. Particularly, using the OA filter of WoS incorporates an important bias in the data. We consider not only the absolute number of Gold OA literature but also the gold OA ratio of countries. Brazil, Netherlands and UK are the top three countries with the highest OA ratios, followed by Japan and Australia. Meanwhile, Russia, India and China have the lowest OA ratios. The landscape regarding the ratio of OA articles is very different with the rank based on the count of OA articles. Compared with the results of Torres-Salinas & Orduna-Malea (2014), except Brazil, the OA ratios of most countries are much higher than the results generated by the new OA filter option on WoS. Compared with the results of ScienceMetrix (2018) in 2014, the OA ratios of China, India, Brazil, Russia and South Korea are almost the same. However, the OA ratios of other countries in this study is a little higher, among which UK has the biggest difference (36% in this study and 28% reported in ScienceMetrix (2018)).
STI Conference 2018 · Leiden
Limitations
There are some limitations in this study. Firstly, there exists a WoS coverage bias that favors English language literature, as well as publications in natural science and life/health science (Mongeon & Paul-Hus, 2016). Secondly, the robustness and accuracy of oaDOI used in WoS needs to be paid attention to (now the recall is 77.0%, and the precision is 96.6%). Thirdly, the effects of OA policies on OA publishing needs to be further tested with econometrics models.
References
Archambault, É., Amyot, D., Deschamps, P., Nicol, A., Provencher, F., Rebout, L., & Roberge, G. (2014). Proportion of open access papers published in peer-reviewed journals at the European and world levels—1996–2013. . Copyright, Fair Use, Scholarly Communication, etc.. 8. http://digitalcommons.unl.edu/scholcom/8 (accessed 20 March 2018)
Björk, B. C. (2004). Open access to scientific publications—An analysis of the barriers to change? Information Research, 9(2), 170.
Björk, B. C., Welling, P., Laakso, M., Majlender, P., Hedlund, T., & Guðnason, G. (2010). Open access to the scientific journal literature: situation 2009. PloS one, 5(6), e11273. Eysenbach, G. (2006). Citation advantage of open access articles. PLoS biology, 4(5), e157. Harnad, S., Brody, T., Vallières, F., Carr, L., Hitchcock, S., Gingras, Y., et al. (2004). The
access/impact problem and the green and gold roads to open access. Serials Review, 30(4), 310–314.
Laakso, M., Welling, P., Bukvova, H., Nyman, L., Björk, B. C., & Hedlund, T. (2011). The development of open access journal publishing from 1993 to 2009. PloS one, 6(6), e20961.
Mikki, S. (2017). Scholarly publications beyond pay-walls: increased citation advantage for open publishing. Scientometrics, 113(3), 1529-1538.
Mongeon, P. & Paul-Hus, A. (2016). The journal coverage of Web of Science and Scopus: a comparative analysis. Scientometrics, 106(1): 213-228.
Moura, E. G. D., & Camargo Junior, K. R. D. (2017). The crisis in funding for research and graduate studies in Brazil. Cadernos de Saúde Pública, 33(4).
Piwowar, H., Priem, J., Larivière, V., Alperin, J. P., Matthias, L., Norlander, B., ... & Haustein, S. (2018). The State of OA: A large-scale analysis of the prevalence and impact of Open Access articles. PeerJ, 6, e4375.
Prosser, D. C. (2003). From here to there: a proposed mechanism for transforming journals from closed to open access. Learned publishing, 16(3), 163-166.
Ramalho Correia, A. M., & Carlos Teixeira, J. (2005). Reforming scholarly publishing and knowledge communication: From the advent of the scholarly journal to the challenges of open access. Online information review, 29(4), 349-364.
Schimmer, R., Geschuhn, K. K., & Vogler, A. (2015). Disrupting the subscription journals’ business model for the necessary large-scale transformation to open access. doi:10.17617/1.3.
Science-Metrix. (2018). Analytical Support for Bibliometrics Indicators: Open access availability of scientific publications. http://www.science-
metrix.com/sites/default/files/science-metrix/publications/science-metrix_open_access_availability_scientific_publications_report.pdf (accessed 20 March 2018)
Universities UK OA monitoring group, (2017). Monitoring the transition to open access: December 2017. http://www.universitiesuk.ac.uk/policy-and-analysis/reports/Documents/2017/monitoring-transition-open-access-2017.pdf
(accessed 20 March 2018)
Van Eck, N. J., Waltman, L., Larivière, V., & Sugimoto, C. R. (2018). Crossref as a new source of citation data: A comparison with Web of Science and Scopus. https://www.cwts.nl/blog?article=n-r2s234 (accessed 22 March 2018)
Spezi, V., Wakeling, S., Pinfield, S., Creaser, C., Fry, J., & Willett, P. (2017). Open-Access mega-journals: The future of scholarly communication or academic dumping ground? A review. Journal of Documentation, 73(2), 263-283.
Swan, A., & Brown, S. (2004). Authors and open access publishing. Learned publishing, 17(3), 219-224.
Thorley, M. (2012). RCUK Open Access Policy – Our Preference for Gold.
https://blogs.rcuk.ac.uk/2012/10/24/rcuk-open-access-policy-our-preference-for-gold/
(accessed 20 March 2018)
Torres-Salinas, D., & Orduña-Malea, E. (2014). Ruta dorada del open access en Web of science. Anuario ThinkEPI, 8, 211-214.
Walker, T. J. (1998). Free Internet access to traditional journals. American Scientist, 86(5), 463.
Wang, X., Liu, C., Mao, W., & Fang, Z. (2015). The open access advantage considering citation, article usage and social media attention. Scientometrics, 103(2), 555-564.