i
DIETARY PATTERN TRAJECTORIES OVER TIME AND DIABETES AMONG CHINESE ADULTS
Carolina Batis Ruvalcaba
A dissertation submitted to the faculty of the University of North Carolina at Chapel Hill in partial fulfillment of the requirements for the degree of Doctor of Philosophy in the
Department of Nutrition (Epidemiology), Gillings School of Global Public Health.
Chapel Hill 2013
Approved by: Barry Popkin, PhD Linda Adair, PhD
Penny Gordon-Larsen, PhD Michelle Mendez, PhD
ii © 2013
iii Abstract
CAROLINA BATIS RUVALCABA: Dietary Pattern Trajectories over Time and Diabetes among Chinese Adults.
(Under the direction of Barry Popkin)
iv
v
Acknowledgments
I was really happy during my time here at UNC. I wish to thank not only those that participated directly in this dissertation, but also everyone involved in making these four years of my life so memorable.
To my advisor, Barry Popkin. He had faith on me and gave me the opportunity to be here. He identified my strengths and weaknesses as a researcher and guided me accordingly. He always put the right amount of pressure on me, enough to challenge me and make me improve, but not too much to make me feel overwhelmed or discouraged. He gave me freedom and allowed, supported and encouraged me to follow my research interests. I’m immensely grateful to him; he was always kind and caring.
To my committee members, Linda Adair, Penny Gordon-Larsen, Michelle Mendez and Daniela Sotres-Alvarez. With their different expertise and teaching styles they
complemented each other. They had the right answers, and they had the right questions. I was always amazed by how much their comments, revisions, and feedback make me think
through, re-think and clarify my own thinking.
vi
data sets; and Bonnie for sitting with me during many hours going over the foods, food groups and my papers, making sure my treatment and interpretation of the data was accurate to the Chinese context.
To all the Nutrition and Epidemiology professors I interacted with. Through their carefully designed courses, they gave me the basis and helped me develop my critical thinking. Outside the classroom, through meetings or informal chats, they kept building my understanding of the concepts, shared their experiences, and offered advice for personal and professional development.
To all the Nutrition students. I was always surrounded by friends and felt welcomed at all times, I’m mostly grateful for the lively and collaborative environment created by all students. I especially thank my nutritional epidemiology cohort (aka “tres morenas”) Carmen and Niha. They’re smart and hardworking, but also centered, laidback, easygoing and caring. We went through everything together, and it was so much easier and fun because of them. I also want to thank my office neighbors Jennifer, Dalia, Chris, Kevin and Beth, the students I interacted with, at lunch and work, on a daily basis. They taught me we don’t need decades of research experience to be able to figure things out and help each other; having someone like them interested in listening, asking and thinking aloud was all I needed most of the times.
To my “almost-all-Spanish-speaking”friends Laura, Kimon, Jorge, Daniela, Yani,
vii
To my parents. They were with me the whole time through Skype. They are really proud of me, but I know they would be proud of me with or without a PhD. All they care is that I’m happy and knowing that they love me just because I’m their daughter is what I appreciate the most.
viii
Table of Contents
List of Tables ...x
List of Figures ...xii
List of Abbreviations and Symbols...xiii
Chapter 1. Introduction ...1
Background ...1
Research Aims ...2
Chapter 2. Literature Review ...5
The burden of chronic diseases globally and in China ...5
Nutrition transition and dietary changes in China ...6
How does the study of dietary patterns contribute to the field of nutrition epidemiology? ...7
Analyses of dietary patterns over time...10
Advantages of using the China Health and Nutrition Survey (CHNS) ...13
Chapter 3. Longitudinal Analysis of Dietary Patterns in Chinese Adults from 1991 to 2009 ...14
Overview ...14
Introduction ...15
Methods...16
Results ...21
Discussion ...25
ix
Chapter 4. Using both Principal Component Analysis and Reduced Rank Regression to Study Dietary Patterns and Diabetes in Chinese
Adults. ...41
Overview ...41
Introduction ...42
Methods...44
Results ...49
Discussion ...52
Tables ...59
Chapter 5. Dietary Pattern Trajectories during 15 years of Follow-up and HbA1c, Insulin Resistance and Diabetes Prevalence among Chinese Adults. ...68
Overview ...68
Introduction ...69
Methods...70
Results ...77
Discussion ...80
Tables and Figures ...87
Chapter 6. Synthesis...94
Overview of findings ...94
Limitations and strengths ...98
Significance and public health impact ...101
Future directions ...103
x List of Tables
Table 3.1 General characteristics of study sample by wave ...31
Table 3.2 Mean energy intake, number of food groups consumed and percentage of consumers for different food groups by wave ... 32
Table 3.3 Exploratory Factor Analysis at each wave ... 33
Table 3.4 Tracking of dietary patterns ... 35
Table 3.5 Mean energy intake, number of food groups consumed and percentage of consumers for relevant food groups, among those in the 4th highest quartile of the factor score in each dietary pattern and year. ... 36
Table 3.6 Factor score differences by sample characteristics in each wave ... 37
Supplemental Table 3.1 Examples of food items for each food group ... 38
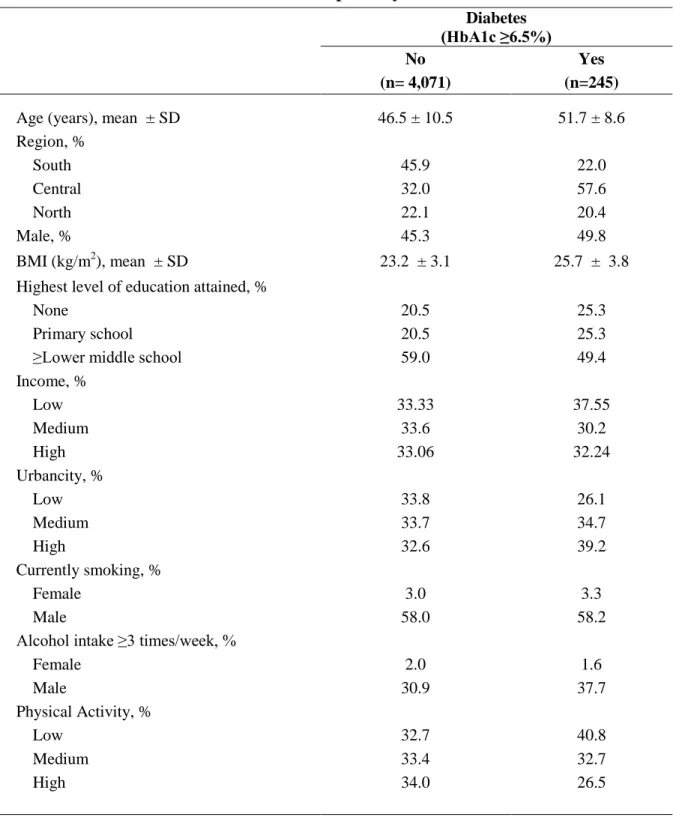
Table 4.1 Baseline Characteristics of Participants by Diabetes Status ... 59
Table 4.2. Factor loadings and explained variation of dietary patterns obtained from Principal Component Analysis and Reduced Rank Regression. ... 60
Table 4.3 Percent change in HbA1c and HOMA-IR related to quartiles of dietary pattern score and linear dietary pattern score increase (1 SD) ... 61
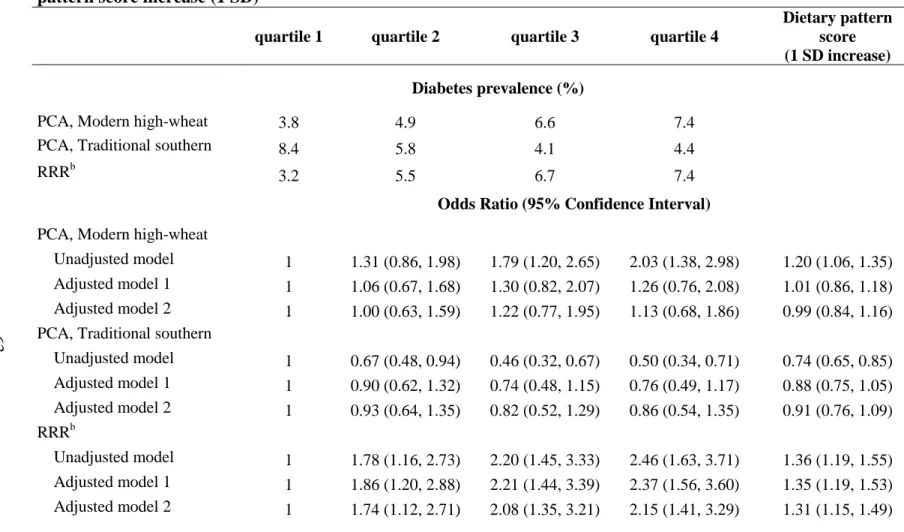
Table 4.4 Association between Diabetes (HbA1c ≥6.5%) and quartiles of dietary pattern score and linear dietary pattern score increase (1 SD) ... 63
Supplemental Table 4.1 Examples of food items for each food group included and not included in dietary pattern analysis. ... 64
Supplemental Table 4.2 Factor loadings and explained variation of dietary pattern obtained from Reduced Rank Regression performed on the original intake variables ... 66
xi
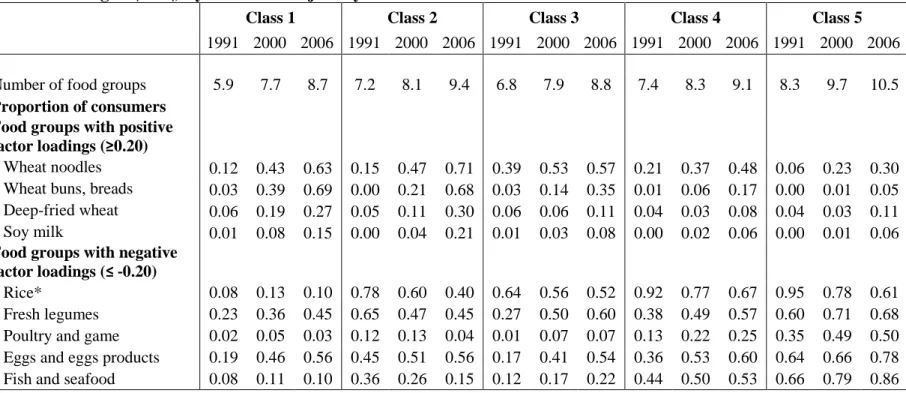
Table 5.1 Number of food groups and proportion of consumers for food groups associated with dietary pattern (Factor loadings > |0.20|) by wave and
trajectory class. ... 87 Table 5.2 Means or percent for demographic characteristics by dietary pattern
trajectory class ... 88 Table 5.3 Association between dietary pattern trajectory classes from 1991-2006
and HbA1c, HOMA-IR and newly diagnosed diabetes prevalence in
2009 ... 89 Supplemental Table 5.1 Model fit and trajectory classes characteristics ... 90 Supplemental Table 5.2 Dietary pattern derived from Reduced Rank Regression
in 2006 ... 91 Supplemental Table 5.3 Independent association between relevant food groups
xii List of Figures
xiii
List of Abbreviations and Symbols
BMI Body Mass Index
CHNS China Health and Nutrition Survey FFQ Food Frequency Questionnaires
HOMA-IR Homeostasis Model of Insulin Resistance INFS Chinese Institute of Nutrition and Food Safety LCTA Latent class trajectory analysis
NA Not applicable
PCA Principal Component Analysis RRR Reduced Rank Regression
1
Chapter 1. Introduction Background
The burden of chronic diseases is increasing rapidly in China and around the world, and diet is an important determinant of these conditions. The study of data-driven dietary patterns can help enhance our understanding of human dietary practices and their relationship with chronic diseases such as obesity and other cardio-metabolic outcomes. An important limitation in this specific area of research is that most of the studies associating dietary patterns with chronic diseases are cross-sectional or prospective cohorts with dietary intake measured only at baseline. These studies assume that diet remains constant over time in all individuals, an assumption that might be incorrect particularly in populations with rapid changing environments.
Some studies have addressed this limitation by examining dietary patterns with repeated measures of diet over time; however none of these have been conducted in Chinese population. In addition, there are only few studies performed in different populations around the world that have assessed the effects of inter-individual changes in dietary patterns
trajectories.
2
we can further enhance our understanding of human dietary practices and it association with health outcomes.
We used The China Health and Nutrition Survey (CHNS), a large cohort that includes a highly diverse sample with variations in a wide-ranging set of socioeconomic factors (income, employment, education, and modernization) and related health, nutritional, and demographic measures. It has repeated detailed measurements of diet over the course of almost 20 years (1991, 1993, 1997, 2000, 2004, 2006, 2009). This data set offers unique opportunities to contribute to the dietary patterns research field; it has multiple repeated measures over a long period of time, in a rapid changing environment and in population seldom studied in this particular area.
Research Aims
Aim 1. Study the changes and stability of dietary patterns over 18 years in Chinese adult population.
1a. Derive the dietary patterns independently at each point in time to determine whether the structure of dietary patterns have changed or remained stable.
1b. Using applied scores assess the tracking, trends over time, and socio-demographic characteristics associated with the adherence to each dietary pattern.
3
derive the pattern score at all other times. This way a score representing the same dietary pattern over time is obtained.
Aim 2. Identify the association between dietary patterns in 2006 and diabetes.
2a. Evaluate the association between the dietary patterns derived with Factor (FA) or Principal Component Analysis (PCA) and diabetes prevalence.
2b. Complement the analysis by comparing previously the derived identified patterns and their strength of association with a dietary pattern derived from Reduced Rank Regression (RRR) (HbA1c, fasting glucose and HOMA-IR as response variables).
The strength of one method is the limitation of the other; PCA identifies patterns that have public health relevance because they describe the actual dietary patterns of the
population whereas the foods in the RRR are not necessarily consumed together and hence could be behaviorally irrelevant. Conversely, the patterns from RRR are by definition associated with the outcome or response variables, which might not be the case for PCA patterns. Therefore both methods can complement each other and provide useful insights when compared side by side.
Aim 3. Evaluate the association of different dietary pattern trajectories with diabetes. 3a. Identify groups of individuals with similar dietary pattern trajectories, and the socio-demographic characteristics associated with group membership.
4
5
Chapter 2. Literature Review The burden of chronic diseases globally and in China
Globally the burden of chronic diseases is increasing rapidly. In 2001 it was estimated that 60% of all deaths were due to chronic diseases.1 China is no exception to this world scenario, in fact it is one of the countries with the most rapid increase in obesity and other chronic diseases2. From 1989 to 1997 the prevalence of a BMI higher than 25kg/m2 tripled among men and doubled among women in China. 3 In addition to China’s increased burden, it is particularly important to study the factors associated with chronic diseases in this
population because 1) China is the most populated country in the world, with over 1.3 billion people, and any given prevalence of a chronic disease affects therefore an absolute
significant number of persons. For example, 92 million of Chinese are diabetic4 and there are more persons with cardiovascular disease in India and China than in all the economically developed countries in the world combined 1. 2) Compared to Western populations, Asians have higher abdominal obesity and insulin resistance; and, they develop cardiometabolic risk factors at lower BMI and at younger ages 5-8
The important role of diet and nutrition as determinants of chronic diseases is well established.1 Therefore, continued research efforts should be done in order to better
6 Nutrition transition and dietary changes in China
Rapid economic and social changes have contributed to rapid shifts in the diets of the Chinese population. The traditional Chinese diet consisted of cereals and vegetables with few animal products, but a marked increase in the diversity of the diet has been observed.9 The changes seen follow a Westernization pattern that is due to the introduction of a free market for food products. The intake of edible oils and animal-source foods has increased; e.g. animal products more than tripled from 1952 to 1992. On the other hand, cereal intake has decreased considerably during the last 2 decades, especially coarse cereals. Vegetable intake has remained mainly unchanged in urban areas but slightly decreased in rural areas; while fruits have slightly increased.9-11 All of these changes have led to an increase in the overall energy density of the diets. The food marketing landscape has also changed considerably since China has the world’s fastest growth in supermarkets. Fast-food chains are rapidly expanding in the cities and the intake of soft-drinks is starting to increase. However, Chinese people still consume limited amounts of Western-style fast foods and sweetened beverages compared to Western societies.9-11
7
How does the study of dietary patterns contribute to the field of nutrition epidemiology?
Dietary patterns have been proven as a useful tool for studying diet. Contrary to the single nutrient or food group approach, dietary patterns consider multiple foods. And because people select foods in combination and not single nutrients, dietary patterns most closely resemble the actual eating behavior12-14. In addition, studying dietary patterns is
advantageous to exploring associations of diet to disease. For instance, 1) the single nutrient approach may be inadequate for accounting for complicated interactions among nutrients, 2) the high correlation between nutrients could make difficult the investigation of their separate effects, 3) the effect of a single nutrient may be too small to detect, 4) analysis for multiple nutrients or food groups can yield statistical significant results simply by chance and 5) nutrient or foods are commonly associated with specific dietary patterns which may cause confounding hard to control for. 14
In general dietary patterns can be grouped in 2 categories: theory-driven or data-driven. Theory-driven are score-based approaches based on dietary recommendations (i.e. Healthy Eating Index15). Data-driven or empirical dietary patterns use statistical methods to reduce many food or food groups into a set of meaningful patterns that describe the way people eat.
8
patterns” but the effect of patterns that are already followed by the population. Therefore, in this proposal we will only focus on data-driven dietary patterns.
There are two common approaches to derive data-driven dietary patterns: 1) factor analysis, which identifies linear combinations of foods that are frequently consumed together, and gives a summary score to each individual for each pattern; and 2) cluster analysis, where individuals are classified into mutually exclusive groups based on the
similarities between their diets)14,16. In spite of the subjectivity involved during the process of dietary pattern derivation, consistent results have been found for the association with some diseases. The “western”, “junk food”, “cosmopolitan”, “empty calories” patterns have been associated with increased risk, and “healthy” or “prudent” patterns high in vegetables, fruits, fish, reduced-fat dairy, cereals, have been associated with decreased risk.16,17
However, findings for BMI, obesity or waist circumference have been inconsistent. This was apparent in a literature review of studies examining the association between dietary patterns and BMI.18 From nine studies that used factor analysis, three did not find a
significant association. Among the ones that found significant associations, the types of patterns associated with lower BMI ranged from: “low culinary complexity” (confectionery, butter, cookies), “satiating” (macaroni, sausage, white bread), “convenience” (beer, chips, sauces), “high fat/sugar-dairy”, “traditional” and “prudent”. Whereas some of the patterns positively associated with BMI were “fruit”, “high fat” (eggs, bacon, sausage), “salad”, “bush food” (rabbit, duck, fish), “fruit juice” (fruit juice, high sugar drinks, canned fruit) and “western” (red meat, processed meat, refined grains). Most of the studies were
9
products and high-fiber foods are associated with smaller gains in weight and waist circumference19. And that increases in healthy pattern score between two points in time is associated with either decreases in BMI or smaller increases in BMI20.
In terms of diabetes and diabetes related markers, several studies in populations around the world using factor analysis have been conducted. Healthy dietary patterns have been inversely associated with insulin resistance or insulin, whereas Western patterns (higher intakes of red meats, high-fat dairy products, and refined grains) have shown the opposite effect 21,22. Similarly, patterns primarily rich in vegetables and fruit have been associated with reduced risk of incident diabetes. And patterns characterized by dim sum and meat; or red and processed meats, sweets and desserts, french fries, and refined grains; or butter, potatoes, and whole milk have been found to be associated with increased risk of incident type 2 diabetes.23-26
Despite the contributions of dietary patterns to the study of diet and diet-disease associations, an important limitation is that most of the studies measure diet only at one point. They assume that diet remains constant over time in all individuals, and that therefore one point in time represents long-term intake. This assumption might be incorrect
particularly in populations with rapidly changing environments. In addition these studies also assume that one point captures the relevant time-frame for disease development, leaving out the possibility of testing different time-frames. This gap in the literature may even be a reason for the inconsistent results found for obesity outcomes.
10
population and time specific. Thus, so far only few studies have examined dietary patterns with repeated measures of diet.20,27-33
Analyses of dietary patterns over time
The studies of dietary patterns over time, conducted so far have had the following purposes:
1) Looked at the stability of dietary patterns in the population. One approach was to derive dietary patterns independently at each point in time and to assess if the patterns remain similar or if new patterns emerge. Another approach was to apply the scores or
characteristics of the patterns found in one point to the rest of the measurements, so that the same patterns were analyzed over time27,29,32,33. Stability has been usually examined using correlation of scores or agreement between quantiles in 2 points in time.
2) Evaluated the within-subject difference in dietary patterns, by looking at the change in quantiles or score differences in 2 points in time, and analyzed how these differences affected health outcomes20,30.
3) Examined the association between a dietary pattern and a heath outcome using multilevel models. These models used the repeated dietary patterns for obtaining an average dietary pattern-health outcome association while adjusting by the inter-individual correlation of repeated measures28,31.
11
both times32. If this analysis was performed by looking only at the food groups level (instead of dietary patterns), the authors could had identified an increase in fast-foods at a certain age, but with this analysis they were able to identified that these foods were in addition eaten in combination. This study essentially told us that people select not just one food but major combinations and it is often misleading to examine one food when multiple foods are correlated.
No analyses on dietary patterns over time have been conducted in Chinese
population. As exemplified above, we can gain meaningful insight and knowledge about the dietary practices in China by using this type of analysis. Moreover, not only no analyses over time have been conducted in this country, but also studies with only diet at one point in time are scarce. It is particularly important in the research field of dietary patterns to have
population specific studies. It has been seen that even between different countries, both dietary patterns and their relationship with disease have similarities, however, important cultural differences might exist 14,17. As an example, patterns rich in vegetables are generally associated with lower risk of obesity and chronic diseases; however a study among Chinese found that the vegetable-rich food pattern was associated with oil and energy intake and with increased risk of obesity 34. This emphasizes the need of extending the research in dietary pattern in this region, which we propose to address in our study.
12
to adjust by them. These methods do not adequately represent the dynamic history of the dietary exposure, and therefore have limited ability to detect when the exposure has the highest effect on adverse health outcomes. A step beyond, would be to trace the individuals dietary trajectories with all available dietary data over a long period of time, and group individuals with similar trajectories to assess what socio-demographic and health outcomes they also share. Individuals may have a similar dietary pattern at one point in time, but some of them could have recently adopted this pattern and some could have followed the same pattern for years. It is essential to understand if the associated health risks for these two types of trajectories are different.
13
Advantages of using the China Health and Nutrition Survey (CHNS)
This survey has many unique characteristics that overcome some of the limitations on previous studies and can help us get important insights in the dietary pattern-disease
relationships. For instance, the long follow-up of the rapid changing environment in China, offers a unique opportunity to determine the time period where diet is most relevant for disease development. If the diet of all individuals remains constant over time, it cannot be distinguished if the relevant exposure is the most recent and it happened to be the same of a longer follow-up period, or if the diet of the entire follow-up is the relevant time-frame.
The great heterogeneity in diet over time seen in this cohort, is also complemented with a wide temporal and spatial variation in socioeconomic factors such as income, employment, education and modernization. This variation can enabled us to better understand how do these factors affect dietary patterns.
14
Chapter 3. Longitudinal Analysis of Dietary Patterns in Chinese Adults from 1991 to 2009
Overview
15
modern high-wheat pattern, a pattern associated with several energy-dense foods is cause of concern.
Introduction
China is one of the countries with the most rapid increases in chronic diseases; overweight/obesity (BMI ≥25kg/m2
) prevalence among adults was 15% in 1992, 22% in 200241 and 33% in 2007-0842. Diabetes, hypertension and dyslipidaemia reached a prevalence of 10%, 27% and 65% respectively in 2007-0842. Due to the key role that diet plays in all of these chronic diseases, it is important to better understand the eating behavior of this population.
Over the last two decades, many important changes in the diet of the Chinese population have been identified. Eating behaviors like snacking emerged and continue to grow, and cooking methods have also changed from predominantly steaming and boiling to frying43,44. A marked increase in dietary diversity has also been observed, with more people consuming food from a higher number of food groups10. The intake of vegetables, fruits, cakes, and milk and other animal products like pork, poultry and eggs have increased; whereas the intake of cereals and tubers has decreased45.
In addition to the study of number of meals, cooking methods or food group
consumption, data-driven dietary pattern analyses, such as factor or cluster analysis, are also useful for studying diet. Dietary patterns more closely resemble actual eating behaviors because they consider multiple food groups instead of single food groups or nutrients, and they give insights into how people eat by identifying the foods that are eaten in
16
that is high in wheat, wheat products, maize, sorghum and tubers; the “green water” or “traditional southern” pattern high in rice, vegetables, seafood, pork and poultry; and the “western” or “new affluence” pattern high in beef, lamb, milk, cheese, yogurt, cakes, juices and nuts46-48. However to best of our knowledge, no longitudinal analysis of dietary patterns over time has been conducted in the Chinese population.
To fill this gap, we used measurements of dietary intake from seven occasions over the course of 18 years collected in the China Health and Nutrition Survey (CHNS). When examining dietary patterns over time there are two different dimensions one can look at, one is the changes or stability in the general structure of the dietary patterns (are foods combined differently in each year?), and another is the individuals’ level of adherence to each dietary pattern over time. Therefore, our aims were to first derive the dietary patterns independently at each point in time to determine whether the structure of dietary patterns have changed or remained stable. Secondly, we assessed the tracking, trends over time, and
socio-demographic characteristics associated with the adherence to each dietary pattern.
Methods
Study design and participants
The CHNS is an ongoing study with detailed income, employment, education,
17
Center for Disease Control and Prevention. Participants provided their written, informed consent. Additional details about the CHNS data are provided elsewhere49.
Surveys were conducted in 1989, 1991, 1993, 1997, 2000, 2004, 2006 and 2009. We used data from 1991 to 2009 because in 1989 only adults aged 20-45 years were included. All waves of the CHNS obtained identical clinical, dietary and anthropometric data from each household member. We included all adults aged 18 to 65 years old at any wave with at least 3 waves with complete dietary data (N=9,253); from these 20% had all 7 waves of diet complete, 50% had 5 or more, and 75% had 4 or more waves of diet complete.
Dietary assessment and food grouping
The dietary assessment in the CHNS is a combination of three consecutive 24-hour recalls at the individual level and a food inventory at household level performed over the same three day period. The three consecutive days were randomly allocated to start from Monday to Sunday. For the food inventory, all available foods at the household (purchased, stored or home produced) were measured on daily basis with Chinese balance (1991-1997) or digital scales (2000-2009). The changes in the household food inventory as well as the wastage were used to estimate total household food consumption. For the 24-hour recall, trained interviewers recorded the types, amounts, type of meal and place of consumption of all food items consumed. For dishes prepared at home the amount of each dish was estimated from the household food inventory, based on the proportion of each dished the person
reported to have consumed.
18
alcoholic beverages, because it was mostly consumed by males, with very low consumption for females. Further description of the food group classification that we used can be found in Supplemental Table 3.1.
Statistical analysis
Because in each wave we included subjects that were 18 to 65 y old, it was possible for subjects to be excluded at certain waves (e.g. a subject 64 y old in 2000 would be
excluded in 2004 and after, or a subject aged 14 y old in 1991 would be included only when he became 18 in 1993). This exclusion criterion resulted in younger subjects at the later waves. In addition, the proportion of subjects in the sample residing in the North region increased since 2000. This was because in 1997 a province in the North was unable to participate and a substitute province was included in the study; and in 2000 both the original and the substitute provinces were included again. Therefore, all analyses were adjusted by geographical region and age in 1991(equivalent to adjusting by birth year), so that the dietary trends found over time were not related to these sample distribution changes in age and region.
Most food groups had a high proportion of non-consumers; possibly due to the fact that diet intake was measured over a 3-day period. Therefore, we categorized consumption as binary (non-consumers vs. consumers) for food groups with <25% of consumers in all
waves; and otherwise as a three-level variable (non-consumers, consumers below or above the estimated median using all waves).
19
matrix. Conceptually, ordinal variables have an underlying continuous normally distributed variable, so thresholds for the levels of the categorical variables are estimated. These
thresholds are normal z scores corresponding to the cumulative proportion of subjects in each category [i.e. for a binary variable (non-consumers vs. consumers) with a 0.87 proportion of non-consumers, the threshold between the two categories would be equal to the
corresponding normal z-score 1.13].50,51
Food groups with ≤5% of consumers in all waves were not included in the factor analysis. These food groups are uninformative because of their intake’s lack of variability in the population, and also they could produce bivariate tables with empty cells and affect the polychoric correlation.
20
specifying the factor loadings and thresholds estimated from year 2000. Because thresholds are z scores of the intake variables and they are involved in the estimation of the score, it is important that they are not year-specific; therefore we also fixed them to the estimates of year 2000.
Pearson correlation coefficients of the factor scores between each pair of waves were computed to assesses the tracking (maintenance of a relative position or rank over time) of each dietary pattern. Factor score means over time were computed, to look at trends in each dietary pattern. Finally, multiple linear regressions with each factor score as the outcome and socio-demographic variables as the predictors were performed independently in each wave, the clustering at the household level was accounted for in the estimation of the variance. Except for the factor analysis, all other analyses were conducted in Stata 12.1 (StataCorp, College Station, TX).
Sensitivity Analysis
In order to corroborate that the dietary patterns obtained at each wave were not affected by the sample changes in geographical region and age, we computed inverse probability weights and included them in the factor analysis. We fitted two logistic
21
In addition, because subjects coming from the same households were more likely to consume the same type of food groups, we repeated the analysis using only a single member per household (selected randomly, n=4,837). We found that the dietary patterns did not change meaningfully; all loadings had a difference below 0.08. Also, the correlation
coefficients between scores remained basically unchanged (all differences in the coefficients were below 0.03).
Results
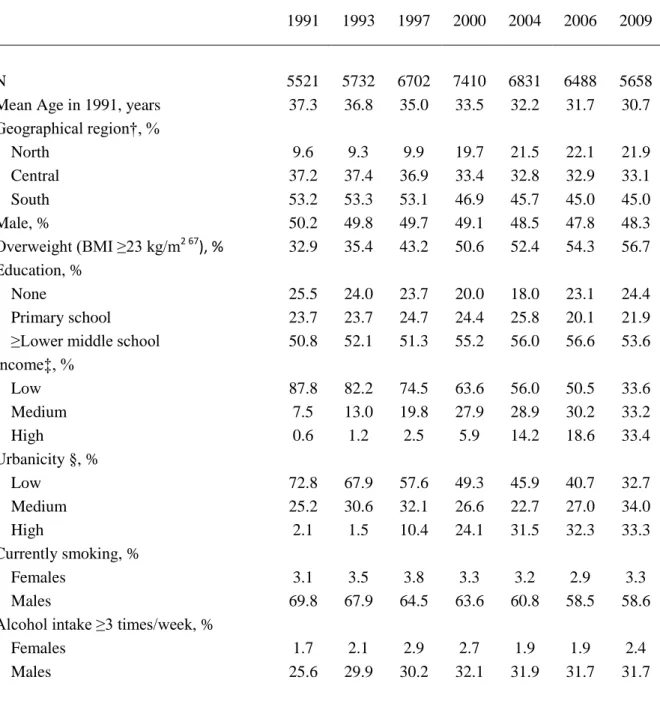
There was a dramatic increase in the prevalence of overweight from 1991 to 2009 and in the proportion of the sample classified as medium and high income over the same period, which paralleled changes in urbanization. The proportion of smokers declined over time in males, and remained low in females (Table 3.1).
The mean total energy intake increased by 267 kJ/d (64 kcal/d) from 1991 to 2009 (Table 3.2). In general, it can be seen that the diversity of diet increased over time, the mean number of food groups consumed increased over time and for most of the food groups the percentage of consumers also increased. The only food groups with a decline in the percentage of consumers from 1991 to 2009 were: wheat flour, dried legumes,
22
The following food groups had ≤5% of consumers in all waves (data not shown): deep-fried rice/legumes, dried fruit, preserved fruit with added sugar, seaweed, processed meats, dairy products, sweetened dairy products, Western-style fast-food, salty snacks, ready-to-eat cereals/porridge, calorically-sweetened beverages, and low-caloric beverages. So even if these modern-type foods are gaining popularity in China, over a 3-day period, they were not yet widely consumed by 2009.
Using factor analysis on a total of 29 food groups (excluding food groups with ≤5% of consumers) we identified two dietary patterns, which we called “traditional southern” and “modern high-wheat”. These dietary patterns, despite the increase in the diversity of diet, remained relatively stable (Table 3.3). Across time, the traditional southern dietary pattern was positively associated with the intake of rice, fresh leafy vegetables, low-fat red meat, low- and high-fat pork, organ meats, poultry and fish/seafood and inversely associated with wheat flour, corn/coarse grains. Interestingly, the loadings of rice, wheat flour and
23
in these years, but when these foods began to be consumed in 1997, they became prominent in the modern high-wheat dietary pattern.
Because overall we found similarity in dietary pattern structure over time, we computed applied scores and hence the rest of the results refer to these applied scores. The correlation coefficients for scores between years were considerably higher for the traditional southern pattern compared to the modern high-wheat pattern; 0.67-0.80 vs. 0.46-0.63
respectively (Table 3.4). This means that the tracking of the traditional southern pattern was higher, or in other words that individuals maintained their relative position over time. The tracking of the modern high-wheat pattern was lower, representing that subjects were less stable in their relative position.
The mean dietary pattern score increased over time for both dietary patterns, however the slope was considerably higher for the modern high-wheat pattern (Figure 3.1 A). To understand how much of the increase in both scores was related to the increase in diet diversity, we adjusted the scores by number of food groups consumed (Figure 3. 1B). After adjustment, the traditional southern pattern had a flat trend over time, and the modern high-wheat had only a slight increase. This means that for the modern high-high-wheat pattern, in order to increase the score while holding the number of food groups constant, individuals were either substituting other foods with food groups related to this pattern or had a higher consumption of these.
24
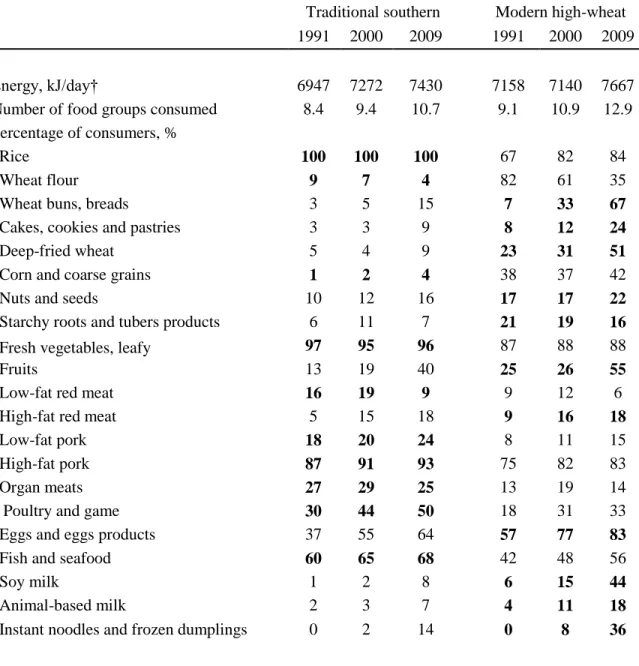
high scores for either pattern. However, the increase in percentage of consumers in the food groups positively related the modern high-wheat pattern, among the followers of this pattern, is dramatic. For example from 1991 to 2009 wheat buns/breads increased from 7 to 67%; cakes/cookies/pastries, 8 to 24%; deep-fried wheat 23 to 51%; fruits, 25 to 55%; soy milk, 6 to 44%; and instant noodles/frozen dumplings, 0 to 36%. This large increase in consumption of key food groups associated with the modern high-wheat dietary pattern can explain the upward trend observed in the score of this pattern. While we only present food groups relevant for the dietary patterns in Table 3.5, we also examined food groups excluded from the dietary pattern analysis due to low proportion of consumers (not shown), we found that none of these food groups had a higher percent of consumers in one of the dietary patterns, with the exception of deep-fried rice/legumes (traditional southern: 5-6% of consumers in the 4th highest quartile, versus 1-2% of consumers in the modern high-wheat dietary pattern).
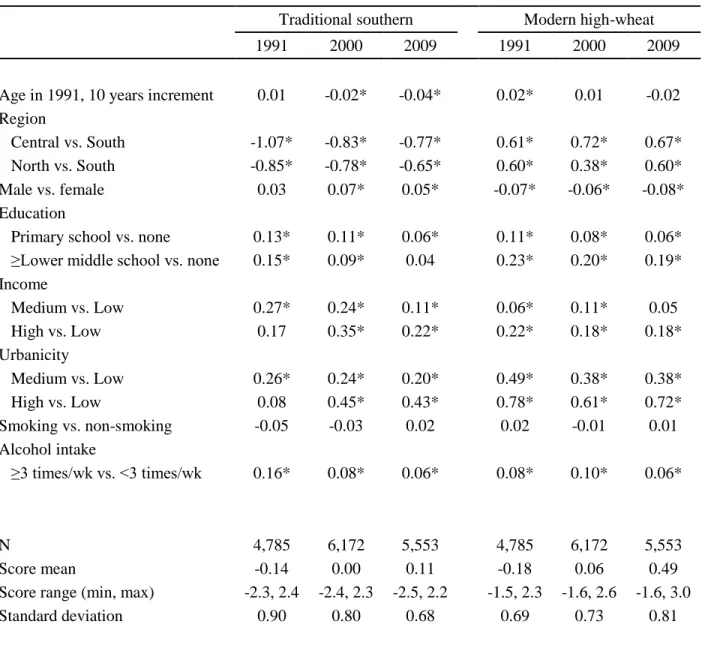
Finally, we run multiple linear regressions in each wave and looked at how socio-demographic factors were related to the traditional southern and modern high-wheat dietary patterns (Table 3.6). Geographical region was strongly associated with the traditional southern pattern, with lower scores in the central and north compared to the south.
25
time. Adjusting by number of food groups consumed did not affect the estimates, although differences for education, income and urbanicity level were largely attenuated (data not shown).
Discussion
In this longitudinal study that included 7 waves of diet data over the course of 18 years (from 1991 to 2009), we derived two dietary patterns using factor analysis: a traditional southern pattern characterized by rice, vegetables, meat, poultry and fish; and a modern high-wheat pattern characterized by high-wheat products, nuts, fruits, eggs, milk and instant
noodles/frozen dumpling. Despite the rapid increase in diet diversity, the structure of these two dietary patterns remained stable over time, meaning that the type of foods the population chose to eat in combination has not changed. However, compared to the traditional southern pattern, the scores of the modern high-wheat pattern had lower tracking and steeper upward trend over time, indicating that this pattern is more dynamic and is becoming more popular over time. Higher education, income and urbanicity level were all related to higher scores in both patterns, but the difference in pattern scores between these socio-economic groups became smaller over time, reflecting that access to these dietary pattern is becoming more widely available.
26
southern” high in rice, vegetables, seafood, pork and poultry; and “Western” high in beef, fruit, eggs, poultry, seafood, tofu, milk, cake, fruit juice, beverages and nuts.47,48 Our “traditional southern” pattern is comparable to the one previously described. However, our “modern high-wheat” pattern could be considered as a combination of the “traditional northern” and “Western” patterns that these previous studies have found. This is reasonable because even in these studies, a considerably high intake of wheat, fried-wheat and other cereals was observed in the “Western” pattern. In addition, in the Jiangsu province a pattern similar to our “modern high-wheat” was found, in which the western-type pattern was also related to fried-wheat and cakes61. Taken all together, it is clear that the regional tradition and availability of wheat in the North and rice in the South is still a main driver in Chinese’s food selection. It is interesting that wheat-patterns are more likely characterized by intake of more varied and western-type foods. Possibly, compared to rice, there is a wider range of foods that can be prepared with wheat, and a wider range of foods that can be accompanying a wheat-based food, therefore facilitating the incorporation of new foods among subjects used to consume wheat.
27
year apart (0.56 to 0.77). In studies with 4 or 10 years apart in England53 and Sweden29, correlation coefficients have been found to be around 0.30 to 0.52. The correlation
coefficients in these studies, might not be directly comparable to ours because they, instead of applied, used natural scores (scores from each point in time are calculated from the loadings of the pattern specific to each point in time); however, previous studies using both applied and natural scores, have found very similar correlation coefficients27,53. This means that relative to dietary patterns in other countries, the traditional southern pattern is China is very stable and well defined, and subjects that have high scores at present are expected to maintain their high scores for a long period. However, it is noteworthy that the tracking in the traditional southern pattern decreased over time, between 1991 and 1993 the correlation coefficient was 0.79, whereas in more recent years, between a similar 2 or 3 years interval the correlations were lower (0.71 for 2004-2006 and 0.67 for 2006-2009), reflecting that with time, subjects might be losing their stable intake of this pattern.
28
increase the amount consumed of these food groups. In our results we found that in comparison with the traditional southern pattern, the modern high-wheat had a higher increase over time, and that even after adjusting by number of food groups consumed, the modern high-wheat pattern showed an upward trend. A clear illustration of this trend is the remarkable changes in the diets of those following this pattern (subjects with scores in the highest quartile of their year); although the increase in food groups such as fruits and soy-milk is beneficial, the sharp increase in items like cakes/cookies/pastries, deep-fried wheat or instant noodles is worrisome. In addition, it is of public health importance that with time, this pattern seems to be becoming more available to all urban/rural, income, and education groups.
The key strength of our study is the several repeated measures of diet in the same subjects, which allows us to assess for the first time the stability and tracking of dietary patterns in the Chinese population. Even though there were changes in our sample because not all the subjects had the 7 waves of diet complete, we believe our comparisons between years were not affected by this, not only because all subjects were present for at least three waves but also because we adjusted all of our results by age and geographical region.
A limitation in our study was that the diet measurement only captured three
29
were not able to include these in our factor analysis. Therefore, we do not exclude the possibility that a new, separate western pattern emerged within the studied period, and we were not able to identify it.
In line with this, another important limitation common to all countries, is that the number of foods available in the food supply exceeds by far the number of those available in food composition tables. In the US for example, there are over 85,000 uniquely formulated products in the food system, whereas national food composition tables only have around 7,600 unique foods65. China has the world’s fastest growth in supermarkets66, and our survey, because of the inability to keep up with the rapidly changing food supply landscape, is unable to capture all the changes in intake, particularly of processed packaged foods. In addition, our dietary assessment, focuses on the measurement of foods at the ingredient and not at the dish level, this is very advantageous because recipes vary considerably between households10 and few mixed dishes are available in the Chinese food composition table, however we miss this important behavioral aspect of diet, and important changes in dish selection might be going on.
30
31 Tables and Figures
Table 3.1 General characteristics of study sample by wave*
1991 1993 1997 2000 2004 2006 2009
N 5521 5732 6702 7410 6831 6488 5658
Mean Age in 1991, years 37.3 36.8 35.0 33.5 32.2 31.7 30.7
Geographical region†, %
North 9.6 9.3 9.9 19.7 21.5 22.1 21.9
Central 37.2 37.4 36.9 33.4 32.8 32.9 33.1
South 53.2 53.3 53.1 46.9 45.7 45.0 45.0
Male, % 50.2 49.8 49.7 49.1 48.5 47.8 48.3
Overweight (BMI ≥23 kg/m2 67
), % 32.9 35.4 43.2 50.6 52.4 54.3 56.7
Education, %
None 25.5 24.0 23.7 20.0 18.0 23.1 24.4
Primary school 23.7 23.7 24.7 24.4 25.8 20.1 21.9
≥Lower middle school 50.8 52.1 51.3 55.2 56.0 56.6 53.6
Income‡, %
Low 87.8 82.2 74.5 63.6 56.0 50.5 33.6
Medium 7.5 13.0 19.8 27.9 28.9 30.2 33.2
High 0.6 1.2 2.5 5.9 14.2 18.6 33.4
Urbanicity §, %
Low 72.8 67.9 57.6 49.3 45.9 40.7 32.7
Medium 25.2 30.6 32.1 26.6 22.7 27.0 34.0
High 2.1 1.5 10.4 24.1 31.5 32.3 33.3
Currently smoking, %
Females 3.1 3.5 3.8 3.3 3.2 2.9 3.3
Males 69.8 67.9 64.5 63.6 60.8 58.5 58.6
Alcohol intake ≥3 times/week, %
Females 1.7 2.1 2.9 2.7 1.9 1.9 2.4
Males 25.6 29.9 30.2 32.1 31.9 31.7 31.7
*All variables (except age in 1991 and geographical region) are adjusted by age in 1991 and geographical
region.
†Estimated from per capita household income inflated to 2009, categories based on cutoff values of tertiles in
2009.
‡North: Heilongjiang and Liaoning provinces; Central: Shandong, Henan and Jiangsu; South: Hubei,
Guizhou, Hunan and Guangxi.
§ Estimated from urbanicity index, a multicomponent scale that considers population density, economic
32
Table 3.2 Mean energy intake, number of food groups consumed and percentage of consumers for different food groups by wave*
1991 1993 1997 2000 2004 2006 2009
Energy, kJ/day† 6586 6548 6431 6607 6623 6745 6853
Number of food groups consumed, (min, max)
7.2 (1, 19) 7.5 (2, 19) 7.9 (2, 21) 8.2 (2, 19) 8.7 (2, 20) 9.1 (2, 22) 9.8 (2, 21) Percentage of consumers, %
Rice 84 84 87 88 87 87 90
Wheat noodles 23 32 38 42 47 54 55
Wheat flour 51 42 40 41 36 28 25
Wheat buns, breads 3 12 13 15 28 34 37
Cakes, cookies and pastries 3 4 3 3 6 8 8
Deep-fried wheat 6 8 7 8 12 14 15
Corn and coarse grains 21 23 22 22 24 23 26
Starchy roots and tubers 41 39 41 37 44 45 50
Fresh legumes 38 37 41 47 47 54 53
Dried legumes 14 14 13 12 13 12 12
Legume products 41 41 50 49 50 49 54
Nuts and seeds 8 6 8 9 9 8 11
Starchy roots and tubers
products 9 9 11 11 11 8 9
Fresh vegetables, non-leafy 75 77 76 83 84 87 90
Fresh vegetables, leafy 86 87 87 86 88 83 85
Pickled, salted or canned
vegetables 30 32 26 25 22 22 23
Dried vegetables 9 11 9 9 7 8 10
Fruits 11 10 12 11 17 23 32
Low-fat red meat 6 9 7 7 4 3 4
High-fat red meat 4 5 8 8 12 13 10
Low-fat pork 9 11 11 10 12 12 13
High-fat pork 55 57 57 64 64 69 73
Organ meats 9 9 9 10 9 8 10
Poultry and game 11 12 16 18 18 18 24
Eggs and eggs products 34 32 49 51 53 59 64
Fish and seafood 32 32 34 34 36 37 42
Soy milk 2 2 2 4 5 10 12
Animal-based milk 1 1 1 3 7 6 5
Instant noodles and frozen
dumplings 0 0 2 2 4 12 15
*All variables are adjusted by age in 1991 and region, food groups with ≤5% of consumers in all waves not
shown.
33 Table 3.3 Exploratory Factor Analysis at each wave*
Traditional southern dietary pattern Modern high-wheat dietary pattern
1991 1993 1997 2000 2004 2006 2009 1991 1993 1997 2000 2004 2006 2009
Rice 0.87 0.87 0.73 0.56 0.76 0.64 0.50 ─ -0.25 -0.25 -0.41 -0.20 -0.28 -0.30
Wheat noodles 0.30 0.27 0.28 ─ ─ ─ ─ ─ ─ ─ ─ ─ ─ -0.22
Wheat flour -0.80 -0.82 -0.86 -0.66 -0.59 -0.67 -0.50 ─ ─ ─ 0.26 ─ ─ ─
Wheat buns, breads ─ ─ -0.30 -0.27 -0.53 -0.44 -0.49 0.33 0.40 0.39 0.40 0.37 0.48 0.45
Cakes, cookies and
pastries ─ ─ ─ ─ ─ ─ ─ 0.31 0.48 0.53 0.51 0.57 0.53 0.41
Deep-fried wheat ─ -0.28 ─ ─ -0.37 ─ ─ 0.46 0.70 0.57 0.71 0.63 0.76 0.74
Corn and coarse grain -0.84 -0.78 -0.76 -0.65 -0.64 -0.53 -0.35 ─ ─ ─ 0.28 ─ ─ 0.28
Starchy roots and tubers ─ ─ ─ ─ ─ ─ -0.27 ─ ─ ─ ─ ─ 0.20 ─
Fresh legumes ─ ─ ─ ─ ─ ─ -0.20 ─ ─ ─ ─ ─ 0.20 ─
Dried legumes ─ ─ ─ ─ ─ ─ 0.23 ─ ─ ─ ─ ─ ─ ─
Legume products ─ ─ ─ ─ ─ ─ ─ 0.24 ─ ─ ─ ─ ─ ─
Nuts and seeds ─ ─ ─ ─ ─ ─ 0.21 0.42 0.33 0.24 0.26 0.28 0.34 0.30
Starchy roots and tubers
products -0.30 ─ ─ ─ ─ ─ ─ 0.30 0.32 0.26 0.26 0.24 0.28 0.26
Fresh vegetables,
non-leafy ─ ─ ─ ─ ─ ─ ─ ─ ─ ─ ─ ─ ─ ─
Fresh vegetables, leafy 0.25 0.21 0.22 0.22 0.21 0.32 0.46 ─ ─ 0.23 ─ ─ ─ ─
Pickled, salted or canned
vegetables 0.28 ─ 0.21 0.25 ─ ─ ─ ─ ─ ─ ─ ─ ─ ─
Dried vegetables ─ ─ 0.21 ─ 0.31 0.24 0.33 ─ ─ 0.25 ─ 0.25 ─ ─
Fruits ─ ─ ─ ─ ─ ─ ─ 0.43 0.57 0.46 0.35 0.56 0.55 0.44
Low-fat red meat 0.31 0.50 0.40 0.48 0.33 0.47 0.38 0.40 0.25 0.28 0.20 ─ ─ ─
High-fat red meat ─ ─ ─ 0.24 ─ 0.28 0.27 0.37 0.37 0.46 0.24 0.36 0.22 0.29
Low-fat pork 0.32 0.40 0.26 0.32 0.49 0.30 0.35 0.25 0.30 ─ ─ ─ ─ ─
High-fat pork 0.32 0.36 0.44 0.48 0.27 0.34 0.43 0.49 0.34 0.44 0.25 0.32 ─ ─
Organ meats 0.40 0.49 0.39 0.53 0.32 0.43 0.48 0.45 0.32 0.46 0.24 0.37 ─ ─
Poultry and game 0.31 0.40 0.32 0.53 0.34 0.49 0.48 0.44 0.44 0.47 0.25 0.40 ─ ─
34
Eggs and eggs products ─ ─ ─ ─ ─ ─ ─ 0.48 0.45 0.42 0.38 0.39 0.37 0.30
Fish and seafood 0.34 0.39 0.37 0.48 0.45 0.46 0.43 0.44 0.33 0.41 ─ 0.34 0.26 0.24
Soy milk ─ ─ ─ ─ -0.27 ─ ─ 0.55 0.79 0.58 0.72 0.69 0.76 0.78
Animal-based milk ─ ─ ─ ─ ─ ─ ─ 0.64 0.68 0.56 0.58 0.67 0.53 0.49
Instant noodles and
frozen dumplings NA NA ─ ─ ─ ─ ─ NA NA 0.47 0.40 0.27 0.41 0.44
NA; not applicable
aLoadings >=0.30 are in bold numbers, loadings <0.20 not shown.
35
Table 3.4 Tracking of dietary patterns: Pearson correlation coefficients of factor scores between waves for traditional southern (lower diagonal) and modern high-wheat (upper diagonal).*
1991 1993 1997 2000 2004 2006 2009
1991 0.63 0.55 0.52 0.52 0.49 0.46
1993 0.80 0.61 0.56 0.57 0.52 0.48
1997 0.79 0.81 0.57 0.56 0.52 0.48
2000 0.73 0.76 0.76 0.56 0.53 0.48
2004 0.74 0.77 0.74 0.72 0.62 0.56
2006 0.73 0.76 0.72 0.70 0.72 0.59
2009 0.69 0.72 0.71 0.68 0.67 0.67
*Pearson correlation coefficients were estimated between all available subjects for each pair of waves, therefore
36
Table 3.5 Mean energy intake, number of food groups consumed and percentage of consumers for relevant food groups, among those in the 4th highest quartile of the factor score in each dietary pattern and year.*
Traditional southern Modern high-wheat
1991 2000 2009 1991 2000 2009
Energy, kJ/day† 6947 7272 7430 7158 7140 7667
Number of food groups consumed 8.4 9.4 10.7 9.1 10.9 12.9
Percentage of consumers, %
Rice 100 100 100 67 82 84
Wheat flour 9 7 4 82 61 35
Wheat buns, breads 3 5 15 7 33 67
Cakes, cookies and pastries 3 3 9 8 12 24
Deep-fried wheat 5 4 9 23 31 51
Corn and coarse grains 1 2 4 38 37 42
Nuts and seeds 10 12 16 17 17 22
Starchy roots and tubers products 6 11 7 21 19 16
Fresh vegetables, leafy 97 95 96 87 88 88
Fruits 13 19 40 25 26 55
Low-fat red meat 16 19 9 9 12 6
High-fat red meat 5 15 18 9 16 18
Low-fat pork 18 20 24 8 11 15
High-fat pork 87 91 93 75 82 83
Organ meats 27 29 25 13 19 14
Poultry and game 30 44 50 18 31 33
Eggs and eggs products 37 55 64 57 77 83
Fish and seafood 60 65 68 42 48 56
Soy milk 1 2 8 6 15 44
Animal-based milk 2 3 7 4 11 18
Instant noodles and frozen dumplings 0 2 14 0 8 36
* All variables are adjusted by age in 1991 and region, numbers in bold are for relevant food groups in each dietary pattern (loadings ≥0.20 in all waves), food groups not relevant for any dietary pattern are not shown.
37
Table 3.6 Factor score differences by sample characteristics in each wave
Traditional southern Modern high-wheat
1991 2000 2009 1991 2000 2009
Age in 1991, 10 years increment 0.01 -0.02* -0.04* 0.02* 0.01 -0.02
Region
Central vs. South -1.07* -0.83* -0.77* 0.61* 0.72* 0.67*
North vs. South -0.85* -0.78* -0.65* 0.60* 0.38* 0.60*
Male vs. female 0.03 0.07* 0.05* -0.07* -0.06* -0.08*
Education
Primary school vs. none 0.13* 0.11* 0.06* 0.11* 0.08* 0.06*
≥Lower middle school vs. none 0.15* 0.09* 0.04 0.23* 0.20* 0.19*
Income
Medium vs. Low 0.27* 0.24* 0.11* 0.06* 0.11* 0.05
High vs. Low 0.17 0.35* 0.22* 0.22* 0.18* 0.18*
Urbanicity
Medium vs. Low 0.26* 0.24* 0.20* 0.49* 0.38* 0.38*
High vs. Low 0.08 0.45* 0.43* 0.78* 0.61* 0.72*
Smoking vs. non-smoking -0.05 -0.03 0.02 0.02 -0.01 0.01
Alcohol intake
≥3 times/wk vs. <3 times/wk 0.16* 0.08* 0.06* 0.08* 0.10* 0.06*
N 4,785 6,172 5,553 4,785 6,172 5,553
Score mean -0.14 0.00 0.11 -0.18 0.06 0.49
Score range (min, max) -2.3, 2.4 -2.4, 2.3 -2.5, 2.2 -1.5, 2.3 -1.6, 2.6 -1.6, 3.0
Standard deviation 0.90 0.80 0.68 0.69 0.73 0.81
38
Supplemental Table 3.1 Examples of food items for each food group.
Food group Examples of food items
Rice White and brown rice
Wheat noodles Wheat noodles
Wheat flour Wheat flour
Wheat buns, breads Bun, butter bread, salty bread
Cakes, cookies and pastries Cookies, mooncake, fruit cake, chocolate cake, fruit pie
Deep-fried wheat Deep-fried dough stick, deep-fried cake with red bean paste and sugar, deep-fried sweet sesame seed ball
Deep-fried rice and legumes Deep-fried rice flour doughnut, deep-fried soybean, deep-fried broad bean
Corn and coarse grain Corn, corn grits, corn flour, barley, oats, foxtail millet, sorghum Starchy roots and tubers Potato, yam, taro, lotus root, water chestnut, cassava, sweet potato
Fresh legumes Soybean sprouts, peas with pod, mung bean sprouts
Dried legumes Soybean flour, dried beans, beans flour, roasted broad bean
Legume products Tofu, tofu products, red/mung bean paste
Nuts and seeds Sesame, sunflower, watermelon seeds, lotus seeds, peanuts, walnuts, almonds, hazelnuts, pine-nuts, pistachios, cashew nuts
Starchy roots products and
tubers products Potato starch, lotus root starch, potato flour, corn starch, starch Fresh vegetables, non-leafy Cauliflower, tomatoes, cucumber, zucchini, mushrooms Fresh vegetables, leafy Spinach, ‘bok choy’, cabbage
Pickled, salted or canned
vegetables Canned tomato sauce, preserved vegetables, vegetables in soy sauce
Dried vegetables Dried radish, dried bamboo shoot, dried lily
Seaweed Fresh or dried seaweed
Fruits Fresh and canned (no added sugar) fruits
Dried fruit Dates, dried longan, raisins
Preserved fruit with added
sugar Dried and canned fruit with added sugar
Low-fat red meat Low-fat beef, low-fat lamb, donkey, rabbit
High-fat red meat High-fat beef, high-fat lamb
Low-fat pork Pork tenderloin pork, pork tendons
High-fat pork Pork belly, leg, rib chop
Organ meats Liver, kidney, large intestine, blood
Processed meats Sausages, ham, luncheon meat, dried meat, smoked meat
Poultry and game Chicken, duck, goose
Eggs and eggs products Whole eggs, yolk, white, preserved eggs Fish and seafood Fresh- and salt-water fish, dried fish, shellfish
Soy milk Sweetened and un-sweetened soy milk
Animal-based milk Cow milk, goat milk, skim milk, flavored milk
39
Sweetened dairy products Ice cream
Western-style fast-food Fried chicken, sandwich, hamburger, hotdog, pizza Instant noodles and frozen
dumplings Instant noodles, frozen dumplings
Ready-to-eat cereals/porridge Instant multigrain porridge, corn flakes, instant oatmeal
Salty snacks Corn crisps, onion rings, potato chips,
Candy, sugar and other
high-sugar foods Jelly, jam, chocolate, honey, sugar, candies
Calorically-sweetened
beverages Fruit or flavored drinks, fruit juice, soft drinks
Low-caloric beverages Tea, bottled water
40 Figure 3.1 Mean factor scores over time.
41
Chapter 4. Using both Principal Component Analysis and Reduced Rank Regression to Study Dietary Patterns and Diabetes in Chinese Adults.
Overview
Diabetes is increasing in China and few studies have evaluated how dietary patterns relate to this disease in this population. We used the strengths of both Principal Component Analysis (PCA), to identify the eating patterns of the population; and Reduced Rank
Regression (RRR), to derive a pattern that explained the variation in HbA1c, HOMA-IR and fasting glucose. We included 4,316 adults from the China Health and Nutrition Survey. Diet was measured over a 3-day period with 24-hr recalls and a household food inventory in 2006, and used to create dietary pattern scores using PCA and RRR. The outcomes were measured in 2009. The adjusted Odds Ratio for diabetes prevalence (HbA1c ≥6.5%), comparing the highest versus the lowest dietary pattern score quartile was 1.26 (0.76, 2.08) for a modern high-wheat pattern (from PCA, wheat products, fruits, eggs, milk and instant noodles/frozen dumpling), 0.76 (0.49, 1.17) for a traditional southern pattern (from PCA, rice, meat, poultry and fish) and 2.37 (1.56, 3.60) for the pattern derived with RRR pattern. By comparing the dietary pattern structure of RRR and PCA, we found that the RRR pattern was also
42 Introduction
Type 2 diabetes in China has been dramatically increasing over the last decades. Among adults, diabetes prevalence was 3%69 in 1994 and 10% in 2007-08.42 It is known that diet plays a key role in the prevention of diabetes, and attention has been devoted to
understand which aspects of diet have the largest potential in helping prevent this disease.70-72 The range of research goes from particular nutrients and food groups to dietary patterns.
The study of dietary patterns is appealing because they are closer approximations to the dietary exposures actually experienced by the population, as people do not consume single nutrients or foods but a combination of these in their daily diets. A common way to select the foods that will be represented in a given dietary pattern is by using statistical methods such as factor or principal component analysis (PCA). These methods derive linear functions of foods that best explain the variation in the intake of many foods or food groups, hence the resulting patterns represent foods that are typically consumed together by the population.14,73 Although empirically derived dietary patterns are meaningful and describe the eating behavior of the population they might not be the most predictive of a disease. In contrast, Reduced Rank Regression (RRR) is similar to PCA in that is also a data reduction technique that determines linear functions of food groups, but the linear function of foods seeks to maximize the variation in outcome variables (e.g. disease related nutrients or biomarkers), and possibly explain only a moderate fraction of food groups variation.74
The strength of one method is the limitation of the other; PCA identifies patterns that have public health relevance because they describe the actual dietary patterns of the
43
associated with the outcome or response variables, which might not be the case for PCA patterns. Therefore both methods can complement each other and provide useful insights when compared side by side. For the PCA patterns, RRR patterns could help as a reference of the largest possible strength of association a data driven dietary pattern can have, which can help put in perspective the findings from PCA. On the contrary for the RRR, the PCA patterns can be a reference of which foods are eaten in combination, this can put in
perspective how behaviorally meaningful the RRR dietary patterns are. In addition, RRR can help generate hypotheses about which key food components of a pattern are related to
diabetes, and PCA can help identify whether these foods define the eating patterns of the population.
44 Methods
Study design and participants
We included participants of the China Health and Nutrition Survey (CHNS), an ongoing study with detailed income, employment, education, demographic, health, and diet information elsewhere.49 Briefly, the survey was designed to examine across space and time how economic and social changes are associated with a range of health behaviors. A
multistage, random cluster process was used to draw the sample in 9 provinces. Survey protocols, instruments, and the process for obtaining informed consent for this study were approved by the institutional review committees of the University of North Carolina at Chapel Hill (UNC-CH) and the Chinese Institute of Nutrition and Food Safety (INFS), China Center for Disease Control and Prevention. Participants provided their written, informed consent.
45
diagnosed with diabetes or taking diabetes medications because treatment might have affected their dietary intake and/or biomarkers of glucose homeostasis.
Measurement of variables
Dietary assessment and food grouping
The dietary assessment in the CHNS is a combination of three consecutive days of 24-hour recalls at the individual level and a food inventory at household level performed over the same three day period. The three consecutive days were randomly allocated to start from Monday to Sunday. For the food inventory, all available foods at the household (purchased, stored or home produced) were measured on daily basis with digital scales. The changes in the household food inventory as well as the wastage were used to estimate total household food consumption. For the 24-hour recall, trained interviewers recorded the types, amounts, type of meal and place of consumption of all food items consumed. The amount of each dish was estimated from the household food inventory, based on the proportion of each dished the person reported to have consumed.
The food groups included in our analysis were based on a food grouping system developed specifically for the CHNS by researchers from UNC-CH and INFS10 which separates foods into nutritional and behavioral meaningful food groups. For the dietary pattern analysis we did not include alcoholic beverages reported during three 24-hour recalls, because it was mostly consumed by males, with very low consumption for females.
46 Biomarkers
Blood samples were collected by venipuncture after an overnight fast. Glucose was measured on the serum with a glucose oxidase phenol 4-amnioantipyrine peroxidase kit (Randox, UK) in a Hitachi 7600 analyzer. HbA1c was measured on the whole blood by high-performance liquid chromatography with an automated glycohemoglobin analyzer (model HLC-723 G7; Tosoh, Tokyo, Japan). Insulin was measured on the serum by
radioimmunology in a Gamma counter XH-6020 analyzer. The homeostasis model of insulin resistance was estimated [HOMA-IR=(fasting insulin (μU/ml)* fasting glucose (mmol/l))/ 22.5].76
We present results for HbA1c and not for glucose, and define diabetes based on HbA1c ≥6.5%.77 Despite the controversies of using HbA1c as a diagnostic tool, it has the advantage over a single measure of glucose to capture long-term glycemic exposure.78 In addition, HbA1c correlates well with the risk of long-term diabetes complications and it has been shown to be a reliable method for diabetes diagnosis in Chinese population.79-81
Diabetes definition was only based on HbA1c because those on diabetes treatment or previously diagnosed were already excluded from the analyses.
Covariates
47
density, economic activity, transportation infrastructure, sanitation, housing types, etc.68 For all physical activity, income and urbanicity scale participants were classified into tertiles. BMI was estimated from measured weight and height; weight was measured without shoes in light clothing to the nearest 0.1 kg on a calibrated beam scale and height was measured also without shoes with a portable SECA stadiometer to the nearest 0.2 cm. Other demographic and lifestyle covariates included in the analysis were gender, age, geographical region (North, Central or South), education level, smoking status and alcohol intake.
Statistical analysis
Dietary patterns analysis was performed on 29 food groups. Most food groups had a high proportion of non-consumers; possibly due to the fact that diet intake was measured over a 3-day period. Therefore, for food groups with <80% of consumers we categorized food group intake into non-consumers vs. consumers and otherwise (rice, fresh non-leafy vegetables and fresh leafy vegetables) below vs. above the median. We divided the food groups for which the majority of the sample consumed as below or above median because there was little variation left in consumption vs. non-consumption. Food groups with ≤5% of consumers were not included in the dietary pattern analysis. For a full list of included and not included food groups, and their description see Supplemental Table 4.1.