The Interactive Effects of Nutrient and Salinity Regimes on Phytoplankton
Communities in the Chowan River Estuary, North Carolina
By
Felix Evans
Senior Honors Thesis
Environment, Ecology, and Energy Program
University of North Carolina at Chapel Hill
December 4
th, 2019
Approved:
Abstract
1. Introduction
1.1 Algal blooms
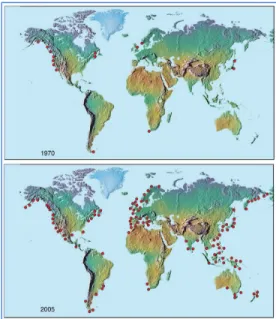
Algal blooms have become increasingly frequent in coastal and estuarine ecosystems worldwide in recent years. Algal blooms, or rapidly growing, ecosystem-destabilizing phytoplankton communities, are a potential threat from public health, ecosystem quality, and economic perspectives, as they can introduce toxins that are harmful to humans and aquatic organisms, create hypoxic “dead zones” that suffocate fish and bottom-dwelling biota, and negatively impact fishing and coastal tourism (Preece et. al., 2017; Anderson et. al. 2000). A global rise in harmful algal bloom (HAB) events in coastal and estuarine waters has occurred over the past several decades (Fig. 1; Anderson, 2017). Primary production is fundamental to all biotic spheres, and phytoplankton communities are integral to aquatic trophic webs. However, under certain environmental conditions, equilibrium destabilization can lead to
excessive primary production and subsequently the rapid proliferation of harmful algal blooms.
Figure 1. Occurrence of HAB events from 1970-2005. (Anderson, 2017) Phytoplankton are growth-limited by nutrient availability and salinity tolerance, among other interacting environmental factors. Key nutrients for phytoplankton growth include biologically-available nitrogen and phosphorus. The existing body of literature has explored salinity thresholds of various classes of phytoplankton to characterize phytoplankton in different estuarine zones, as well as community structure variations under nutrient limited conditions. Estuary-residing phytoplankton can exhibit a wide range of upper and lower salinity thresholds, with freshwater species tending to dominate upper estuaries and marine species found in lower estuaries where salinity is higher (Ahel et. al., 1996; Lionard et. al., 2005; Roubeix et. al., 2008). Historically, HAB mitigation efforts have focused on limiting phosphorus loads, as anthropogenic phosphorus sources are relatively easy to identify, and upstream freshwater systems have historically been shown to be P-limited (Paerl et. al., 2016). For example, after accelerated eutrophication in Lake Erie sparked concern, phosphorus maximum levels were implemented in the late 1980s and summer blooms largely declined (EPA, 2013). Yet phosphorus limitation is not a common state due to readily-available legacy phosphorus accumulated in sediments, and furthermore, under P-limited conditions, blooms of nitrogen-fixing phytoplankton (commonly cyanobacteria) can still form (Paerl et. al., 2016). These attributes warrant a more thorough understanding of the role of nitrogen in HAB formation, as well as the interaction between nutrient availability and other potentially growth-limiting geochemical characteristics such as salinity, and hydrologic conditions such as freshwater flushing.
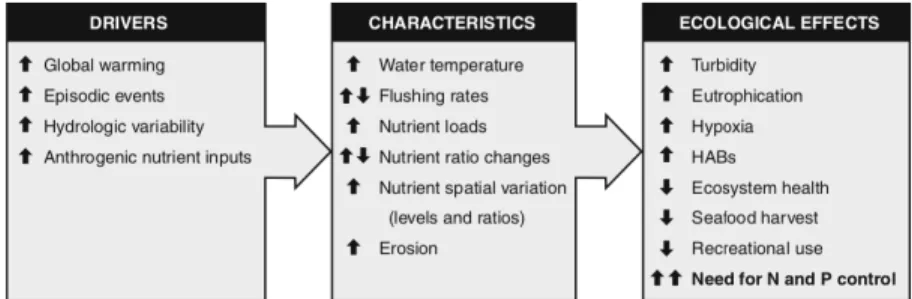
1.2 Hydrologic conditions are increasingly variable and extreme
Figure 2. Potential interactions among anthropogenic drivers, changes, and effects on estuarine and coastal ecology and resource use. (Paerl et. al., 2014)
HAB-favorable hydrologic conditions are furthermore directly facilitated by anthropogenic activities such as coastal- and watershed-adjacent development, which have been definitively associated with the eutrophication of lakes, rivers, and estuaries, leading to bloom formation along drainage basins and coastal zones (Fig. 1; Paerl et. al., 2018).
Coincident with a rise in HAB events, increased hydrologic variability and more frequent and intense episodic events have been observed worldwide. Estimates by the European Academies Science Advisory Council report that extreme hydrological events have quadrupled globally since 1980 (EASAC, 2018). Such events include floods, droughts, heavy storms, and natural disasters such as hurricanes. According to the Fourth US National Climate Assessment, “extreme precipitation events are projected to increase in a warming climate and may lead to more severe floods” (NCA4, 2018).
One near-ubiquitous change to coastal hydrology is sea level rise. Though exact projections vary, there is little doubt that sea level rise will impact a vast area of developed coastline in the coming decades (NOAA, 2019). Sea level rise puts areas above historical reference flood levels at risk of tidal inundation and storm surge, leading to saltwater intrusion and a landward shift in estuarine salinity fields which in turn affects phytoplankton spatial distribution (Chua and Xu, 2014).
Increased precipitation volume has been observed from cyclone and storm events for the past century. In coastal North Carolina, six of the seven highest precipitation events on record have occurred in the past 20 years (Paerl et. al., 2019). Meanwhile, drought severity in terms of persistence and area affected has increased, with the most persistent droughts on record in the Southwestern US occurring in the last decade (NOAA, 2013). The influence of hydrologically-extreme events on phytoplankton community dynamics is multifold: increased precipitation leading to the introduction of nutrient-rich runoff waters from inland agricultural and industrial areas contributes to eutrophication that stimulates algal blooms, while higher volumes of freshwater discharge in some regions and extended drought periods in others result in drastic changes to nutrient and salinity regimes throughout upper and lower estuary zones.
1.3 Rationale for study focus on Chowan River Estuary and research objectives
The site of one of the first large-scale HABs in North Carolina, the Chowan River Estuary (CRE) has been classified as Nutrient Sensitive Waters since 1979 (NCDEQ, 2002). After nearly three decades without HABs, the CRE has experienced a return of summer cyanobacterial blooms each year since 2015 (NCDEQ, 2019). The CRE is one of many environments that would benefit from the ability to predict and prevent HAB formation with an improved understanding of the role of nutrient limitation in controlling bloom magnitude and intensity. Therefore, the intention of this study is to determine nutrient limitation of phytoplankton in the Chowan River Estuary across seasonal hydrologic and salinity conditions. To accomplish this, two nutrient-salinity bioassays were conducted in consecutive bloom years and different seasons and observed the resulting growth and community composition of phytoplankton from the starting population. This was done in order to meet the following research objectives:
(1) Characterize the interactive effects of nutrient limitation and salinity conditions on phytoplankton community structure and production in Summer 2019.
(2) Compare two inter-seasonal bioassays to assess the role of nutrient limitation in phytoplankton production on a temporal basis.
In contributing to the body of research on phytoplankton community dynamics, this study is relevant in the context of climatically-altered nutrient and salinity baselines in coastal environments. These results will be useful in understanding the interactions of key hydrologic parameters and their role in promoting or inhibiting phytoplankton growth and production, particularly regarding efforts to improve water quality and protect human and ecosystem health by controlling the occurrence of HABs.
2. Methods
2.1 Study sites
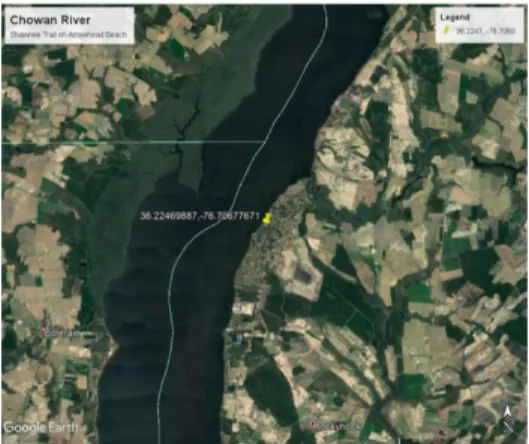
The Summer 2019 bioassay analysis of the Chowan River phytoplankton community nutrient limitation was
conducted using surface samples collected at the Shawnee Trail at Arrowhead Beach on the Chowan River in Edenton, North Carolina (Fig. 3). At this location, a Microcystis cyanobacterial bloom was reported on July 23rd, 2019, and
between this date and the sampling date July 27th, 2019, a
rain event occurred; however, the bloom was still plainly visible at sampling (NC DEQ Division of Water Resources Algal Bloom Report, 2019).
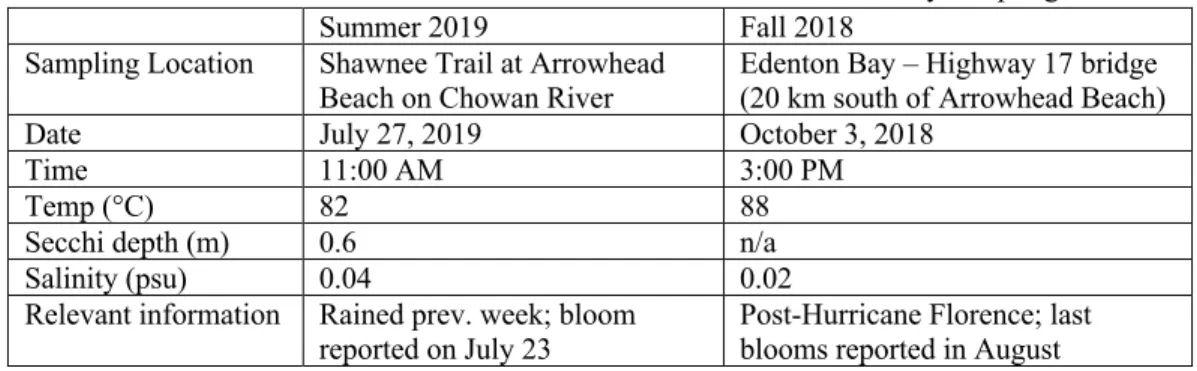
Field measurements from the sampling sites of the Summer 2019 bioassay and Fall 2018 bioassay are summarized in Table 1 in order to provide context for a temporal comparison. Results of the Summer 2019 bioassay will be reported in full, with Fall 2018 results reported on the basis of comparison. At the location of the Fall 2018 bioassay, a cyanobacterial HAB was reported in June 2018; however, while phytoplankton were still present, the bloom was not visible at the sampling site due to the precipitation and subsequent freshwater flushing from Hurricane Florence (NCDEQ DWR Algal Bloom Report, 2018).
Table 1. Field measurements from Summer 2019 and Fall 2018 bioassay sampling dates.
Summer 2019 Fall 2018
Sampling Location Shawnee Trail at Arrowhead
Beach on Chowan River Edenton Bay – Highway 17 bridge (20 km south of Arrowhead Beach)
Date July 27, 2019 October 3, 2018
Time 11:00 AM 3:00 PM
Temp (°C) 82 88
Secchi depth (m) 0.6 n/a
Salinity (psu) 0.04 0.02
Relevant information Rained prev. week; bloom
reported on July 23 Post-Hurricane Florence; last blooms reported in August
2.2 Bioassay experimental design
The experimental design was identical in both bioassays. The surface sample was collected in eight 19-Liter carboys and combined in a large tub. The sample was divided into 36 4-Liter Cubitainers®, comprising triplicate (3x) tests of 12 discrete treatments of salinity and nutrient ratios. The experimental time points were July 27th (T0), July 29th (T1), and August 1st (T2) 2019. T1 occurred after approximately
41 hours of incubation, and T2 occurred after approximately 113 total hours of incubation. These Cubitainers® were incubated in the outdoor experimental pond at the UNC Institute of Marine Sciences (IMS) over the duration of the experiment in order to represent ambient light and temperature conditions. Dissolved inorganic carbon (DIC) solution (6.3 mg C L-1 final concentration) was added to each sample
to prevent DIC-limitation. The 12 treatments are illustrated below (Fig. 4). The three salinity conditions included 0 psu, 2 psu, and 7 psu. These salinities were prepared by dissolving NaCl directly in the Cubitainers®. Within each salinity condition, 4 nutrient treatments were prepared in triplicate: a control treatment (C; no nutrients added), a nitrogen enriched treatment (N; 20-µM final concentration, addition of NO3- as potassium nitrate and NH4+ as ammonium chloride), a phosphorus enriched treatment (P;
2-µM final concentration, addition of PO43- as potassium dihydrogen phosphate), and a combined-nutrient
Figure 4. Diagram of bioassay salinity and nutrient treatments.
2.3 Analytical Methods
At each timepoint, subsamples of approximately 1L were collected from each Cubitainer®. At T0 and T2, the subsamples were analyzed for the following: dissolved inorganic nutrient (NO3-, NH4+, SiO2,
PO43-) concentrations, carbon-nitrogen (C:N) molar ratio analysis, Chlorophyll-a (chl-a) concentration,
diagnostic photopigment analysis by high performance liquid chromatography (HPLC), and identification by microscopy. At T1, only chl-a and HPLC analyses were performed. All reported results are the
average of 3 triplicates for each treatment.
3. Results
3.1 Dissolved Inorganic Nutrient Concentrations
Of the analyzed nutrients, significant results were most apparent in the concentrations of inorganic nitrogen and phosphate (Fig. 5). Inorganic nitrogen concentration was calculated based on the combined concentrations of ammonium and nitrate.
Figure 5.Top: Inorganic nitrogen concentration in each treatment at T0, T1, and T2. Bottom: Phosphate concentration in each treatment at T0, T1, and T2.
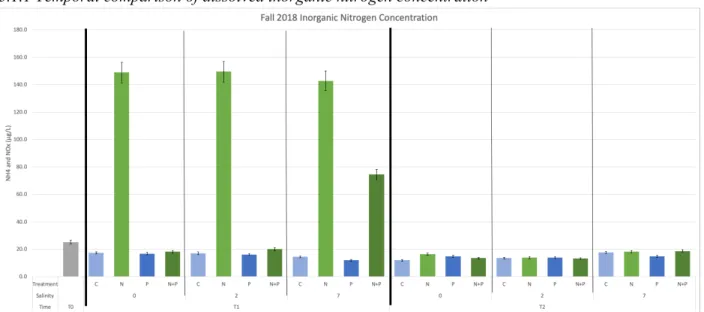
in all samples. Only at 7 psu was there remaining dissolved inorganic nitrogen, and only in the N and N+P treatments, indicating that higher nutrient uptake and growth occurred in the lower salinity conditions of the N+P treatment and that nearly all of the samples had become nitrogen limited.
The phosphate concentration was again significantly higher in the samples that received P enrichment; however, unlike inorganic nitrogen, none of the T2 samples were depleted of phosphorus. This suggested that the Chowan system is nitrogen limited. Little change in concentration occurred in the P-treatment over time, and variations in P-uptake only appeared where correlated with N-stimulated growth in N+P combined treatment. There was also a less noticeable significant difference in P
concentrations across salinities. These results suggest that in addition to nitrogen limitation, the samples were nearly entirely depleted of nitrogen by T2, which may have prevented optimal phytoplankton growth. In the T2 samples, available P increased with increasing salinity, indicating that production and net phytoplankton growth in the samples generally decreased with increasing salinity.
3.1.1 Temporal comparison of dissolved inorganic nitrogen concentration
Figure 6.Fall 2018 Inorganic nitrogen concentration in each treatment at T0, T1, and T2.
3.2 CHN Molar Ratio Analysis
The C:N molar ratio is indicative of the phytoplankton elemental composition. Specifically, a high C:N molar ratio indicates N-limitation. This analysis was done only on T2 samples. N-limitation was apparent by T2 at 0 and 2 psu across all nutrient treatments, and was slightly lower at 7 psu, possibly due to lower overall growth. The molar ratios also did not significantly change over time from T0 to T2. This may be due to the fact that the Chowan River Estuary is a nitrogen-limited system. The molar ratio values were typical for small-sized phytoplankton cells in a nitrogen-depleted system (Staehr et. al., 2002).
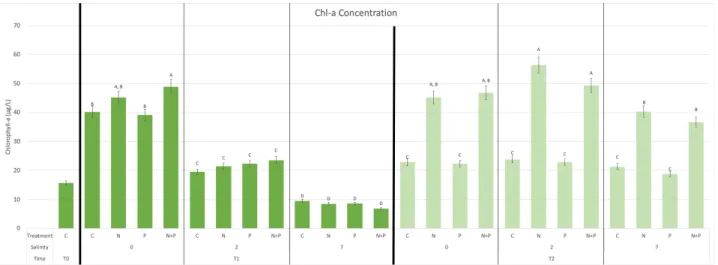
3.3 Chlorophyll-a Concentration
Chlorophyll-a is a pigment present in all photosynthetic organisms and is therefore a proxy for
phytoplankton biomass. At T1, nutrient additions had no significant effect on growth, whereas salinity deterred growth. With increasing salinity, chl-a concentration decreased. At T2, the opposite effect appeared: growth was dependent almost entirely on nutrient enrichment, not salinity. Advantages of nutrient enrichment, particularly nitrogen, were evident and could apparently increase salinity tolerance. N+P enrichment stimulation was not significant, with no significant difference between N enriched growth and N+P enriched growth (Fig. 7). Growth in P-enriched samples alone was no different from completely unenriched samples, indicating growth was controlled by nitrogen limitation.
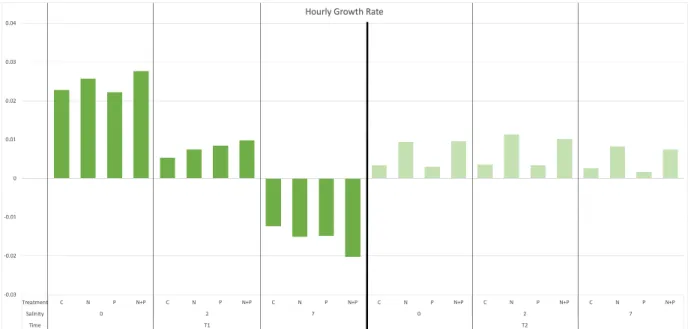
The changes in concentration of chlorophyll-a and length of incubation time were used to determine growth rates (Fig. 8) based on the equation:
P=P
0•e
-rt .Figure 8. Hourly phytoplankton growth rates based on change in chl-a concentration over time at T1 and T2.
While growth at T1 decreased markedly with salinity, growth at T2 was slight but positive, and shows N-enriched samples were favorable for growth. Nutrient treatment appears insignificant as a determinant of growth at T1 compared to salinity, and at 7 psu growth rate was negative. At T2, optimal growth occurred with N & N+P enriched treatments, and salinity was not an important determinant of growth.
3.4 Diagnostic Photopigment Analysis
HPLC assessment detected the presence of 6 primary photopigments: chlorophyll-a (total biomass indicator), zeaxanthin and myxoxanthophyll (cyanobacteria indicators), chlorophyll-B (green algae indicator), fucoxanthin (diatoms indicator), and alloxanthin (cryptophytes indicator) (Paerl et. al., 2014). As with chlorophyll-a (sec. 3.3), indicator pigment concentrations were used as proxies for biomass of each phytoplankton taxonomic class.
3.4.1 Phytoplankton growth rates
The growth rate based on change over time in each of the individual pigment concentrations followed a similar pattern as that determined in section 3.3 (Fig. 9). Growth rates at T1 represent change in
Figure 9. Hourly growth rate of each class of phytoplankton based on change in associated pigment concentration over time at T1 and T2. Total growth in each sample is illustrated by bar size, and relative growth of each phytoplankton class is illustrated by the magnitude of its associated color within the bar at each treatment.
General trends in Fig. 9 show that by T2, growth rates were lower in magnitude and more positive compared to T1. At T1, salinity determined growth more significantly than nutrient treatment. At T1, diatoms and cryptophytes exhibited negative growth at 2 psu, and at 7 psu, all classes except
cyanobacteria showed strongly negative growth, indicating salinity-deterred growth. Growth rates were weakly positive by T2, and nitrogen enrichment appeared to induce growth.
3.4.1.a Temporal comparison of phytoplankton growth rates
The growth rates in the Fall 2018 bioassay, shown overall per sample and color-classified by phytoplankton class in Fig. 10, exhibited a different pattern than that seen in Summer 2019 (Fig. 9). Whereas growth at T1 in Summer 2019 was determined almost entirely by salinity, the growth at T1 in Fall 2018 was nutrient-determined. The effects of nutrient limitation on growth are seen by T2 in Summer 2019, at which point nutrients were scarcer and salinity played a more minor role in growth limitation. Thus, a similar pattern can be observed across seasons: when nutrient stress is present in the environment, nutrient limitation becomes the more prevalent determinant of growth, while an abundance of nutrients (a condition seen only at the start of the Summer 2019 bioassay) gives way to salinity-controlled growth.
3.4.2 Chlorophyll-a analysis
Chlorophyll-a concentration as determined via HPLC was similar to that determined via fluorometry (sec. 3.3), contributing to the robustness of the results (Fig. 11).
Figure 11. Total biomass indicated by chlorophyll-a concentration in each treatment at T0, T1, and T2.
At T1, the concentration of chlorophyll-a was not significantly different across nutrient treatments, but did significantly decline with increasing salinity (Fig. 9). By T2, nutrient availability, specifically
3.4.2.a Temporal comparison of chlorophyll-a analysis
Figure 12. Fall 2018 total biomass indicated by chlorophyll-a concentration in each treatment at T0, T1, and T2.
Notable differences in chl-a concentrations between the two bioassays once again indicate different growth controls (Fig. 12). Whereas salinity determined T1 growth in Summer 2019, and nutrient-limitation became dominant by T2, growth in Fall 2018 appears predominantly dependent on nutrients, particularly nitrogen, with salinity only a minorly significant determinant factor.
3.4.3 Fucoxanthin and Alloxanthin analysis
Figure 13. Diatom biomass indicated by fucoxanthin concentration in each treatment at T0, T1, and T2.
3.4.4 Zeaxanthin and Myxoxanthophyll analysis
Cyanobacterial growth was indicated by two pigments: zeaxanthin and myxoxanthophyll. Zeaxanthin showed slightly higher salinity tolerance than either diatoms or cryptophytes (Fig. 15). Nutrient
determination of growth became clearer at T2, and N-enrichment spurred the greatest growth; however, at higher salinities, growth was slowed enough to be nearly insignificantly different across nutrient
treatments, so growth for cyanobacteria was jointly dictated by both nutrient availability and salinity.
Figure 15. Cyanobacteria biomass as indicated by zeaxanthin concentration in each treatment at T0, T1, and T2.
The pigment myxoxanthophyll is another indicator of cyanobacteria, which captures an overlapping subset of cyanobacteria species. While T1 growth was salinity-controlled, Myxoxanthophyll shows an interesting trend of successful N-enriched growth at 2 psu by T2, almost greater than T2 N-enriched growth at 0 psu (Fig. 16). This indicates a potential competitive advantage in nutrient uptake and salinity tolerance, particularly when enriched with nitrogen; but this tolerance declined at salinities of 7 psu.
3.4.5 Chlorophyll-b analysis
A different pattern emerged in the case of green algae, indicated by chlorophyll-b (Fig. 17). Again, the highest production occurred in the nitrogen-enriched treatments, and at T1, salinity limitations on growth were more significant than nutrient additions. But contrary to the general trend of salinity sensitivity seen for diatoms and cryptophytes, the highest growth of green algae occurred at 2 psu, and the lowest growth occurred at 0 psu. Green algae experienced the most growth at 7 psu of all phytoplankton classes. This may be an indication that green algae have a higher salinity tolerance, giving this class an advantage in terms of nutrient uptake to a certain extent.
4. Discussion
Results of the Summer 2019 bioassay and the inter-seasonal experimental comparison indicate the existence of seasonally-consistent nutrient availability trends. The CRE appears to be a nitrogen-limited system during the phytoplankton growth period. This is indicated by the significantly higher growth in the N-enriched treatments, a pattern observed in the chlorophyll-a fluorometric measurements as well as in HPLC photopigment analyses. It is further supported by the depletion of inorganic nitrogen within the timeframe of both bioassays and the correspondence of the bioassay C:N molar ratio values with those of known nitrogen-depleted phytoplankton. Phosphorus enrichment played a larger role in stimulating growth during Fall 2018; this experiment took place shortly after Hurricane Florence, and while precipitation events result in coastal eutrophication, the upstream sampling site of the Chowan River Estuary was likely flushed due to precipitation and thus oligotrophic by the time of sampling after the initial nutrient input from runoff. It is also important to note that over the short timeframe of the experiments, not all possibilities were able to be observed or analyzed, such as the potential for N2-fixing
cyanobacterial genera, stimulated by P additions, to become a significant part of the community and offset some demand for bioavailable nitrogen. However, in both bioassays, nitrogen remained the growth-limiting nutrient.
The salinity limitation on growth of phytoplankton was evident; overall growth occurred mostly at 0 psu and was hindered by salinities above 2 psu, with particular hindering effects on the growth of diatoms and cryptophytes. Green algae and cyanobacteria had higher resistance to higher salinity conditions, and this competitive advantage allowed these two classes to grow at a broader range of salinities. Within phytoplankton classes, various species have different salinity tolerance thresholds, resulting in potential changes to species composition within these classes and to the phytoplankton community structure as a whole; for example, freshwater diatoms and coastal diatoms have different salinity ranges and despite being of the same class, cannot typically survive in the environments of the other (Roubeix et. al., 2008). Species with more tolerance for broader ranges of salinities have a survival advantage as salinity fluctuates. However, in the CRE experiment, total phytoplankton biomass declined with increasing salinity. This is consistent with the freshwater preference of the CRE phytoplankton community, and indicates that the observed increasing salinity tolerance thresholds of certain classes may suggest future shifts in the total phytoplankton community towards species that are adapted for marine environments and can thus occupy downstream estuaries such as Albemarle Sound. Indeed, the salinity tolerance of phytoplankton influences their spatial distribution in estuaries (Lionard et. al., 2005). Coincident with the potential shift in CRE phytoplankton community composition towards salinity-tolerant species, changes to physical salinity regimes due to increasing global hydrologic variability may affect phytoplankton spatial ranges in unprecedented ways.
Growth is controlled dually by nutrient availability and salinity levels. The presence of abundant nutrients led to an emphasis on the role of salinity thresholds in limiting phytoplankton growth;
waters, potentially resulting in eutrophication and hypoxia (Peierls et. al., 2003), which enhances internal phosphorus release from sediments. A shift towards salinity-tolerant species of cyanobacteria suggests the potential for marine bloom-forming species of phytoplankton to become more dominant in systems higher in nutrients and salinity, which may become more common as increasing hydrologic variability drives changes to coastal and estuarine ecosystem equilibriums as a result of sea level rise, extended droughts, and increased nutrient inputs from higher-precipitation storms.
Ultimately, across seasons, years, and hydrologic conditions, it can be concluded that N and P enrichment from human activities in the vicinity of the Chowan River watershed may result in increased phytoplankton production. This is consistent with past bioassays on adjacent waters, and even globally; in the Neuse River Estuary, N+P enrichment and nitrogen-enrichment experiments resulted in the highest phytoplankton production (Paerl et. al., 1995), while a study of 20 whole-lake experiments also indicated that growth was most induced by N+P inputs (Paerl et. al., 2016). The Chowan River has been classified as Nutrient-Sensitive Waters (NSW) since 1979 by the North Carolina Division of Water Quality due to the occurrence of fish kills and algal blooms, frequently exceeding the state’s 40 µg L-1 chl-a standard
(Powell, 2018). The return of these bloom events in 2015 after decades of absence suggests a recent increase in eutrophication, and the continued introduction of nitrogen to the system clearly has the potential to spur growth of phytoplankton across hydrologic and salinity conditions. Blooms of phytoplankton and their associated ecosystem quality degradation may occur in areas not previously known for HAB formation as a result of eutrophication, changing salinity regimes, and adaptation of phytoplankton communities towards marine environments.
5. Conclusion
In light of shifting hydrologic paradigms influencing nutrient concentrations and salinity baselines in estuarine regions worldwide, predicting how specific changes will affect phytoplankton populations is vital for maintaining acceptable water quality and preventing habitat and ecosystem degradation. In the case of the CRE phytoplankton, nutrient availability continues to play a major role in driving or preventing phytoplankton growth in a variety of hydrologic and salinity conditions. Despite the role of salinity in deterring freshwater phytoplankton growth, a shift toward marine phytoplankton communities or salinity-tolerant species may occur coincident with shifting salinity baselines and
References
Ahel, M., R. G. Barlow, and R. F. C. Mantoura. 1996. Effect of Salinity Gradients on the Distribution of Phytoplankton Pigments in a Stratified Estuary. Marine Ecology Progress Series 143, no. 1/3: 289-95. http://www.jstor.org/stable/24857303.
Andersen, D.M. 2009. Approaches to Monitoring, Control and Management of Harmful Algal Blooms (HABs). Ocean and Coastal Management, Academic Press.
www.sciencedirect.com/science/article/pii/S0964569109000234?via%3Dihub.
Anderson, D.M. 2017. Distribution of HABs throughout the World. Woods Hole Oceanographic Institution, WHOI. www.whoi.edu/redtide/regions/world-distribution.
Anderson, D. M., Hoagland, Porter, Kaoru, Yoshi, White, and Alan W. 2009. Estimated annual economic impacts from harmful algal blooms (HABs) in the United States. DOI:10.1575/1912/96,
https://hdl.handle.net/1912/96
Bláha, Luděk, et al. 2009. Toxins Produced in Cyanobacterial Water Blooms - Toxicity and Risks. Economics and Culture, Sciendo. content.sciendo.com/view/journals/intox/2/2/article-p36.xml.
Calandrino, E. and H.W. Paerl. 2011. Determining the potential for the proliferation of the harmful cyanobacterium Cylindrospermopsis raciborskii in Currituck Sound, North Carolina. Harmful Algae 11:1-9.
Chua, V.P. and M. Xu. 2014. Impacts of sea-level rise on estuarine circulation: An idealized estuary and San Francisco Bay. Journal of Marine Systems, Volume 139, Pages 58-67, ISSN 0924-7963,
https://doi.org/10.1016/j.jmarsys.2014.05.012.
D'Anglada, Lesley. 2018. Cyanobacterial Harmful Algal Blooms in Water. Environmental Protection Agency, www.epa.gov/nutrient-policy-data/cyanobacterial-harmful-algal-blooms-water.
EPA. 2013. Ohio Lake Erie Phosphorus Task Force Final Report.
https://lakeerie.ohio.gov/Portals/0/Reports/Task_Force_Report_October_2013.pdf
European Academies' Science Advisory Council, Leopoldina - Nationale Akademie der Wissenschaften. 2018. New data confirm increased frequency of extreme weather events: European national science academies urge further action on climate change adaptation. ScienceDaily.
<www.sciencedaily.com/releases/2018/03/180321130859.htm>
Fensin, E. 2018. Division of Water Resources Algal Bloom Report. Albemarle Research Conservation and Development Council, NC Division of Water Quality.
www.albemarlercd.org/uploads/2/1/7/6/21765280/chowan_river_180828.pdf.
Fensin, E. 2019. Division of Water Resources Chowan River Algal Bloom Report. Albemarle Research Conservation and Development Council, NC Division of Water Quality.
Lall, U. 2018. Fourth National Climate Assessment: Chapter 3: Water. NCA4, US Global Change Research Program. nca2018.globalchange.gov/chapter/3/.
Lewitus, A. J., D.L. White, R.G. Tymowski, M.E. Geesey, S.N. Hymel and P.A. Noble. 2005. Adapting the CHEMTAX Method for Assessing Phytoplankton Taxonomic Composition in Southeastern U.S. Estuaries. Estuaries 28, no. 1:160-72. http://www.jstor.org/stable/3526944.
Lionard, M., K. Muylaert, D.V. Gansbeke and W. Vyverman. 2005. Influence of changes in salinity and light intensity on growth of phytoplankton communities from the Schelde river and estuary (Belgium/The Netherlands). Hydrobiologia Vol. 540-3:105-115. https://doi.org/10.1007/s10750-004-7123.
Mulholland, Patrick J., et al. 1998. Effects of Climate Change on Freshwater Ecosystems of the Southeastern United States and the Gulf Coast of Mexico. The Canadian Journal of Chemical Engineering, Wiley-Blackwell. onlinelibrary.wiley.com/doi/abs/10.1002/%28SICI%291099-1085%2819970630%2911%3A8%3C949%3A%3AAID-HYP513%3E3.0.CO%3B2-G.
NASA. 2010. What Are Phytoplankton? NASA Earth Observatory, NASA. earthobservatory.nasa.gov/features/Phytoplankton.
North Carolina Department of Environmental Quality. 2018. Fighting Algal Blooms. Albemarle Resource Conservation and Development Council, NC Division of Water Quality. www.albemarlercd.org/fighting-algal-blooms.html.
North Carolina Department of Environmental Quality. 2002. Summary of Water Quality Information for the Chowan River Basin. Division of Water Quality/Planning, NC Department of Environment and Natural Resources.
files.nc.gov/ncdeq/Water%20Quality/Planning/BPU/BPU/Chowan/Chowan%20Plans/2002%20Plan/CH O_SecA3.pdf.
North Carolina Department of Environmental Quality. 2019. Public cautioned to avoid toxin producing algal bloom in Chowan River. Press release. NC Department of Environment and Natural Resources.
NOAA (National Oceanic and Atmospheric Administration). 2012. State of the climate: Drought.
NOAA (National Oceanic and Atmospheric Administration). Sea Level Rise Viewer. 2019. https://coast.noaa.gov/slr/#
Paerl, H.W. 1982. Environmental factors promoting and regulating N2 fixing blue-green algal blooms in
the Chowan River, N.C. Univ. of North Carolina. Water Resources Research Institute Report No. 176.
Paerl, H.W., P.T. Bland, J.H. Blackwell and N.D. Bowles. 1984. The effects of salinity on the potential of a blue-green algal (Microcystis aeruginosa) bloom in the Neuse River Estuary, N.C. Institute of Marine Sciences. National Sea Grant Depository. UNC-SG-WP-84-1.
Paerl, H.W., M.A. Mallin, C. A. Donahue, M. Go and B. L. Peierls. 1995. Nitrogen loading sources and eutrophication of the Neuse River estuary, NC: Direct and indirect roles of atmospheric deposition. UNC Water Resources Research Institute Report No. 291.
Paerl, H.W., L.M. Valdes, M.F. Piehler and C. A. Stow. 2006. Assessing the effects of nutrient management in an estuary experiencing climatic change: The Neuse River Estuary, NC,
Paerl, H.W., L.M. Valdes, A.R. Joyner, B.L. Peierls, M.F. Piehler, S.R. Riggs, R.R. Christian, L.A. Eby, L.B. Crowder, J.S. Ramus, E.J. Clesceri, C.P. Buzzelli, and R.A. Luettich. 2006. Ecological response to hurricane events in the Pamlico Sound system, North Carolina, and implications for assessment and management in a regime of increased frequency. Estuaries and Coasts: 29: 1033-1045.
https://doi.org/10.1007/BF02798666.
Paerl, H.W. and J. Huisman. 2009. Climate Change: A Catalyst for Global Expansion of Harmful Cyanobacterial Blooms. Environmental Microbiology Reports, 1(1):27-37.
Paerl, H.W., K.L. Rossignol, N.S. Hall, B.L. Peierls and M.S. Wetz. 2010. Phytoplankton Community Indicators of Short- and Long-term Ecological Change in the Anthropogenically and Climatically Impacted Neuse River Estuary, North Carolina, USA. Estuaries and Coasts 33: 485-497.
Paerl H.W., H. Xu, N.S. Hall, G. Zhu, B. Qin, Y. Wu, K.L. Rossignol, L. Dong, M.J. McCarthy and A.R. Joyner. 2014. Controlling cyanobacterial blooms in hypertrophic Lake Taihu, China: will nitrogen reductions cause replacement of non-N2 fixing by N2 fixing taxa? PLoS One. 9(11):e113123. doi: 10.1371/journal.pone.0113123. PMID: 25405474; PMCID: PMC4236137.
Paerl, H.W., N.S. Hall, B.L. Peierls, and KL. Rossignol. 2014. Evolving paradigms and challenges in estuarine and coastal eutrophication dynamics in a culturally and climatically stressed world. Estuaries and Coasts 37(2): 243–258.
Paerl, H.W., N.S. Hall, B.L. Peierls, KL. Rossignol, and A.R. Joyner. 2014. Hydrologic Variability and Its Control of Phytoplankton Community Structure and Function in Two Shallow, Coastal, Lagoonal Ecosystems: The Neuse and New River Estuaries, North Carolina, USA. Estuaries and Coasts. 37(S1), 31-45, https://doi.org/10.1007/s12237-013-9686-0
Paerl, H. W., J.T. Scott, M.J. McCarthy, S.E. Newell, W.S. Gardner, K.E. Havens, D.K. Hoffman, S.W. Wilhelm and W.A. Wurtsbaugh. 2016. It takes two to tango: When and where dual nutrient (N & P) reductions are needed to protect lakes and downstream ecosystems. Environmental Science & Technology 50: 10805−10813.
Paerl, H.W., W.S. Gardner, K.E. Havens, A.R. Joyner, M.J. McCarthy, S.E. Newell, B. Qin and J.T. Scott. 2016. Mitigating cyanobacterial harmful algal blooms in aquatic ecosystems impacted by climate change and anthropogenic nutrients. Harmful Algae 54:213-222. ISSN 1568-9883,
https://doi.org/10.1016/j.hal.2015.09.009.
Paerl, H.W., T.G. Otten, and R. Kudela. 2018. Mitigating the expansion of harmful algal blooms across the freshwater-to-marine continuum. Environmental Science & Technology 52:5519-5529, DOI: 10.1021/acs.est.7b05950
Paerl, H.W., J.R. Crosswell, B. Van Dam, N.S. Hall, K.L. Rossignol, C.L. Osburn, A.G. Hounshell, R.S. Sloup, L.W. Harding. 2018. Two decades of tropical cyclone impacts on North Carolina’s estuarine carbon, nutrient and phytoplankton dynamics: implications for biogeochemical cycling and water quality in a stormier world. Biogeochemistry 141-3: 307. https://doi.org/10.1007/s10533-018-0438-x
Patel, K. and M. Carlowicz. 2018. A Broad View of Flooding in the Carolinas. NASA Earth Observatory, NASA, earthobservatory.nasa.gov/images/92786/a-broad-view-of-flooding-in-the-carolinas.
Paxinos, R. and J.G. Mitchell. 2000. A rapid Utermöhl method for estimating algal numbers. Journal of Plankton Research vol. 22-12:2255–2262. https://doi.org/10.1093/plankt/22.12.2255.
Peierls, B., R. Christian and H. Paerl. 2003. Water Quality and Phytoplankton as Indicators of Hurricane Impacts on a Large Estuarine Ecosystem. Estuaries, 26(5), 1329-1343.
http://www.jstor.org/stable/1353407
Piehler, M.F., L.J. Twomey, N.S. Hall and H.W. Paerl. 2004. Impacts of inorganic nutrient enrichment on the phytoplankton community structure and function in Pamlico Sound, NC USA. Estuarine, Coastal and Shelf Science. 61:197-207.
Powell, M. 2018. Wisely Conserving Natural Resources and Creating Opportunities for Positive Economic and Community Development. Albemarle RC&D, NC Division of Water Quality,
www.albemarlercd.org/uploads/2/1/7/6/21765280/arcd_ceeg_meeting_projects_8_25_2018_2_.pdf.
Roubeix, V., V. Rousseau and C. Lancelot. 2008. Diatom succession and silicon removal from freshwater in estuarine mixing zones: From experiment to modelling. Estuarine, Coastal and Shelf Science. Vol.78-1:14-26. ISSN 0272-7714. https://doi.org/10.1016/j.ecss.2007.11.007.
Rudek, J., H.W. Paerl, M.A. Mallin and P.W. Bates. 1991. Seasonal and hydrological control of phytoplankton nutrient limitation in the lower Neuse River Estuary, North Carolina. Mar. Ecol. Progr. Ser. 75:133-142.
Stal, L.J. 2015. Nitrogen Fixation in Cyanobacteria. eLS. John Wiley & Sons Ltd, Chichester. http://www.els.net [doi: 10.1002/9780470015902.a0021159.pub2]
Sauer, M.M. and E.J. Kuenzler. 1981. Algal Assay Studies of the Chowan River, North Carolina. Univ. of North Carolina at Chapel Hill Dept. of Environmental Sciences and Engineering. Water Resources Research Institute Report No. 161.
UNESCO/IOC Project office. 2010. What Are Harmful Algae? IOC Harmful Algal Bloom Programme, UNESCO, hab.ioc-unesco.org/index.php?option=com_content&view=article&id=5&Itemid=16.
Van den Hoek, C., D.G. Mann and H.M. Jahns. 1995. Algae: An Introduction to Phycology. Cambridge University Press, Cambridge. p.12-13.
Waal, D.B.V., A.M. Verschoor, J. M. H. Verspagen, E.V. Donk and J. Huisman. 2009. Climate‐driven changes in the ecological stoichiometry of aquatic ecosystems. Frontiers in Ecology and the Environment. doi:10.1890/080178.