EVALUATION OF BONE-TO-IMPLANT CONTACT AND BONE
DENSITY ADJACENT TO TITANIUM IMPLANTS USING A
STEREOLOGICAL TECHNIQUE ON GROUND SECTIONS
D
IMITRAB
ALATSOUKA1, K
LAUSG
OTFREDSEN1 ANDH
ANSJ
ØRGENG G
UNDERSEN21Department of Prosthetic Dentistry, School of Dentistry, Health Science Faculty, University of Copenhagen,
Nørre Allé 20, 2200 Copenhagen N, Denmark; 2Stereological Research Laboratory, Aarhus University Hospital, DK-8000 Aarhus C, Denmark.
e-mail: dbalatsouka@yahoo.com, klg@odont.ku.dk, stereohj@post.tele.dk (Accepted March 7, 2006)
ABSTRACT
When bone implants have to be examined in situ ground sections are required. Histomorphometric measurements are usually performed on two-dimensional sections, causing biased results when they are wrongly extrapolated to 3D without any knowledge of stereology. Unbiased results can only be obtained using stereological principles. The aim of the study was to describe an unbiased design for evaluating bone-to-implant contact (BIC) and peri-implant bone density (BD-i) in three-dimensions. The unbiased design was based on a fixed axis vertical random sampling technique. Three bone-implant blocks were collected from 3 rabbits. Four sections were obtained from each animal using a fixed axis vertical random sampling technique. The BIC was estimated by creating a stereological method based on a systematic test line set. The BD-i was estimated using a design based on a systematic point set. The efficiency of the systematic sampling was evaluated for each sampling level: Coefficient of error CE(
w
i) for the systematic test line set, CESyst between the 4 rotated sections, CENoise for the reproducibility. These variances were compared to the biological variation (CV) between animals. The mean CE(w
i) was 5 to 6%; the CESyst was 7.8% for the BIC estimates and 5.7% for the BD-i estimates; the CENoise was 5.8% for the BIC and 7.7% for the BD-i. The CV was 19% for the BIC estimates and 24% for the BD-i estimates. These results demonstrated that the stereological technique used in the present study was a very efficient method to obtain unbiased estimates of BIC and BD-i in 3D on 2D implant-bone sections.Keywords: efficiency, histomorphometric measurements, stereology, systematic sampling, vertical sections.
INTRODUCTION
Histological implant studies frequently use the definition of osseointegration as: “A direct, on the light microscopical level, contact between living bone and implant” (Albrektsson et al., 1981). Although this definition does not state the proportion of bone in contact with the implant surface, the fraction of surface areas of mineralized bone in contact with the implant surface (BIC), is one of the most used variables in histomorphometric analysis of implants (Albrektsson, 1988; Sennerby et al., 1991). Another most frequently used variable in histological implant studies is the peri-implant bone density (BD-i), which is the volume fraction of mineralized bone in a peri-implant area (Johansson, 1991; Ivanoff et al., 1997; Gotfredsen et al., 2001).
The BIC and BD-i measurements have traditionally been made on a few central ground sections cut in a
fixed orientation and parallel to the long axis of the implants (Gotfredsen et al., 1993; Ivanoff et al., 1997; Gotfredsen et al., 2001). In most studies a bucco-lingual direction has been selected (Rasmusson et al., 2001; Fini et al., 2002; Kolonidis et al., 2003). In other studies a mesio-distal direction has been chosen (Gotfredsen et al., 1993; Gotfredsen et al., 2001; Romanos et al., 2002) and examples of both mesio-distal and bucco-lingual direction are also present (Gotfredsen et al., 1991; Schou et al., 2003).
may have been biased, because the sampling methods have not fulfilled stereological principles. Stereology is a precise tool for obtaining quantitative information about 3-dimensional structures, based on observation made on 2-dimensional sections (Gundersen et al., 1988). Bone is an inhomogeneous and anisotropic structure and 2-dimensional histomorphometric methods should therefore include stereological principles to provide unbiased estimates for the 3-dimensional structure (Baddeley et al., 1986; Gundersen et al., 1988). The traditional methods for describing the BIC and the BD-i do not respect these principles of uniform sampling and biased results may occur, which result in erroneous conclusions.
Histomorphometric parameters like BIC and BD-i are defined in terms of the implant, which is an artificial structure of precisely known, constant dimensions. In order to obtain efficient and unbiased estimates of BIC and BD-i, it is important to plan the sampling method before processing and sectioning the specimens. Practical efficiency means to obtain an estimate with a low variability after spending a moderate amount of time and unbiased estimation means estimation without systematic deviation from the true value (Gundersen et al., 1988). Generally, to have unbiased estimates, sampling must be uniformly random, and to increase efficiency systematic sampling designs are recommended.
Using the "vertical sectioning" technique (Baddeley et al., 1986; Vesterby et al., 1987) these requirements have been respected (Overgaard, 2000; Overgaard et al., 2000; Rahbek, 2002). However, when BIC and BD-i measurements have to be performed on ground sections a "shadow effect" or underprojection occur on sections, where the cut is not close to the center axis (Fig. 1). Therefore, to reduce problems and the potential bias from the "shadow effect" the most central sections have usually been selected for BIC and BD-i measurements (Overgaard et al., 1999; Gotfredsen et al., 2000; Kolonidis et al., 2003). This means that only a few sections are available for the BIC and BD-i measurements, and the sampling is not uniformly random.
The above problems may, however, be solved using a fixed axis vertical random sampling technique and the "revolving door principle" (Cruz-Orive 1987; Cruz-Orive and Roberts 1993; Jensen and Gundersen 1993), in a design described below. This method offers a unique possibility to obtain robust and unbiased estimates of BIC and BD-i, respectively, in implant-bone specimens.
Fig. 1. The shadow effect. When a cut is made through the center axis of the implant (central section) the shadow effect (S) from the cervical curve is very small. When a cut is made in the periphery of the implant (peripheral section) the shadow effect is increased.
The aim of this study was to describe a stereo-logical design for estimating bone-to-implant contact (BIC) and peri-implant bone density (BD-i) on ground sections in three-dimensions. Note that ordinary vertical, uniformly random (VUR) sections must have uniformly random position. Coaxial sections, with a fixed (arbitrary) position of the axis, cannot in general provide unbiased estimates of surface area, nor will ordinary point counting provide unbiased estimates of volume.
MATERIALS AND METHODS
EXPERIMENTAL ANIMALS AND
IMPLANT PLACEMENT
Three bone-implant specimens were collected from 3 pilot female white New Zealand rabbits (SSc: CPH, Statens Serum Institute), weighing 3 to 4 kg and with an age of 9 to 12 months. Experimental screw-formed implants made of commercially pure titanium and with a TiO2-blasted surface (Astra Tech,
Mölndal, Sweden) were placed in the proximal part of the tibia. The implants had an outer diameter of 3.5 mm and were 6 mm in length, whereby only one cortical layer was engaged. After placing the implants, the fascia-periosteal parts of the flaps were closed with single resorbable sutures (Vicryl® 4-0, Ethicon, Norderstedt, Germany), while non-resorbable sutures (Prolene® 5-0, Ethicon) were used for the skin. Postoperatively, all animals received antibiotic treatment for 3 days (1.5 ml/day Streptocillin, Boehringer, Ingelheim, Copenhagen, Denmark A/S) and analgetic treatment for 1 day (0.5 ml/day Temgesic 0.3 mg/ml, Schering-Plough Europe, Brussels,
peripheral section
central section
Belgium) given as single intramuscular injections. The animals were sacrificed with an overdose of sodium pentobarbital (Pentobarbital, 200 mg/ml; The Royal Veterinary and Agricultural Pharmacy, Frederiksberg, Denmark; 2 ml per animal). The National Ethical Committee on Animal Experiments approved the study protocol (J. nr. 2001/561-421).
HISTOLOGY AND STEREOLOGY
The bone-implant specimens were osteotomised and immersed in 10% formalin. The specimens were dehydrated in graded series of ethanol and embedded in methyl methacrylate-based resin (Technovit 7200, Kulzer, Freidrichsdorf, Germany).
Each embedded bone-implant block was coded and rotated randomly around the vertical axis of the implant (Fig. 2a). The bone-implant blocks were then sectioned through the implant centre into four equal parts parallel to the long axis of the implant, which is a fixed vertical axis (Fig. 2a). This was accomplished using an X-ray-guided technique (Fig. 3a,b). When the vertical axis was identified for the rotated bone-implant block, the block was split into two halves and both of the halves were furthermore divided into two equal quarters using a diamond saw with a trail-width of 0.1 mm (Fig. 2a). Thereby 4 identical and separate specimens A, B, C and D were obtained (Fig. 2b). Each quarter was placed in embedding molds in such a way that the surface for sectioning was placed towards the bottom of the mold. Four central bone-implant sections of each bone-implant without "shadow effect" were then obtained. The 4 vertical sections were not taken at random and independently, but the first one was taken at random and the other three at right angles i.e. "revolving-door" principle. The sections were ground to a thickness of approximately 25 µm and stained with toluidin blue.
Stereological quantitation was performed in a darkened room using a Leica DMLB microscope (Leica Microscopy Systems Ltd, Heerbrugg, Switzerland) with a projection arm transmitting the section image perpendicularly to the table next to the microscope.
Fig. 2. A) The preparation procedure. The bone-implant block was randomly rotated and cut through the middle of the vertical axis. Each of the two half was re-embedded and cut through the middle into two quarters, which also was re-embedded before sections were taken according to b. B) After rotation the bone-implant block was split into four specimens and four central bone-implant sections were obtained.
A STEREOLOGICAL METHOD FOR
ESTIMATING ABSOLUTE SURFACE
AREAS AND BIC ON COAXIAL
SECTIONS
Design
Coaxial sections do normally not allow surface estimation of three-dimensional structures. However, the dental implant is a precisely known artefact with an unusual degree of regularity and symmetry making it possible not only to estimate volumes, as the BD-i around it, but also to estimate surfaces, as the BIC, in a very efficient way.
The surface areas of the implant and of the BIC were evaluated according to a new estimator for the surface area fraction, which at any point is:
1. at an observable and varying distance r from the axis of rotation, which in turn is identical to the fixed vertical axis of the stereological design (cf. Figs. 4 and 5).
2. everywhere perpendicular to the plane of the coaxial section, but has a varying and observable angle ά
with respect to the vertical axis, as shown in Fig. 5.
The amount of surface around the implant is at any point proportional with the distance r from the axis and with the cos ά, where ά is the angle between the surface profile and the vertical axis.
When the implant-bone surface is intersected by horizontal test lines, perpendicular to and randomly displaced along the axis of the implant (Fig. 4), each intersection point (Ii) represents a known amount of
3-dimensional surface area si:
i i
sin
d
s
α
π
1
r
·
2
·
·
i=
(1)where d is the constant distance between test lines and π/2 (90°) is the rotational sampling period (Figs. 4 and 5). The factor risignifies that the amount of
surface is directly proportional with the distance from the axis and the factor 1/sin αi (the angle between the
surface profile and the test line) compensates for the fact that the test lines only detect the projection of the surface onto the axis. Suffix i indicates that the variable depends on the position. Note that the equation is only valid when the fixed axis of the coaxial section coincides with that of the implant.
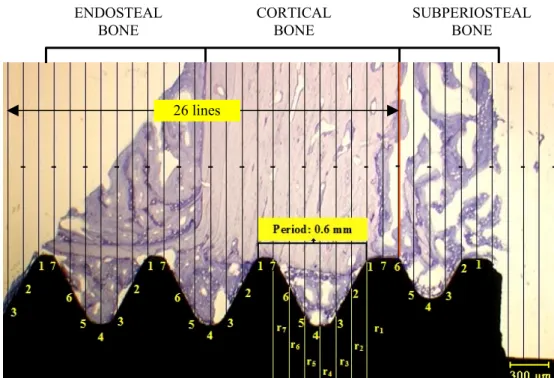
Fig. 4. A systematic test line orientated perpendicularly to the axis of the implant placed over one section. The axis of the implant is the lower edge of the image. One bone thread (period) was divided into 7 intervals, each represented by a numbered line (1, 2, 3, 4, 5, 6, 7). For each line the distance ri from the implant surface to the axis of the implant was observable. For each section, intersections with 26 lines were counted from the upper level of the cortical bone to half of the implant’s length.
26 lines ENDOSTEAL
BONE
CORTICAL BONE
The test system and its construction
For creating a systematic test line set appropriate for estimating surfaces in these coaxial sections, the distance from the top of the thread to the top of the next one (the thread period) was measured precisely. This determination was made on 12 sections, i.e., all four coaxial sections on three bone-implant specimens. The distance (period) between each implant thread was found to be 0.6 mm (Fig. 4). The surface estimation procedure was made much more efficient by constructing a set of numbered test lines for which d · c = length, where d is the constant distance between test lines; c was arbitrarily fixed at c = 7. In this way, each period was divided into 7 intervals by 7 test lines, placed uniformly randomly and perpendicular to the fixed axis of the implant (Fig. 4). For estimating the constants of the test system, each interval was furthermore arbitrarily divided into 3 subintervals (points) j = a, b, or c and for each midpoint of the subintervals the radius (rij) wasmeasured and divided with the sinus to the angle (αij)
(Fig. 5).
ij ij ij
sin
r
w
α
=
. (2)Always numbering the lines from the top of a thread, the value of wij of each subinterval (points)
varies very little for a given interval and treating the mean wiof each interval as a constant only introduces
a small variation, monitored by CE = SEM/mean, in the estimate, where SEM is the standard error of the mean.
The averaging was over the 3 subintervals j = a, b, or c in each interval:
ij c
j
a j
ij c j
a j i
sin
r
w
α
∑
∑
=
= =
=
=
. (3)For estimating the CE of the test line system itself, wi was determined in all sections for all
animals, giving a mean
w
i for each interval and the mean CE(w
i) was averaged over all seven intervals:( )
( )
7
7
7
∑
=
=
i ii
w
CE
w
meanCE
. (4)As shown in Table 1, the mean CE(
w
i) was 5 to 6 %, both for complete threads and for the first, incomplete thread. For all animals in the study the set of coefficientsw
i shown in Table1 were thus known constants for each test line, numbered from the top of a complete thread. Note the large variation ofw
i by a factor of almost 3 as a function of the position along the thread. By using the individual coefficients (instead of their global mean) in the estimationdescribed below, the estimates are unbiased under the (exactly fitting) stereological model of the implant surface. If the global mean is used, the estimates would be biased by e.g. a non-uniform distribution of BIC along the surface of the implant.
All previous measurements were made for the complete threads of the implant. For areas on the first incomplete thread, 7 individual interval values of
w
iwere calculated separately (Fig. 6, Table 1).
Table 1. Each period (thread) was evaluated using 7 test lines. Each line was characterized by its number (starting at the top of a thread).
w
i is the mean value of wi, averaged first over the four sections in each animal and then over the three animals. Mean CE (w
i) is an average over the 7 test lines.Surface area Complete threads Incomplete 1 st thread
Test line
w
i CE%w
i CE%1 2.59 4.2 2.24 8.4
2 3.69 5.4 3.32 5.1
3 2.71 4.6 3.01 4.1
4 1.45 1.5 1.53 2.8
5 3.08 8.6 2.66 3.3
6 3.95 2.2 3.76 6.3
7 2.35 8.9 2.44 6.2
mean CE (
w
i) 5.7 mean CE (w
i) 5.5BIC
ESTIMATED USING A
STEREOLOGICAL DESIGN ON
COAXIAL SECTIONS
The BIC was determined from the upper level of the cortical bone to half of the implant’s length (Fig. 4) at a final magnification of 72×. The half implant length was chosen to estimate BIC because it corresponds to the three best consecutive threads of the implant. The three best consequitive threads correspond to the cortical region of the tibia of the animal. In the tibial bone bed there is no cancellous bone in the marrow cavity in the region of the implants, which means that the last half length of the implant has no bone contact because no bone is growing there. A systematic test line orientated perpendicularly to the vertical axis of the implant was placed over the projected image of the 4 "revolving-door" sections (Fig. 4). For each section, intersections with 26 lines were counted (Fig. 4). Presence or absence of bone-to-implant contact was registered at all intersections between test lines and implant surface. The fractional area of mineralised bone in contact with the implant (BIC) was then estimated by the following equation:
[
]
[
]
∑
∑
=
i i i iw
)
Total
(
I
w
)
BIC
(
I
%
BIC
·
·
. (5)Where Ii(BIC) is the number of intersections with
the implant surface covered by minerilised bone and Ii (Total) is the total number of intersections with the
implant surface threads. The summation is over 26 test lines per section and 4 sections per specimen. The final CE of this estimator is dealt with below. The absolute surface area of BIC per implant may be estimated as:
(
BIC)
d[
Ii(
BIC)
wi]
S = ⋅ ⋅
∑
⋅2
π
, (6)
BD-i ESTIMATED USING A
STEREOLOGICAL DESIGN ON
COAXIAL SECTIONS.
Design
In histological implant studies, the bone density (BD-i) is usually defined as the fraction of mineralized bone in a peri-implant area. For threaded
implants the amount of bone between the implant threads has frequently been used as the area for BD-i 2D measurements (Johansson, 1991; Ivanoff et al., 1997). By obtaining coaxial sections unconditionally unbiased estimates of 3D bone density are provided and also a better delineation of the peri-implant regions because they are transversely sectioned. A new design was developed in order to obtain maximal efficiency for estimating bone volume factions.
Test system
A systematic point set was placed randomly over the bone-implant specimen but with the rows of points parallel to the vertical axis of the implant. The density of the systematic point set was chosen so as to provide 100-200 hits on 4 sections (Cruz-Orive and Weibel, 1990). Thus, 5 rows of points were counted in each bone thread (Fig. 7). Each point represented an area (ap), determined by the distance u, between 2 neighbouring points, corrected for magnification: ap = u2.
Estimation procedure
In the present study the bone density (BD-i) was estimated from the upper level of the cortical bone to half of the implant’s length, at a magnification of 146×.
The points (P) hitting the mineralized bone within the threads were counted and the distance (r) from the point to the vertical axis of the implant was measured (Miranov & Miranov 1998), (Fig. 7). The BD was determined by the following equation:
i i i Ti i i i Bi
r
P
r
P
BD
⋅
⋅
=
∑
∑
= = = = 5 1 5 1%
(7)where PB1, PB2, …PB5 are the points hitting bone at
distances r1, r2, …r5, and PT1, PT2, … PT5 are the total
number of points at distances r1, r2, …r5 (Fig. 7).
Fig. 7. A-systematic point set was randomly placed over the section, parallel to the axis and for each row of points the distance (r) from the row of points to the vertical axis of the implant was measured. The axis of the implant is the lower edge of the image.
VARIANCE AND REPRODUCIBILITY
OF THE MEASUREMENTS (S
2)
The real precision of BIC and BD-i measure-ments, given the section, was estimated empirically from replicated measurements of all sections in the 3 specimens (Table 2 and 3). As there were no systematic differences between the measurements made on two occasions, the variance due to
estimation (Noise), S2, given the sections, was
calculated using the formula:
S2 =
[
∑
d2]
/2n. (8)Where d is the difference between a pair of repeated measurements and n is the number of measured pairs. The CE was calculated as S/X, where X is the mean of the measurements.
Table 2. The coefficient of error for the reproducibility (CENoise) of Bone-to-Implant Contact (BIC) measurements, the CEsyst between rotated sections (3 bone/implant blocks sectioned into 4 specimens using the FAVER technique). The averaging of BIC is over the two replications on the same sections.
BIC%
Animal Section BIC1st BIC2nd Mean BIC CENoise % CESyst %
1 55.9 56.5 56.2
2 64.8 62.2 63.5
1
3 55.5 55.5 55.5 58.6 2.7 5.8
4 60.9 57.4 59.2
1 27.7 27.7 27.7
2 58.1 59.6 58.9
2
3 43.3 47.2 45.3 40.8 3.6 6.2
4 31.6 31.4 31.5
1 8.4 15.4 11.9
2 29.9 31.9 30.9
3
3 63.3 66.2 64.8 38.4 8.9 10.4
4 43.2 48.8 46.0
COEFFICIENT OF ERROR BETWEEN
SECTIONS (CE
SYST)
The average coefficient of error (CESyst) due to
the random rotation of the set of the 4 sections can be computed using the following equation (Gundersen et al., 1999):
[
]
∑
= =+
+
−
−
=
4 1 2 2)
4
/
240
(
3
i i i systf
S
C
B
S
A
CE
, (9)where S2 is the variance representing the "Noise" of
the measurements, described in the previous section, and mean measurement of the 4 sections are denoted
fi and
∑
==
n i if
A
1 2, 1 1 1 + − =∑
=
n ii i
f
f
B
, 22 1 + − =
∑
=
n ii i
f
f
C
.For the estimation of CESyst(BIC),S2 is the sum of the
above Noise and the variance from the test system, shown in Table 1 as a CE.
THE OBSERVED BIOLOGICAL
VARIATION (CV)
The observed biological variation is described by the coefficient of variation (CV = SD/mean) among specimens. As the number of animals in the pilot study was limited to only 3 the CE was compared with CV(BIC) and CV(BD-i) from the following experimental study including 16 animals (Balatsouka et al., 2005).
RESULTS
For BIC measurements done with the unbiased stereological design each intersection line was characterized with a mean weight or contribution (
w
i) and represented different values depending on the distance from the intersection point (Ii) to the axisof the implant and the angle between the line and the implant surface (Table 1). Thus, lines in the bottom of the implant threads, close to the implant axis, e.g. intersection line 4, represented a smaller surface area than lines hitting the implant at top of the implant thread. Lines hitting the surface obliquely, e.g., line 2 and 6, represented a greater surface area than lines hitting the surface more perpendicular, e.g., line 4 and 7 (Table 1). The mean CE (
w
i) of the test system was 5.5 to 5.7% (Table 1).The mean CENoise of the difference between the 2
sets of repeated estimates of BIC was 5.8%, close to, but above the CE (
w
i) contributed by the test system itself (Table 2). The mean CENoise of the differencebetween the 2 sets of repeated estimates for BD-i was 7.7% (Table 3). These percentages indicated that both methods turned out to be rather precise.
The biological variation (CV) between the 16 animals in further studies was 19% for the BIC estimates and 24% for the BD-i estimates.
For the BIC estimates the mean CESyst between
the rotated sections was 7.8% and for the BD-i estimates it was 5.7% (Tables 2 and 3).
Table 3. The coefficient of error for the reproducibility (CENoise) of peri-implant Bone Density (BD) measurements, the CESyst between sections rotated (3 bone-implant blocks sectioned into 4 specimens using the FAVER technique). The averaging of
BD
is over the two replications on the same sections.BD%
Animal 1.Section BD1st BD2nd Mean
BD
CENoise % CESyst%1 49.8 57.7 53.8
2 55.7 61.0 58.4
1
3 37.5 40.6 39.1 52.3 7.1 7.0
4 56.5 59.8 58.2
1 18.9 25.1 22.0
2 33.5 37.0 35.3
2 3 34.7 34.4 34.6 27.8 9.4 6.7
4 19.2 19.7 19.5
1 13.6 12.7 13.2
3 2 26.3 26.6 26.5
3 35.4 33.9 34.7 24.5 6.5 2.1
4 21.5 25.7 23.6
DISCUSSION
The stereological design used in the present study is the optimal way to obtain unbiased estimates of BIC and BD-i on bone-implant sections. The technique makes it possible to obtain unbiased and efficient estimates of BIC and BD-i from 4 randomly and systematically sampled 2D sections. The good efficiency of the coaxial sections stems from two effects in combination: systematic sampling of directions and systematic sampling of locations, by which the 4 sections explore the whole sampling universe around the implant in a favourable manner.
The mean CE (
w
i) represents the efficiency of our method. The low mean CE (w
i) values demonstrate that our method is very efficient (Gundersen et al., 1999). Compared to the biological variation between animals (CV), the CE (w
i) indicates that the sampling and estimation design is efficient and does only have a small effect on the variation of the final BIC and BD-i values.For unbiased estimation of bone to implant contact length (BIC) at the surface of screw-formed implants, intersections close to the implant axis represent smaller surface areas than more peripheral intersections and intersections hitting an oblique part of the screw implant represent a greater surface area than intersections hitting the implant perpendicular to the implant axis. For unbiased estimation of the bone density (BD-i) in the bone threads the points close to the implant surface (axis) represent a smaller volume than points in more peripheral locations. Thus, in the present study intersections hitting the surface at oblique parts close to the outer part of the thread represented a 2 to 3 times greater surface area than intersections hitting the surface perpendicular and in the bottom of the implant threads. This is in accordance with a three-dimensional evaluation and in contrast to a two-dimensional evaluation, where each line and point is given the same weight.
Careful planning of the sampling method before the specimens and sections are processed is mandatory for obtaining unbiased estimates of bone implant variables in research on bone implants (Overgaard et al., 2000). In the present study, substantial variations in BIC and BD-i were demonstrated between 4 sections from the same bone-implant block. This demonstrated that the values for BIC and BD-i may be quite dependent on the direction in which the bone/implant blocks are sectioned, which also have been indicated in histomorphometric studies using
two-dimensional analysis (Gotfredsen et al., 1991). This variance included variance from the counting procedure as well as true variance from section to section (Vesterby et al., 1987). In the present study the variation between rotated BIC sections contributed a CESyst of 7.8%. The variation between rotated BD-i
sections contributed a CESyst of 5.7%. The biological
variation for the BIC and the BD measurements found in the following experimental study (Balatsouka et al. 2005a) indicated that the precision of our method is very good and CE2
Syst was less than a fifth of CV2 for
both measurements. The moderate impact of the rather pronounced variation from section to section in the four sections is due to systematic sampling, which is superior to ordinary (independent) sampling (Gundersen et al. 1999). The ‘price’ one has to pay is that the estimation of the precision in systematic designs is much more complicated.
Applying the three dimensional vertical section method on anisotropic bone specimens, unbiased estimates of surface areas have been achieved (Baddeley et al., 1986; Vesterby et al., 1987). When bone-implant interfaces have to be evaluated on rotational symmetric implants the basic requirements for the vertical section method should be followed (Overgaard, 2000). When exhaustively cut serial sections of bone-implant specimens are produced a "shadow effect" will, however, occur at the peripheral sections (Johansson, 1991; Rahbek, 2002). To obtain uniformly, random and systematic cuts through a bone-implant block without any "shadow effect" the "revolving door" or fixed vertical random sectioning technique, described in the present paper, can be used. By this technique the specimen is rotated randomly around a vertical axis, which is defined as the long axis of the implant and cutting was performed after systematically rotating the specimen 90º. However, the sectioning technique was a technical challenge, where X-rays before cutting and re-embeddings were necessary. Thus, the technique was not only more difficult but also more time consuming and expensive compared to the serially cutting technique with a random rotation (ordinary vertical sections) (Gotfredsen et al., 1993).
by counting 100 to 200 points or intersections on 4 to 10 sections with an acceptable coefficient of error (Gundersen & Jensen 1987).
ACKNOWLEDGEMENTS
The study was supported with grants from the ITI Foundation for the Promotion of Oral Implantology, Switzerland and the FUT and Calcin Foundation (Danish Dental Association). We are grateful to Karen Biré for assistance in sectioning. We are also grateful to Mr George Anthis for his help in measuring the angles. We also want to acknowledge the help of the associate professor Jytte Overgaard (Department of Medical Anatomy, University of Copenhagen) for the use of her microscope for our stereological measurements.
REFERENCES
Albrektsson T, Brånemark PI, Hansson H, Lindström J (1981). Osseointegrated titanium implants. Requirements for ensuring a long-lasting, direct bone-to-implant anchorage in man. Acta Orthopaedica Scandinavica 52:155-70.
Albrektsson T (1988). A multicenter report on osseo-integrated oral implants. J Prosthet Dent60:75-84. Baddeley AJ, Gundersen HJG, Cruz-Orive LM (1986).
Estimation of surface area from vertical sections. J Microsc 142:259-76.
Balatsouka D, Gotfredsen K, Lindh CH, Berglundh T (2005). The impact of nicotine on bone healing and osseointegration. An experimental study in rabbits. Clin Oral Impl Res 16:268-76.
Cruz-Orive LM (1987). Stereology: recent solutions to old problems and a glimpse into the future. Proc. ICS VII Caen 1987. Acta Stereol6(III):3–18.
Cruz-Orive LM, Weibel ER (1990). Recent stereological methods for cell biology: a brief survey. A J Physiol 258:L148-56.
Cruz-Orive LM, Roberts N (1993). Unbiased volume estimation with coaxial sections: an application to the human bladder. J Microsc170:25–33.
Fini M, Gianluca G, Rimondini L, Giardino R (2002). Titanium Alloy Osseointegration in Cancellous and Cortical Bone of Ovariectomized Animals: Histomorpho-metric and Bone Hardness Measurements. Int J Oral Maxillofac Implants 17:28-37.
Gotfredsen K, Budtz-Jorgensen E, Jensen LN (1989). A method for preparing and staining histological sections containing titanium implants for light microscopy. Stain Technol 64:121-7.
Gotfredsen K, Rostrup E, Hjörting-Hansen E, Stoltze K, Jörgensen B (1991). Histological and histomorpho-metric evaluation of tissue reactions adjacent to endosteal implants in monkeys. Clin Oral Impl Res 2:30-7.
Gotfredsen K, Nimb L, Buser D, Hjørting-Hansen E (1993). Evaluation of guided bone regeneration around implants placed into fresh extraction sockets. An experimental study in dogs. Int J Oral Maxillofac Surg 51:879-84.
Gotfredsen K, Berghlund T, Lindhe J (2000). The anchorage of titanium implants with different surface characteristics. An experimental study in rabbits. Clin Impl Dent Rel Res 2:120-8.
Gotfredsen K, Berglundh, Lindhe J (2001). Bone reactions adjacent to titanium implants subjected to static load. A study in the dog (I). Clin Oral Impl Res 12:1-8. Gundersen HJG, Osterby R (1981). Optimizing sampling
efficiency of stereological studies in biology: or ‘do more less well’. J Microsc 121:65-73.
Gundersen HJ, Bendtsen TF, Korbo L, Marcussen N, Møller A, Nielsen K et al. (1988). Some new, simple and efficient stereologics methods and their use in pathological research and diagnosis. APMIS 96:379-94. Gundersen HJG, Jensen EB (1987). The efficiency of
systematic sampling in stereology and its prediction. J Microsc 147:229-63.
Gundersen HJG, Jensen EB, Kieu K, Nielsen J (1999). The efficiency of systematic sampling in stereology-reconsidered. J Microsc193:199-211.
Ivanoff CJ, Sennerby L, Johansson C, Rangert B, Lekholm U (1997). Influence of implant diameters on the integration of screw implants. An experimental study in rabbits. Int J Oral Maxillofac Surg 26:141-8. Jensen EBV, Gundersen HJG (1993). The rotator. J
Microsc170:35-44.
Johansson CB (1991). On tissue reactions to metal implants. PhD dissertation, Götenborg, Sweden, ISBN: 91-628-0223-2.
Kolonidis S, Renvert S, Hämmerle CHF, Lang N, Harris D, Claffey N (2003). Osseointegraion on implant surfaces previously conamnated with plaque. An experimental study in the dog. Clin Oral Impl Res 14:373-80.
Miranov JrAA, Miranov AA (1998). Estimation of subcellular organelle volume from ultra-thin sections through centrioles with a discretized version of the vertical rotator. J Microsc 192:29-36.
Overgaard S, Bromose U, Lind M, Bunger C, Soballe K (1999). The influence of crystallinity of the hydroxyapatite coating on the fixation of implants. Mechanical and histomorphometric results. J Bone Joint Surgery Br 81:725-31.
Overgaard S (2000). Calcium phosphate coatings for fixation of bone implants evaluated mechanically and histologically by stereological methods. PhD disser-tation. Acta Orthopaedica Scandinavica 71 (Suppl 297):1-74.
implants: Optimizing the stereological vertical-section design. J Orthop Res 18:313-21.
Rahbek O (2002). The influence of hydroxyapatite coating on the peri-implant migration of polyethylene particles. PhD dissertation, Aarhus, Denmark.
Rasmusson L, Kahnberg KE, Tan A (2001). Effects of Implant Design and Surface on Bone Regeneration and Implant Stability: An Experimental Study in the Dog Mandible. Clin Impl Dent and Rel Res 3:2-8.
Romanos GE, Toh CG, Siar CH, Swaminathan D (2002). Histologic and Histomorphometric Evaluation of Peri-implant Bone Subjected to Immediate Loading: An
Experimental Study with Macaca Fascicularis. Int J Oral Maxillofac Implants 17:44-51.
Schou S, Holmstrup P, Skovgaard LT, Hjørting-Hansen E, Gundersen HJG (2003). Autogenous bone graft and ePTFE membrane in the treatment of peri-implantitis. II. Stereologic and histologic observations in cynomolgus monkeys. Clin Oral Impl Res 14:404-11.
Sennerby L, Ericson LE, Thomsen P, Lekholm U, Åstrand P (1991). Structure of the bone-titanium interface in retri-eved clinical oral implants. Clin Oral Impl Res 2:103-11. Vesterby A, Kragstrup J, Gundersen HJG, Melsen F (1987).