388
All Rights Reserved © 2013 IJARCSEEEnhancing Information Retrieval using Concept-
Based Mining Model with Feature Extraction and
Clustering
Suresh S
#1, Shobana M
*2,
# Assistant Professor, Department of Computer Science & Engineering, MAR Engineering college, Trichirapalli, India, * Assistant Professor, Department of Computer Science & Engineering, Dhanalakshmi Srinivasan Engineering college,
Perambalur,India,
Abstract— Most of the common techniques in text mining are based on the statistical analysis of a term, either word or phrase. Statistical analysis of a term frequency captures the importance of the term within a document only. However, two terms can have the same frequency in their documents, but one term contributes more to the meaning of its sentences than the other term. Thus, the underlying text mining model should indicate terms that capture the semantics of text. In this case, the mining model can capture terms that present the concepts of the sentence, which leads to discovery of the topic of the document. Now a day‟s all the information‟s are available with clear diagrammatic explanation or with related images. An image examination method can automate the recognition of landmarks and events in large image collections, significantly getting better Content utilization experience. The wide adoption of photo sharing applications and the enormous amounts of user-generated content uploaded to them raises an information overload issue for users. The concept-based mining model can effectively discriminate between non important terms with respect to sentence semantics and terms which hold the concepts that represent the sentence meaning. The proposed mining model consists of sentence-based concept analysis, document-based concept analysis, corpus-based concept-analysis, and concept-based similarity measure. The term which contributes to the sentence semantics is analyzed on the sentence, document, and corpus levels rather than the traditional analysis of the document only. An Automated Content Organization technique to defeat such an overload is to collect images into groups based on their similarity and then use the derived clusters to support navigation and browsing of the collection. In this paper, we present a community detection (i.e. graph-based clustering) approach that makes use of both visual and tagging features of images in order to efficiently extract groups of correlated images within large image collections. We perform clustering on such image similarity graphs by means of community detection, a process that identifies on the graph groups of nodes that are more closely associated to each other. We categorize the resultant image clusters as landmarks or events by use of features related to the temporal, community, and label characteristics of image clusters.
Keywords— landmarks and events, Content Organization technique, similarity, clusters.
I. INTRODUCTION
Text mining attempts to discover new, previously unknown information by applying techniques from natural language processing and data mining. Clustering, one of the traditional data mining
techniques
is an unsupervised learning paradigm where clustering methods try to identify inherent groupings of the text documents, so that a set of clusters is produced in which clusters exhibit high intra clustersimilarity and low inter cluster similarity [1]. Generally, text document clustering methods attempt to segregate the documents into groups where each group represents some topic that is different than those topics represented by the other groups [2], [3], [4], [5].The proposed image clustering framework relies on the creation of two image graphs representing two kinds of similarity between space and enabling them to search by these annotations.
The rising popularity of photo sharing applications over the web has led to the generation of huge amounts of personal image collections. The lack of supporting mechanisms for efficient browsing, search and retrieval of content within them deteriorates considerably the overall image browsing experience and the user satisfaction. For that reason, a set of content navigation technologies, such as tagging, related image suggestion and clustering have become popular in such applications. Image clustering in particular is an extremely valuable feature for photo sharing sites, since it enables a top-down exploratory process during image browsing. At the same time, it improves user experience by (a) returning faster and more accurate results and (b) enabling organization of the personal content.
Each sentence is labeled by a semantic role labeler that determines the terms which contribute to the sentence semantics associated with their semantic roles in a sentence. Each term that has a semantic role in the sentence, is called a concept. Concepts can be either words or phrases and are totally dependent on the semantic structure of the sentence.
When a new document is introduced to the system, the proposed mining model can detect a concept match from this document to all the previously processed documents in the data set by scanning the new document and extracting the matching concepts.
389
All Rights Reserved © 2013 IJARCSEEtags present challenges when used in navigation. Tagging systems lack the hierarchical structure of expert designed taxonomies like the Dewey Decimal System [7].
The clustering results produced by the sentence-based, document-sentence-based, corpus-sentence-based, and the combined approach concept analysis have higher quality than those produced by a single-term analysis similarity only.Often, however, users may wish to move from one item to other items that are similar overall, but that differ in key characteristics. Tagging systems have become increasingly popular on the Web. Users of tagging systems create free-form descriptors of music images of the collection, i.e. based on their visual features and their tags, respectively. For the representation of the visual content of a given image, a set of local visual features are detected and a descriptor is extracted from their surrounding area.
II. BACKGROUND
Generally, the semantic structure of a sentence can be characterized by a form of verb argument structure. This underlying structure allows the creation of a composite meaning representation from the meanings of the individual concepts in a sentence. The verb argument structure permits a link between the arguments in the surface structures of the input text and their associated semantic roles.
Gildea and Jurafsky [8] were the first to apply a statistical learning technique to the FrameNet database. They presented a discriminative model for determining the most probable role for a constituent, given the frame, predicator, and other features. These probabilities, trained on the FrameNet database, depend on the verb, the head words of the constituents, the voice of the verb (active and passive), the syntactic category (S, NP, VP, PP, and so on), and the grammatical function (subject and object) of the constituent to be labeled. The authors tested their model on a prerelease version of the FrameNet I corpus with approximately 50,000 sentences and 67 frame types. Gildea and Jurafsky‟s model was trained by first using Collins‟ parser [9], and then deriving its features from the parsing, the original sentence, and the correct FrameNet annotation of that sentence.
Many efforts were based on a single aspect of images, either solely on their visual features[3] or on their textual descriptions[7]. Cai et al. were among the first to make use of multiple types of similarity between images, namely visual, text and hyperlink-based similarity. However, they combined the different image similarities in a cascaded scheme. Gao et al. [2] proposed a multi-objective optimization technique to simultaneously use both visual and text-based image similarities in the clustering process.
The main shortcoming of previous approaches is their reliance on complicated clustering schemes, such as spectral graph partitioning, that suffer from either or both of the following problems: (a) high computational and memory requirements and (b) need for setting the number of clusters as an algorithm parameter. Therefore, their applicability to large photo collections is rather limited. In our framework, we make use of community detection to efficiently identify clusters of images on an image similarity graph that is constructed based on both visual and tag features. The ground-breaking work of
Schmid and Mohr (1997) showed that invariant local feature matching could be extended to general image recognition problems in which a feature was matched against a large database of images. They also used Harris corners to select interest points, but rather than matching with a correlation window, they used a rotationally invariant descriptor of the local image region. This allowed features to be matched under arbitrary orientation change between the two images. The Harris corner detector is very sensitive to changes in image scale, so it does not provide a good basis for matching images of different sizes.
A machine learning algorithm for shallow semantic parsing was proposed in [9], [10], [11]. It is an extension of the work in [12]. Their algorithm is based on using Support Vector Machines (SVMs) which results in improved performance over that of earlier classifiers by [12]. Shallow semantic parsing is formulated as a multiclass classification problem. SVMs are used to identify the arguments of a given verb in a sentence and classify them by the semantic roles that they play such as AGENT, THEME, and GOAL.
III.PROPOSEDSYSTEM
The proposed mining model is an extension of the work in [13]. The proposed image clustering framework relies on the creation of two image graphs representing two kinds of similarity between images of the collection[14], i.e. based on their visual features, and text respectively. The proposed concept-based mining model and image clustering framework consists of sentence-based concept analysis, document-based concept analysis, corpus-based concept-analysis, concept-based similarity measure and creation of two image graphs representing two kinds of similarity between im-ages of the collection, as depicted in Fig.1.
Fig.1. Overall diagram for proposed system
IV.CONCEPT-BASEDMININGMODEL
390
All Rights Reserved © 2013 IJARCSEEThe sentence that has many labeled verb argument structures includes many verbs associated with their arguments. The labeled verb argument structures, the output of the role labeling task, are captured and analyzed by the concept-based mining model on sentence, document, and corpus levels.
In this model, both the verb and the argument are considered as terms. One term can be an argument to more than one verb in the same sentence. This means that this term can have more than one semantic role in the same sentence. In such cases, this term plays important semantic roles that contribute to the meaning of the sentence. In the concept-based mining model, a labeled term either word or phrase is considered as concept.
The objective behind the concept-based analysis task is to achieve an accurate analysis of concepts on the sentence, document, and corpus levels rather than a single-term analysis on the document only. To analyze each concept at the sentence level, a new concept-based frequency measure, called the conceptual term frequency (ctf) is proposed. The ctf calculations of concept c in sentence s and document d are as follows:
A. Sentence-Based Concept Analysis
1) Calculating ctf of Concept c in Sentence s
The ctf is the number of occurrences of concept c in verb argument structures of sentence s. The concept c, which frequently appears in different verb argument structures of the same sentence s, has the principal role of contributing to the meaning of s. In this case, the ctf is a local measure on the sentence level.
2) Calculating ctf of Concept c in Document d
A concept c can have many ctf values in different sentences in the same document d. Thus, the ctf value of concept c in document d is calculated by:
sn Єctfn
ctf = n=1 sn
where sn is the total number of sentences that contain concept c in document d. Taking the average of the ctf values of concept c in its sentences of document d measures the overall importance of concept c to the meaning of its sentences in document d. A concept, which has ctf values in most of the sentences in a document, has a major contribution to the meaning of its sentences that leads to discover the topic of the document. Thus, calculating the average of the ctf values measures the overall importance of each concept to the semantics of a document through the sentences.
B. Document-Based Concept Analysis s
To analyze each concept at the document level, the concept based term frequency tf , the number of occurrences of a concept (word or phrase) c in the original document, is calculated. The tf is a local measure on the document level.
C. Corpus--Based Concept Analysis
To extract concepts that can discriminate between documents, the concept-based document frequency df, the number of
documents containing concept c, is calculated.The df is a global measure on the corpus level. This measure is used to reward the concepts that only appear in a small number of documents as these concepts can discriminate their documents among others.The process of calculating ctf, tf , and df measures in a corpus is attained by the proposed algorithm which is called Concept-based Analysis Algorithm.
D. Concept-Based Analysis Algorithm
1. ddoci is a new Document
2. L is an empty List (L is a matched concept list) 3. sdoci is a new sentence in ddoci
4. Build concepts list Cdoci from sdoci 5. for each concept ci 2 Ci do
6. compute ctfi of ci in ddoci 7. compute tfi of ci in ddoci 8. compute dfi of ci in ddoci
9. dk is seen document, where k ¼ f0; 1; . . . ; doci _ 1g 10. sk is a sentence in dk
11. Build concepts list Ck from sk 12. for each concept cj 2 Ck do 13. if (ci == cj) then
14. update dfi of ci
15. compute ctfweight ¼ avgðctfi; ctfjÞ 16. add new concept matches to L 17. end if
18. end for 19. end for
20. output the matched concepts list L
The concept-based analysis algorithm describes the process of calculating the ctf, tf , and df of the matched concepts in the documents. The procedure begins with processing a new document (at line 1) which has welldefined sentence boundaries. Each sentence is semantically labeled according to [15]. The lengths of the matched concepts and their verb argument structures are stored for the concept-based similarity calculations in Section 3.6.
Each concept (in the for loop, at line 5) in the verb argument structures, which represents the semantic structures of the sentence, is processed sequentially. Each concept in the current document is matched with the other concepts in the previously processed documents. To match the concepts in previous documents is accomplished by keeping a concept list L, which holds the entry for each of the previous documents that shares a concept with the current document.
After the document is processed, L contains all the matching concepts between the current document and any previous document that shares at least one concept with the new document. Finally, L is output as the list of documents with the matching concepts and the necessary information about them. The concept-based analysis algorithm is capable of matching each concept in a new document d, with all the previously processed documents in O(m) time, where m is the number of concepts in d.
E. Concept-Based Similarity Measure
391
All Rights Reserved © 2013 IJARCSEEcombined approach rather than on individual terms (words) only, is devised. The concept-based similarity measure relies on three critical aspects. First, the analyzed labeled terms are the concepts that capture the semantic structure of each sentence.
TABLE I
EXAMPLE OF CALCULATING THE PROPOSED CTF MEASURE
Second, the frequency of a concept is used to measure the contribution of the concept to the meaning of the sentence, as well as to the main topics of the document. Last, the number of documents that contains the analyzed concepts is used to discriminate among documents in calculating the similarity. These aspects are measured by the proposed concept-based similarity measure which measures the importance of each concept at the sentence level by the ctf measure, document level by the tf measure, and corpus level by the df measure. The concept-based measure exploits the information extracted from the concept-based analysis algorithm to better judge the similarity between the documents.
V. VISUAL SIMILARITY GRAPH CREATION
For the representation of the visual content of a given image, a set of local visual features are detected and a descriptor is extracted from their surrounding area. In our approach, we selected the SIFT(Scale Invariant Feature Transform) features to represent the visual properties of the images.
Lowe‟s[3] Scale-Invariant Feature Transform (SIFT) is a very successful image matching approach for detecting and extracting local feature descriptors that are reasonably invariant to changes in illumination, image noise, rotation, scaling, and small changes in viewpoint. It transforms image data into scale-invariant coordinates relative to local
features.They are well localized in both the spatial and frequency domains, reducing the probability of disruption by occlusion, clutter, or noise. Large numbers of features can be extracted from typical images with efficient algorithms. In addition, the features are highly distinctive, which allows a single feature to be correctly matched with high probability against a large database of features, providing a basis for object and scene recognition.
The cost of extracting these features is minimized by taking a cascade filtering approach, in which the more expensive operations are applied only at locations that pass an initial test. Following are the major stages of computation used to generate the set of image features.
A. Constructing a scale space
This is the initial preparation. We create internal representations of the original
image to ensure scale invariance. This is done by generating a “scale space”. SIFT takes scale spaces to the next level. We take the original image, and generate progressively blurred out images. Then, we resize the original image to half size. And we generate blurred out images again. And keep repeating.
Mathematically, “blurring” is referred to as the convolution of the gaussian operator and the image. Gaussian blur has a particular expression or “operator” that is applied to each pixel. What results is the blurred image.
Where L(x,y,σ) is a blurred image, G(x,y, σ) is the Gaussian Blur operator, σ is the “scale” parameter and I(x,y) is an original input image.
B. LoG Approximation
The second stage of computation searches over all scales and image locations. It is implemented efficiently by using a difference-of-Gaussian function to identify potential interest points that are invariant to scale and orientation. Difference of Gaussians is one such technique, locating scale-space extrema, D(x,y, σ) by computing the difference between
two images, one with scale k times the other. D(x, y, σ) is then
given by:
D(x, y, σ) = L(x, y, kσ) - L(x, y, σ)
To detect the local maxima and minima of D(x, y, σ)
392
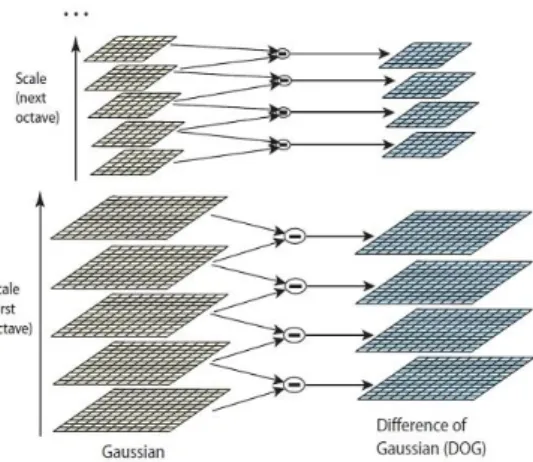
All Rights Reserved © 2013 IJARCSEEFig.2. Difference of Gaussian (DoG) of images
C.
Finding key pointsThese keypoints are maxima and minima in the Difference of Gaussian image we calculate in LoG approximation. Finding key points is a two part process a) Locate maxima/minima in DoG images, b) Find subpixel maxima/minima.
Locate maxima/minima in DoG images: The first step is to coarsely locate the maxima and minima. We iterate through each pixel and check all its neighbour:
Fig.3. Locating maxima and minima in DoG images
X marks the current pixel. The green circles mark the neighbours. This way, a total of 26 checks are made. X is marked as a “key point” if it is the greatest or least of all 26 neighbours.
Usually, a non-maxima or non-minima position won‟t have to go through all 26 checks. A few initial checks will usually sufficient to discard it. Note that keypoints are not detected in the lowermost and topmost scales. There simply aren‟t enough neighbours to do the comparison. Once this is done, the marked points are the approximate maxima and minima. They are “approximate” because the maxima/minima almost never lies exactly on a pixel. It lies somewhere between the pixel. But we simply cannot access data “between” pixels. So, we must mathematically locate the subpixel location.
Find subpixel maxima/minima: Using the available pixel data, subpixel values are generated. This is done by the Taylor expansion of the image around the approximate key point. Mathematically, it‟s like this:
We can easily find the extreme points of this equation (differentiate and equate to zero). On solving, we‟ll get sub pixel key point locations. These sub pixel values increase chances of matching and stability of the algorithm.
D. Get rid of Bad Key points
Edges and low contrast regions are bad key points. Eliminating these makes the algorithm efficient and robust. Key points generated in the previous step produce a lot of key points. Some of them lie along an edge, or they don‟t have enough contrast. In both cases, they are not useful as features. So we get rid of them. For low contrast features, we simply check their intensities. If the magnitude of the intensity (i.e., without sign) at the current pixel in the DoG image (that is being checked for minima/maxima) is less than a certain value, it is rejected. Because we have subpixel key points (we used the Taylor expansion to refine key points), we again need to use the taylor expansion to get the intensity value at subpixel locations. If it‟s magnitude is less than a certain value, we reject the key point. Removing edges is applying by calculate two gradients at the key point. Both perpendicular to each other. Based on the image around the key point, three possibilities exist.
E. Assigning an orientation to the key points
An orientation is calculated for each key point. They‟ve been tested to be stable. So we have scale invariance. The next thing is to assign an orientation to each keypoint. This orientation provides rotation invariance. The more invariance we have the better it is. The idea is to collect gradient directions and magnitudes around each keypoint. Then we figure out the most prominent orientation(s) in that region. And we assign this orientation(s) to the keypoint. Any later calculations are done relative to this orientation. This ensures rotation invariance. The size of the “orientation collection region” around the keypoint depends on it‟s scale.The bigger the scale, the bigger the collection region.
Gradient magnitudes and orientations are calculated using these formulae:
Fig. 4. Gradient magnitudes and orientations of images
F. Generate SIFT features
393
All Rights Reserved © 2013 IJARCSEEthe final step of SIFT. Till now, we had scale and rotation invariance. Now we create a fingerprint for each keypoint. This is to identify a keypoint
Any gradient orientation in the range 0-44 degrees add to the first bin. 45-89 add to the next bin. And so on. And (as always) the amount added to the bin depends on the magnitude of the gradient. Unlike the past, the amount added also depends on the distance from the keypoint. So gradients that are far away from the keypoint will add smaller values to the histogram. This is done using a “gaussian weighting function”. This function simply generates a gradient (it‟s like a 2D bell curve). We multiple it with the magnitude of orientations, and we get a weighted thingy. The farther away, the lesser the magnutide.
Fig.5.Gaussian Weighting Function
Doing this for all 16 pixels, we would‟ve “compiled” 16 totally random orientations into 8 predetermined bins. We do this for all sixteen 4×4 regions. So we end up with 4x4x8 = 128 numbers. Once we have all 128 numbers, we normalize them (just like we would normalize a vector in school, divide by root of sum of squares). These 128 numbers form the “feature vector”. This keypoint is uniquely identified by this feature vector.We need to get rid of them before finalizing the fingerprint. a) Rotation dependence: To achieve rotation independence, the keypoint‟s rotation is subtracted from each orientation. Thus each gradient orientation is relative to the keypoint‟s orientation. b) Illumination dependence:If we threshold numbers that are big, we can achieve achieve illumination independence. So, any number (of the 128) greater than 0.2 is changed to 0.2. This resultant feature vector is normalized again and now we have an illumination independent feature vector.
VI.GRAPHBASEDCLUSTERING
Once the visual and tag image graphs are created, we combine them by into a hybrid image similarity graph by forming the union of the two graphs. We then perform the graph-based clustering of the images by use of community detection, i.e. by identifying regions on the graph with high connection density. We have experimented with two community detection methods, the SCAN algorithm[2] and a refinement of it, which entails a cluster expansion step by maximizing a local cluster quality measure. The basic community detection step is based on the concept of structural similarity between nodes. The structural similarity between nodes v and w is defined as:
where is the structure of node v, i.e. the set comprising the neighbors of the node and the node itself as elements.
(a) (b) (c)
Fig.5. Comparison between image clusters derived from different similarity
graphs: (a) SCANVIS, (b) SCANTAG-C, and SCANHYB.
VII. CONCLUSIONS
394
All Rights Reserved © 2013 IJARCSEEREFERENCES
[1] M. L. KHERFI AND D. ZIOU, A. BERNARDI, “Image Retrieval
From the World Wide Web: Issues, Techniques, and Systems”, ACM Computing Surveys, Vol. 36, No. 1, March 2004.
[2] S. Papadopoulos et al., „„Image Clustering through Community
Detection on Hybrid Image Similarity Graphs,‟‟ Proc. Int‟l Conf. Image Processing, IEEE Press, 2010.
[3] D.G. Lowe, „„Distinctive Image Features from Scale-Invariant
Keypoints,‟‟ Int‟l J. Computer Vision vol. 60, no. 2, 2004, pp. 91-110 (software available at http://www.cs.ubc.ca/~lowe/keypoints/).
[4] YU MENG and Dr. Bernard Tiddeman,” Implementing the Scale
Invariant Feature Transform(SIFT) Method”at
www.cs.standrews.ac.uk/~yumeng/yumeng-SIFTreport-5.18_bpt.pdf .
[5] B. Gao, T.Y. Liu, T. Qin, X. Zheng, Q.S. Cheng, and W.Y.Ma, “Web
image clustering by consistent utilization of visual features
[6] T. Honkela, S. Kaski, K. Lagus, and T. Kohonen, “WEBSOM—Self-
Organizing Maps of Document Collections,” Proc. Workshop Self-Organizing Maps (WSOM ‟97), 1997.
[7] L. Talavera and J. Bejar, “Generality-Based Conceptual Clustering
with Probabilistic Concepts,” IEEE Trans. Pattern Analysis and Machine Intelligence, vol. 23, no. 2, pp. 196-206, Feb. 2001.
[8] D. Gildea and D. Jurafsky, “Automatic Labeling of Semantic Roles,”
Computational Linguistics, vol. 28, no. 3, pp. 245-288, 2002.
[9] S. Pradhan, W. Ward, K. Hacioglu, J. Martin, and D. Jurafsky,
“Shallow Semantic Parsing Using Support Vector Machines,” Proc. Human Language Technology/North Am. Assoc. for Computational Linguistics (HLT/NAACL), 2004.
[10] S. Pradhan, K. Hacioglu, W. Ward, J.H. Martin, and D. Jurafsky,
“Semantic Role Parsing: Adding Semantic Structure to Unstructured Text,” Proc. Third IEEE Int‟l Conf. Data Mining (ICDM), pp. 629-632, 2003.
[11] S. Pradhan, K. Hacioglu, V. Krugler, W. Ward, J.H. Martin, and D.
Jurafsky, “Support Vector Learning for Semantic Argument Classification,” Machine Learning, vol. 60, nos. 1-3, pp. 11-39, 2005J. Padhye, V. Firoiu, and D. Towsley, “A stochastic model of TCP Reno congestion avoidance and control,” Univ. of Massachusetts, Amherst, MA, CMPSCI Tech. Rep. 99-02, 1999.
[12] D. Gildea and D. Jurafsky, “Automatic Labeling of Semantic Roles,”
Computational Linguistics, vol. 28, no. 3, pp. 245-288, 2002.
[13] S. Shehata, F. Karray, and M. Kamel, “Enhancing Text Clustering
Using Concept-Based Mining Model,” Proc. Sixth IEEE Int‟l Conf. Data Mining (ICDM), 2006.
[14] Andreas Girgensohn, Frank Shipman, Thea Turner, Lynn Wilcox,
“Flexible Access to Photo Libraries via Time, Place, Tags, and Visual
Features”,IEEE International Conference, 2004.
[15] [P. Kingsbury and M. Palmer, “Propbank: The Next Level of
Treebank,” Proc. Workshop Treebanks and Lexical Theories, 2003.
[16] Giovanni Quattrone and Licia Capra, Pasquale De Meo and Emilio
Ferrara, Domenico Ursino DIMET,” Effective Retrieval of Resources in Folksonomies Using a New Tag Similarity Measure”, International Conference on 2011 ACM 978-1-4503-0717-8/11/10 ...$10.00.
Suresh S is an assistant professor at Department of Computer Science and Engineering in M.A.R Engineering College, Trichirapalli. He received his B.E degree from Melmaruvathur Adhiparasakthi Engineering College and M.E from Anna University of Technology, Trichirapalli. His research interests include image mining and web mining with focuses on Soft Computing.