199
INTERSPECIES RELATIONS AND YIELD OF DIFFERENT FIELD
PEA/OATS MIXTURES
Krga I.*, Simić A., Bijelić Z., Mandić V., Vasiljević S., Karagić Đ.,Milić D.
MSc. Ivan Krga, Dr Aleksandar Simić, associate professor; University of Belgrade, Faculty of Agriculture, Nemanjina 6, 11080, Belgrade, Serbia. Dr Zorica Bijelić, research associate, Dr. Violeta Mandić, research associate; Institute for animal
husbandry, Autoput 16, 11080, Belgrade, Serbia. Dr Sanja Vasiljević, senior research associate; Institute for field and vegetable crops, Maksima Gorkog 30, 21000, Novi Sad, Serbia. Corresponding author: [email protected]
Keywords: field pea, mixture, oats, yield
ABSTRACT
The experiment was conducted in order to examine biological interaction, yield and variation of certain morphological traits in mixture with field pea as main and oats as supporting crop. Experiment included two trials, each conducted in the spring of 2015 and 2016. Each trial with two factors, the factor of the mixture (100: 15% - field pea: oats; 100: 30% field pea: oats), intercropped as additive series and two controls (100% field pea; 100% oats) and the second factor, the develpoment stage(I phase – flowering phase of field pea; II phase – seed formation of field pea). Beside the botanical share and yield of fresh weight and dry matter, plant height and number of internodes were also examined. Based on the obtained results it have been concluded that oats is highly competitive. In both years oats showed high competitiveness although it was in lower share in sowing rate. Fresh weight and dry matter yield exceed the yield of individually grown crops in 2015 (fresh matter yield – I mowing phase: field pea – 17.3 t ha-1; oats – 16.2 t ha-1
; 100:15% - 21.7 t ha-1; 100:30% – 21.2 t ha-1) and 2016 (fresh matter yield – I mowing phase: field pea – 16.21 t ha-1
; oats – 21.3 t ha-1; 100:15% - 22.9 t ha-1; 100:30% – 20.95 t ha-1). It have been concluded that mixtures with higher share of oats form higher dry matter yield, while the yield of fresh weight was not significantly different between the mixtures.Plant height and number of internodes in field pea have higher values when they are in a mixture than in single crop.
INTRODUCTION
agro-200
technical significance as well. The quantities of nitrogen that remain in the soil for the next crop, after the cultivation of pea, range from 45 to 63 kg ha-1 N (Stevenson et al., 1997). Therefore, the need for nitrogen fertilizer is reduced as well as the risk of environment pollution (Huss-Danellet al., 2007).
Advantages of growing pea in mixture with oats, compared to individually grown crops, are numerous. A large number of papers have examined this issue and Fabaceae x
Poaceae in general. Advantages are reflected in increased forage and grain yield (Krgaet al., 2016; Jensen, 1996), higher N content in the fodder (Cowell et al., 1989; Droushiotis, 1989), better forage quality (Chapkoet al., 2013; Carr et al., 1997), more favorable impact on soil (Lazaridou et al., 2006), prevention to some diseases in animals (Lacefieldet al., 1997), decreased lodging, etc.
Animal husbandry in Serbia is facing a delay.Inadequate agricultural policies and practices have led to a reduction in livestock.One of the conditions to improve livestock on the territory of Serbia is to improve the production of animal feed rich in protein. The production of high yield forage rich in protein can reduce the need to import expensive protein feeds while providing a balanced meal and thus reduce the overall input in livestock. Goal of this study was to examine differences in yield, botanical share and other morphological parameters affected by different sowing rates and mowing phase, while looking back on main characteristics for these mixtures.
MATERIAL AND METHOD
The experiment was carried out in the vicinity of Belgrade(44° 50' 18.9'' latitude, 20° 17' 0.6'' longitude, 66 m elevation) at the Institute for Animal Husbandry. The paper examine two trials, each conducted in the spring of 2015 and 2016. Each trial included two factors. First factor wastype of mixture (100% field pea: 15% oats; 100% field pea: 30% oats) with two control treatment (100% field pea; 100% oats), with 100% sowing rate of 155 kg ha-1for both species; and second factor, mowing phase (I phase – flowering phase of field pea; II phase – seed formation of field pea).
Experimental plan was completely randomized block design. The trials were carried out on calcareous type of soil (chernozem-soil known for its natural quality), in natural water conditions (no irrigation), without fertilizers. Both trials were harvested at the flowering phase of field pea, and seed formation stage. Beside botanical share and yield of fresh and dry matter, height and number of internodes were examined. The experiment was set up in four repetitions with elemental plots of 8 m2 with a row spacing 20 cm. Autumn tillage was done at depth of 25 cm, followed by a fine seedbed preparation and land rolling after sowing. The botanical share of field pea and oats in the mixture is determined by sampling and separating mixtures on 1 m2. The dry matter is formed on the basis of 1 kg of fresh matter, which was dried in an oven at a temperature of 60° C. Ten plants sample was taken for the analysis of morphological characteristics.Climatic factors and chemical analysis of soil were examined, presented and interpreted. Experimental findings were analyzed by the method of variance analysis (ANOVA) for two-factorial plan, and the significant differences were determined by LSD test.For statistical analysis program Statistica Version 8.0 was used.The results are presented in tables.
201
avoided this extreme period, confirming the thesis that the pea with its short vegetation avoids summer high temperatures and drought.
The climatic period for second trial (2016) had significantly higher values than values in referenced period and vegetation period in 2015. Total precipitation for second trial (I-VI) was 170.4 mm higher than values in referenced period and 124.4 mm higher then values in 2015. Average temperature was 1.6° C higher than the values in referenced period. Based on the displayed results it can be concluded that the climatic values for both trials were slightly higher than average in terms of temperature and visibly higher in terms of monthly precipitations.
Table 1. Monthly precipitation (mm) and average temperatures (C°), spring experiment
II-VI – Climatic period significant to spring crop; IX-V Climatic period significant to winter crop
Soil features: Based on the chemical analysis of the soil, compared to the optimal values that are characteristic for soil type Chernozem, it can be concluded that the soil had average humus content (2.36 %), average to high content of the total (0.22%) and decent content of nitrate nitrogen (28 ppm). High phosphorus content have been confirmed (34.91 ppm) and the average potassium content (141 ppm). pH value in KCl 5,69 was also in appropriate range for tested species. If we take into account the medium-fine soil on which trials were carried out, without the use of fertilizers, it can be concluded that the crop, in terms of soil factors, had favorable conditions for growth and development, but not for expressing their full potential.
RESULTS AND DISCUSSIONS
Based on visual observations,larger quantity of weeds have been observed in single grown crops, while field pea and oats combinations are characterized by good competitive ability against weeds. This is consistent with a number of other researches (Weiner et al., 2001; 2010, Kristensen et al., 2010), thus it can be concluded that the higher crop density reduced weed presence.
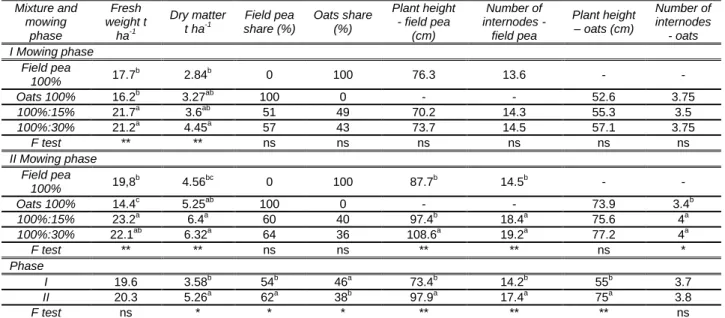
In the first (2015) experimental year, in both phases, there was a significantly higher yield of fresh and dry matter in mixtures than in individually grown crops (Table 2). There were no significant differences between mixtures. Mowing phases were different only for dry matter yield, where the yield in the second phase (5.26 t ha-1) was significantly higher than in the first phase (3.58 t ha-1). Field pea and oats share did not considerably change depending on the mixture, however the percentage of oats ishigher despite a lower share in sowing rates.Sowing rates should be taken into account, since oats is visibly competitive species. With the advancing of vegetation, percentage of field pea in mixture is increasing (54% I phase); (62% IIphase). Plant height and number of internodes can be seen as indicator of yield.With the increase of these values it is expected that the yield will increase as well. In the second phase, these features manifested higher values in mixture 100:30%.
Year
Month -
I II III IV V VI VII VIII IX X XI XII I-VI
Monthly precipitation - mm Sum
1992-2013 50.1 46 41.1 53.6 58.1 96.5 65.7 59.2 63.2 53.5 51.8 65 345.4
2015 37.3 62.5 136 35.1 87.6 32.9 10.3 49.5 101.4 71.8 63.4 3.8 391.4
2016 48.1 43.3 144 55 75.4 150 - - - 515.8
Average monthly temperature – C° Average
1992-2013 1.7 3.3 7.9 13.6 18.2 21.8 23.6 23.3 18.2 13.1 7.7 2.8 11.1
2015 3.1 4.9 9.0 13.1 19.2 23.5 27.3 26.0 20.0 12.4 9.2 4.3 12.1
202
Height of plants in this mixture was significantly higher than the height in a mixture of 100:15% or single grown crops. Number of internodes have same values in both mixtures, and significantly lower in single grown pea compared to mixtures. As expected, these values were significantly higher in second mowing phase compared to the first (phase I – height 73.4; number of internodes 14.2; phase II - height 97.9; number of internodes 17.4). Oats plant height did not vary for both phases.Number of internodes varied only in the second phase and was higher in the mixtures in relation to the pure crops.Height was significantly higher in the second mowing stage (75 cm) then in the first (55 cm).
Table 2. Botanical share, yield and morphological characteristics of field pea and oats
in mixture (2015)
100%:15% - field pea:oats sowing rate; 100%:30% - field pea:oats; I mowing phase – flowering stage of field pea; II mowing phase –
seed formation of field pea; F test – least significant differences; ns –non significant
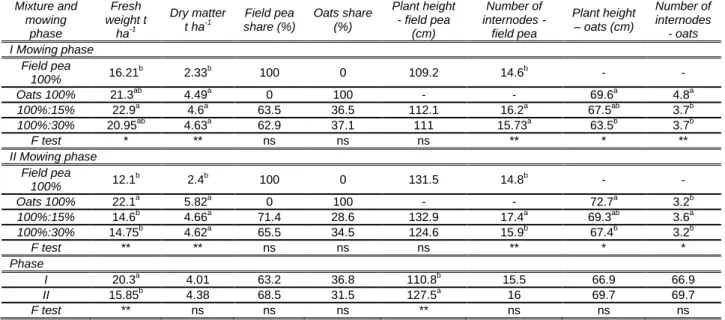
In second trial (2016), fresh and dry matter was lowest in single grown field pea for both mowing phases. Oats exhibited different trend in the second trial than in the first, and in terms of yield parried (phase I: field pea – 16,21 t ha-1; oats – 21,3 t ha-1
, 100:15% - 22,9 t ha-1; 100:30% - 20,95 t ha-1) or it had significantly higher yield compared to single grown pea or in mixtures (phase II: field pea – 12,1 t ha-1; oats – 22,1 t ha-1
, 100:15% -14,6 t ha-1; 100:30% - 14,75 t ha-1). However, in terms of dry weight, mixtures and single grown oats, in both phases had no significant difference although it is visible that oats (Field pea 100% - 2,84 t ha-1; Oats 100% - 3,27 t ha-1) still have higher DM yield than single grown field pea.Field pea and oats share did not significantly changed depending on the mixture and phase. The share of oats in total yield is still high although it had lower share in sowing rate. Plant height of field pea had not significantly changed depending on mixture, but there were changes dependent on mowing phase. Plants had significantly higher values in second phase (I – 110.8 cm; II – 127.5 cm). Number of internodes of field pea had significantly higher values in the mixture compared to single grown pea, and these values also varied depending on the phase.
Overall experiment have shown that yield of fresh and dry matter are stable in first mowing phase and intercropping these two species intercroped affected yield. Dry matter content tend to increase with maturity of crop, but due to lower quality (Dear et al., 2005), digestibility and increased differences in yield in later vegetation, harvest should not be delayed, so optimal harvest should be around stage of flowering.
Mixture and mowing
phase
Fresh weight t
ha-1
Dry matter t ha-1
Field pea share (%)
Oats share (%)
Plant height - field pea
(cm)
Number of internodes -
field pea
Plant height – oats (cm)
Number of internodes
- oats I Mowing phase
Field pea
100% 17.7
b
2.84b 0 100 76.3 13.6 - -
Oats 100% 16.2b 3.27ab 100 0 - - 52.6 3.75
100%:15% 21.7a 3.6ab 51 49 70.2 14.3 55.3 3.5
100%:30% 21.2a 4.45a 57 43 73.7 14.5 57.1 3.75
F test ** ** ns ns ns ns ns ns
II Mowing phase Field pea
100% 19,8
b
4.56bc 0 100 87.7b 14.5b - -
Oats 100% 14.4c 5.25ab 100 0 - - 73.9 3.4b
100%:15% 23.2a 6.4a 60 40 97.4b 18.4a 75.6 4a
100%:30% 22.1ab 6.32a 64 36 108.6a 19.2a 77.2 4a
F test ** ** ns ns ** ** ns *
Phase
I 19.6 3.58b 54b 46a 73.4b 14.2b 55b 3.7
II 20.3 5.26a 62a 38b 97.9a 17.4a 75a 3.8
203
Table 3. Botanical share, yield and morphological characteristics of field pea and oats in
mixture (2016)
100%:15% - field pea:oats sowing rate; 100%:30% - field pea:oats; I mowing phase – flowering stage of field pea; II mowing phase –
seed formation of field peas; F test – least significant differences; ns –non significant
Dear et al. (2005) have concluded that crude protein content in field pea/oats mixture is lower when mowing phase is delayed. In mowing phase I (booting phase of oats), crude protein content was 11%, second mowing phase (anthesis stage of oats) 9.4% and in phase III (milk stage of oats), 6.9%. It is useful to mention that almost all legume species provide best quality forage in earliest stages of maturity such as flowering stage, weather annual or perennial, single or intercropped, and this is supported by vast scientific data (Llovers, 2001; Wiersma et al., 1998; Hintzet al., 1991).
Both years have shown same trend in terms of field pea:oats competitiveness and it have been concluded that oats is highly competitive even though it had lower share in sowing rate and mixture also tend to increase plant height and number of internodes.
CONCLUSIONS
Based on the obtained results there were higher levels of rainfall during the growing season as well as mild temperatures and average soil quality.
Oats is highly competitive and because of that characteristic, preparing of mixtures in terms of sowing rate should be done with precaution and oats share in sowing rate should not exceed 15%.
Plant height and number of internodes of field pea were significantly higher in the mixture than in controls (2015 - phase I: field pea -13,6 cm; 100:15% - 14,3 cm; 100:30% - 14,5 cm); (2016 - phase I: field pea -14,6 cm; 100:15% - 16,2 cm; 100:30% - 15,73 cm). These values indicate that field peaplants tend to grow longer when in mixture.
Dry matter increase as the share of oats in the mixture increases, but due to its competitiveness, the share of oats in sowing rate should not exceed 15%.
The average yield of fresh and dry matter was significantly higher in the mixture compared to pure crops (2015 - phase I: field pea - 2.84 t ha-1; oats - 3.27 t ha-1; 100: 15% - 3.6 t ha-1; 100: 30% - 4.45 t ha-1);(2016 - phase I: field pea - 2:33 t ha-1; oats - 4.49 t ha-1; 100: 15% - 4.6 t ha-1; 100: 30% - 4.63 t ha-1 ).The differences between the mixtures
Mixture and mowing
phase
Fresh weight t
ha-1
Dry matter t ha-1
Field pea share (%)
Oats share (%)
Plant height - field pea
(cm)
Number of internodes -
field pea
Plant height – oats (cm)
Number of internodes
- oats I Mowing phase
Field pea
100% 16.21
b
2.33b 100 0 109.2 14.6b - -
Oats 100% 21.3ab 4.49a 0 100 - - 69.6a 4.8a
100%:15% 22.9a 4.6a 63.5 36.5 112.1 16.2a 67.5ab 3.7b
100%:30% 20.95ab 4.63a 62.9 37.1 111 15.73a 63.5b 3.7b
F test * ** ns ns ns ** * **
II Mowing phase Field pea
100% 12.1
b
2.4b 100 0 131.5 14.8b - -
Oats 100% 22.1a 5.82a 0 100 - - 72.7a 3.2b
100%:15% 14.6b 4.66a 71.4 28.6 132.9 17.4a 69.3ab 3.6a
100%:30% 14.75b 4.62a 65.5 34.5 124.6 15.9b 67.4b 3.2b
F test ** ** ns ns ns ** * *
Phase
I 20.3a 4.01 63.2 36.8 110.8b 15.5 66.9 66.9
II 15.85b 4.38 68.5 31.5 127.5a 16 69.7 69.7
204
themselves were not significant.Average dry matter yield was higher in the second phase, however, forage tend to lose its quality and good chemical composition with later maturity of crop, thus later mowing is not recommended, also, according to the results, the second phase is prone to large variations in terms of yield. After analysis of the obtained results, first mowing phase (flowering stage of field pea) is more reliable in terms of stable yield and quality.
BIBLIOGRAPHY
1. Acikgoz E., Katkat V., Omeroglu S., Okan B., 1985 -Mineral elements and amino acid concentrations in field pea and common vetch herbages and seeds. Journal of Agronomy and Crop Science. 55,179– 185.
2. Baldev B., 1988 -Origin, distribution, taxonomy, and morphology. In: Baldev B, Ramanujam S, Jain HK (eds) Pulse crops. Oxford and IBH, New Delhi, 3–51.
3. Carr M. P., Glenn B. M., Joel M. C., Poland W. W., 1997 - Forage and Nitrogen Yield of Barley—Pea and Oat—Pea Intercrops. Agronomy Journal.90, 1:79-84.
4. Chapko L. B., Brinkman M. A., Albrecht K. A., 2013 -Oat, Oat-Pea, Barley, and Barley-Pea for Forage Yield, Forage Quality, and Alfalfa Establishment. Journal of production Agriculture,4,4:486-491.
5. Cowell L. E., Bremer E., Van Kessel C., 1989 -Yield and N2fixation of pea and
lentil as affected by intercropping and N application. Canadian Journal of Soil Science, 9, pp. 243–251.
6. Dear B., Kaiser A., Piltz J., 2005 -Yield and digestibility of legume and oat forages, Primefacts, p. 6.
7. Droushiotis D. N., 1989 -Mixtures of annual legumes and small-grained cereals for forage production under low rainfall. Journal of Agricultural Science (Cambr.), 113, 249-253.
8. Henry A. G., Brooks A. S., Piperno D. R., 2011 -Microfossils in calculus demonstrate consumption of plants and cooked foods in Neanderthal diets (Shanidar III, Iraq; Spy I and II, Belgium). Proceedings of National Academyof Sciences - USA, 108, 486–491.
9. Hintz R. W., Albrecht K. A., Oplinger E. S., 1991 -Yield and Quality of Soybean Forage as Affected by Cultivar and Management Practices. Agronomy Journal, 84,5:795-798.
10. Huss-Danell K., Chaia E., Carlsson G., 2007 -N2 fixation and nitrogen allocation to
above and bolow ground plant parts in red clover-grasslands. Plant and Soil, 299: 215-226.
11. Jensen E. S., 1996 - Grain yield, symbiotic N2fixation and interspecific competition
for inorganic N in pea–barley intercrops. Plant Soil, 182, 1:25–38.
12. Krga I., Simić A., Bijelić Z., Mandić V., Vasiljević S., Velijević N., 2016 – Interspecies relations of field pea and oats in mixture at different stage of mowing. Proceedings of Institute PKB Agroeconomic, 22 (1-2), 181-189.
13. Kristensen L., Olsen J., Weiner J., 2010 -Crop Density, Sowing Pattern, and Nitrogen Fertilization Effects on Weed Suppression and Yield in Spring Wheat. Weed Science, 56: 97–102.
14. Lacefield G. D., Ball D. M., Henning J. C., Rasnake M., 1997 -Roles of Clovers in Southeast U.S.A. Pastures. Proceeding of the XVIII International Grassland Congress, Winnipig, Manitoba, Saskatoon, Saskatchewan, Canada: 14-24.
15. Lazaridou M., Vrahnakis M., Noitsakis B., 2006 -Performance of legume grass association in the field under drought and cutting conditions –
205
16. Llovers J., 2001 -Alfalfa (Medicago sativa L.) management for irrigated Mediterranian conditions: The case of Ebra Valley. Options Seminars mediterrranennes. Zaragoza, 12-15 September, 45:115-125.
17. Marohnić I., 2006 -Grašak – buduće glavno bjelančevinasto krmivo Europe. Krmiva 48 (6): 363-368.
18. Mihailović V., Mikić A., Katić S., Karagić Đ., Milošević B., 2010 -Potential of field pea for forage and grain protein yields.Field & Vegetable Crops Research , 47, 1: 43-48.
19. Mikić A., Ćupina B., Katić S., KaragićĐ., 2006 -Importance of annual forage
legumes in supplying plant proteins. Proceedings of the Institute of Field and Vegetable Crops, 2006, 42, 1: 91-104.
20. Stevenson F.C., van Kessel C., 1997 -Nitrogen Contribution of Pea Residue in a Hummocky Terrain. Soil Science Society of America Journal, 61, 2:494-503.
21. Weiner J., Griepentrog H. W., Kristensen L., 2001 -Suppression of weeds by spring wheat Triticumaestivum increases with crop density and spatial uniformity. Journal of Applied Ecology, 38, 784–790.
22. Weiner J., Andersen S., Wille W., Griepentrog H., Olsen J., 2010 -Evolutionary Agroecology: the potential for cooperative, high density, weed-suppressing cereals.Evolutionary Application. 3(5-6): 473–479.
23. Wiersma D. W., Smith R. R., Mlynarek M. J., 1998 -Harvest managements effects on red clover forage yield, quality and persistence, Journal of Production Agriculture, 11 (3): 309-313.