1
Vulnerability as a heuristic concept for interdisciplinary
research: assessing the thematic and methodological
structure of empirical life course studies
Doris Hanappi* National Centre of Competence in Research LIVES, University of Lausanne
University of California Berkeley, Department of DemographyLaura Bernardi Institute of Social Sciences and National Centre of Competence in Research LIVES,
Dario Spini University of Lausanne
(Received April 2014 Revised December 2014)
Abstract
Changes in human lives are studied in psychology, sociology, and adjacent fields as outcomes of developmental processes, institutional regulations and policies, culturally and normatively structured life courses, or empirical accounts. However, such studies have used a wide range of complementary, but often divergent, concepts. This review has two aims. First, we report on the structure that has emerged from scientific life course research by focusing on abstracts from longitudinal and life course studies beginning with the year 2000. Second, we provide a sense of the disciplinary diversity of the field and assess the value of the concept of ‘vulnerability’ as a heuristic tool for studying human lives. Applying correspondence analysis to 10,632 scientific abstracts, we find a disciplinary divide between psychology and sociology, and observe indications of both similarities of—and differences between—studies, driven at least partly by the data and methods employed. We also find that vulnerability takes a central position in this scientific field, which leads us to suggest several reasons to see value in pursuing theory development for longitudinal and life course studies in this direction.
1. Introduction
The study of human lives has become one of the most progressive areas of social science research over the past quarter-century, spreading across the social and behavioural sciences. With this change has come an acknowledgement that human personality and social pathways in transforming societies develop over a long stretch of time (Elder, 1994; Mayer, 2009). From this ‘long way of thinking’ (Elder, 1994, p. 4) has emerged a longitudinal and life course perspective that is tied to major progress in longitudinal data collection (Mayer, 2009). Longitudinal and life course analysis today has extended across disciplinary boundaries and specialty areas within particular disciplines (in developmental psychology see, e.g.,
Bronfen-brenner, 1979; in social history see, e.g., Elder, 1994; and in gerontology see, e.g., Streib & Binstock, 1990). We sympathise with the idea that the study of the life course is a progressive field with some degree of intellectual unity (Butz & Torrey, 2006), but too often it is still pursued within fragmented disciplines.
2
sources, new methods, and potential new theory development call for a more profound assessment of larger populations over a longer stretch of time, and a systematic examination of the whole life course within and across different domains and within and across institutional contexts.
Our article has two research aims. Research Aim 1 is to empirically assess whether life course studies share thematic and methodological common ground, in terms of topics covered, life stages studied, and methods used. The Research Aim 2 is to assess the current use of the concept of vulnerability in life course studies. By now, there is consensus among life course scholars that theory development beyond orienting concepts has not yet lived up to its full potential (e.g., Elder, 1985; Mortimer & Shanahan, 2003; George, 2003; O’Rand, 2006; Heinz & Marshall, 2005; Settersten, 2003), and that the lack of interdisciplinary concepts is all the more important to scientific progress as more new data sources and longitudinal methods are available (Mayer, 2009). Giving credit to these arguments, we assess whether the concept of vulnerability can be a viable heuristic for interdisciplinary life course research: We assess how frequently this concept is used and, more importantly, we position it into the field structure that we have explored in the first research aim, to assess whether it is used equally in terms of making reference to the same concept in the different disciplines.
We understand vulnerability as a lack of resources or as a social weakness (Ranci, 2010). Spini, Hanappi, Bernardi, Oris, & Bickel (2013) suggested that, for individuals or groups that are in a zone in which functionality is only secured at the limits of available resources, vulnerability may be manifested if the individual or group is challenged by critical events or depleted by chronic stresses or environmental pressures. Until the limits of available resources have no observable adverse consequences, vulnerability often remains latent. Other concepts, such as insecurity, relate to well-defined insecurities; for instance, job insecurity relates to job instability and employment precariousness (Elman & O’Rand, 2002). There is general agreement that this concept mainly refers to the perception that one’s current job might be lost (Esser & Olsen, 2011) and such perception increases feelings of powerlessness and a lack of control (Greenhalg & Rosenblatt, 1984). The
concept of risks has received considerable attention in the last decade in the social sciences after the publication of the book entitled Risk Society by Beck (1992). Risks are indeed associated with vulnerability, but the terms are not synonyms. Following Sirven (2007), risks are expressed by the probability that an event occurs whose consequences are generally known (for a main definition of risk see, e.g., Knight, 1921). He describes risks as the conjunction of a particular event that might possibly occur and people’s vulnerability to experience such an event. Following this perspective, we can describe vulnerability in terms of what can happen to a population, given that certain events occur (i.e., events shape vulnerability), whereby the occurrence of such events is influenced by people’s vulnerability itself (vulnerability shapes the probability of an event or hazard, as Sirven states).
Moreover, this concept is inextricably linked with human development at the intersection of the biological, psychological, and social domains (Baltes, Lindenberger, & Staudinger, 1998; Armingeon & Bonoli, 2006; Bronfenbrenner, 1989; Heinz & Marshall, 2005; Kohli, 2007). We restrict ourselves to dimensions of ‘vulnerability’ that pertain more broadly to social science in contrast to the biological or corporeal aspects of human development. We further exclude the medical and epidemiological studies for the same reason.1
3
risks have not replaced the risks that were experienced by entire social classes. In Ireland, Whelan and Maitre (2013) find significant interactions between social class and the life-cycle - generating poverty and risk patterns of economic vulnerability - a result that is largely confirmed by a cross-sectional analysis of Ireland, the United Kingdom, Denmark, Finland, Austria, Belgium, France, Germany, and the Netherlands (Pintelon, Cantillon, Bosch, & Whelan, 2013). Likewise, in a study using event history analysis of the European Community Household Panel, Vandecasteele (2011) found structural and biographical explanations of poverty to be complementary and pointed to major poverty-triggering events such as childbirth or job loss. In the welfare state literature, the concept of vulnerability has been used to point to state insufficiencies in providing adequate solutions to social problems (Esping-Andersen, 2002; Safarti & Bonoli, 2002; Esping-Andersen, 2009). In sum, concepts that account for the vulnerabilities of groups and individuals are at the intersection of domains such as work and family in a dynamic way—across human lives. That is why we consider such concepts to be particularly promising for advancing life course research.
We empirically assess the thematic and methodological structure of life course studies by the use of correspondence analyses and provide an overview of topics and life stages covered and methods used in this field of research. Unlike classic literature reviews, empirical literature assessments based on correspondence analysis do not require prior interpretative techniques. This makes them a very flexible and efficient tool for assessing the semantic structure of any research domain. We also identify the locations of research on vulnerability in/across various disciplines, thus expanding upon noteworthy literature reviews that focus on one specific research area (e.g., Walsh, 1996; Paugam, 2000). We give preference to scientific material published since the year 2000, to empirical research applying longitudinal designs to study changes in human lives over a longer stretch of time or over the duration of a lifetime, or to those that focus on particular episodes (such as the transition to employment) or narrow life phases; we also include cohort studies (rather than cross-sectional designs), studies on changes of lives within or across life domains, and studies that treat life course development as an outcome of personal
characteristics and institutional or structural conditions. Finally, we add studies that locate human lives in community contexts, kinship structures, or families.
This paper is organised in three sections. In the next section, we explain how we obtained our data and describe the method that we used. In the subsequent section, we provide a shorthand overview indicating how sociologists, developmental psychologists, demographers, social historians, and gerontologists have applied a life course perspective to understand changes in human lives. For this purpose, we illustrate the location of the themes covered, methods, and data in the respective semantic field space. In the remainder, we provide a first attempt, on the basis of that evidence, to address Research Aim 1, regarding thematic and methodological common ground in empirical life course studies, and Research Aim 2, which investigates the value of ‘vulnerability’ as a heuristic concept that can contribute to further progress in life course studies.
2. Method and data
2.1 Correspondence analysis
We use correspondence analysis, which is a multivariate technique commonly employed in sociology (Bourdieu, 1977) and used for exploring textual data (Lebart & Mirkin, 1993, Lebart, Salem, & Berry, 2010; Benzecri, 1992; for applications see, e.g., Mussino & Bernardi, 2010; Spini, Elcheroth, & Figini, 2008; Salamin & Hanappi, 2014). It is a descriptive/exploratory technique to analyse simple two-way and multi-way tables containing some measure of correspondence between the rows and columns. The results provide information that is similar to factor analysis techniques, and they allow for the exploration of the structure of categorical variables. It is a technique for describing contingency tables (or cross-tabulations) and certain binary tables (also known as presence-absence tables) (Lebart & Mirkin, 1993; Greenacre, 2010).
4
Subsequently, our goal is to represent the entries in the table of relative frequencies in terms of distances between individual rows and columns. The use of this technique allows for exploration of the simultaneous contribution of themes, methods, and disciplines in the structuring of the research field. The topography of the field emergent from the year 2000 and after shows each theme or method positioned with respect to all of the others (Greenacre, 2010).
2.2. Data
Our data covers journal article abstracts from longitudinal and life course research in the social sciences from several categories: first, studies with samples composed of vulnerable populations only (for migration see, e.g., Korinek, Entwisle, & Jampaklay, 2005; for depression see, e.g., Brockman, 2010; Kort-Butler, 2009; for elderly populations see, e.g., Brockmann, 2010; Ha, Carr, Utz, & Nesse, 2006; for precarious populations see, e.g., Gangl, 2002; Brady, 2006); second, studies that compare vulnerable populations with the ‘average’ population (e.g., Klimstra, Luyckx, Hale, Goossens, & Meeus, 2010; Agree, Meoni, & Klag, 2010); and, third, studies that identify resources, factors, and processes that cause or result from vulnerability (e.g., Hofferth & Goldcheider, 2010; Hank, 2005; Dunbar et al., 2006). In addition, some contributions include only specific sets of actors in their samples (e.g., adolescents, families, women, and workers), but focus on issues related to vulnerability (e.g., social exclusion, unemployment, and divorce) and, thus, have been included in our
data (e.g., Brady, 2006; Friedman, Steinwachs, Temkin-Greener, & Mukamel, 2006; Drenteea, Clay, Roth, & Mittelman, 2006). Consistent with the life course perspective (e.g., Mayer, 2009), only articles adopting a longitudinal/dynamic approach have been included, that focus on situations and processes of vulnerable populations or of populations rendering them resilient or vulnerable.2 Studies that mention cross-sectional designs have been excluded from this literature search.
Articles from academic and specialised journals have been considered and retrieved from two main bibliographic databases: (1) the PsychINFO
database, which is an abstracting and indexing database with more than 3 million records devoted to peer-reviewed literature in the behavioural sciences and mental health; and (2) the FRANCIS
database, a 2.6 million-record, bibliographic database covering humanities and social-science topics from an international perspective. The
5
Table 1. Summary of key search terms as they were searched in the databases
Terms 1 (themes) Terms 2 (methods)
e.g. depression, satisfaction, victimisation, discrimination, burnout, violence, illness, disease, deaths, elderly, stigma, nursing, negative affect, psychic disorder, cumulative disadvantage, life sequence, work, poverty, precariety, precarious, employability, employment, employment, job, mobility, socialbility, social change, profession, career, wage, earning, labor, occupation, education, school, training, income, social class, wealth, justice, uncertainty, informal economy, migration, retirement, pension, turnover, layoff, informal sector, formal sector, shadow economy, institution, family, fertility, divorce, kinship, gender, marriage, conjugal,
motherhood, father, parent, spouse, couple, partner, childcare, childbearing, childbirth, childless, widow, social participation, social network, social tie, paternity leave, maternity leave, domestic responsibility, domestic task, household
responsibilities, sibling, reconciliation, work-life balance, union formation, cognitive process, learning, memory, attention, motivation, emotion, consciousness, cognitive development, gerontology, interpersonal process, group process, social perception, social representation, social cognition,
psychological disorder, anxiety disorder, job performance, personnel selection, skill, race, intergenerational, daily living condition, social environment, hospitalisation, morality, ability, recreation, welfare, peer groups, longevity, deviant bevavior, equal opportunity, minority, community involvement, isolation, desaffiliation, vulnerability, aging, personality, coping …
optimal matching, sequence analysis, sequence comparison, sequential pattern, sequencing, sequence model, time series, Marcovian, Marcov chain, Markov chain, Marcov model, Marcov model, event history, history, latent growth, latent curve, growth curve, life story, life calendar, diary, biographical, narrative, sequence mining, structural equation, hazard model, survival model, survival analysis, survival data, survival tree, cox model, longitudinal, prospective, retrospective, panel, transition, lifecourse, lifecycle, lifepaths, lifepatterns, lifeskills, lifespan, lifestage, lifestory, lifestress, lifestyle, trajectory, critical episodes, critical incident, critical incident, critical life event, critical life events, critical
movements, critical point, critical state (not "cross-sectional") …
Note. The search syntax was generated in the PSYCHINFO database and adapted for the FRANCIS database. Double extractions of identical articles found in both databases were excluded from the data. English and American spellings were accounted for. Words were truncated in a semi-automatized procedure provided by the SPAD Program to allow for word variation from the root term.
In order to reach the maximum coverage of relevant contributions, the search and extraction of articles has gone far beyond the mere one-step keyword search. The articles retrieved in the initial keyword search have been screened to identify other potentially relevant contributions for this paper and to cover the maximum possible range of methods used to study vulnerability. The initial keyword search in the two databases has resulted in a set of 20,000 articles published in 2,233 journals from all social science fields. Contributions such as literature reviews or other meta-theoretical articles, meta-analyses, short notes, and comments have been excluded. In order to limit the analysed material, we have focused on those journals that published 50% of all articles corresponding to our
6
and ageing, general social science (which includes specific applied studies and other multi-disciplinary journals, such as gender studies), and specialised youth studies. Indeed, the discipline variable was chosen as the main criteria to plot against the original content from the abstracts, because it appeared to be the most useful in identifying emerging disciplinary divides and directions for future research (in contrast to the year variable, which was less informative). In the next section, we present two applications of correspondence analysis: the first one shows how topics which are covered in empirical life course studies and disciplines structure the research field; the second application shows the correspondence between the used methods and the main disciplines. In both models, key terms related to the concept of vulnerability and life stages have been positioned a posteriori in the field space. We then interpret and discuss the results of the correspondence analysis and point to promising future directions for research.
3. Results, interpretation, and
discussion
We explore key research themes of longitudinal and life course studies and show how they are associated with different disciplines and where the concept of ‘vulnerability’ is located within the research field. The salient themes constitute the active row variables; the disciplines presented in Appendix B form the columns of a contingency table. We opted for running the analysis with most frequent repeated segments (e.g., personality disorder) in our extracted abstracts to better capture the meaning of the compound words rather than isolated single words (see also, e.g., Lebart & Mirkin, 1993; Lebart et al., 2010).
In total, 71 salient themes (i.e., repeated segments) were considered for Model 1 (Appendix B). More specifically, our analysis examines the number of times each discipline (column) coincides with particular themes (which corresponds to the value 1 for the nominal variable). It should be emphasised here that correspondence analysis, like similar methods such as principal component analysis and multi-dimensional scaling, neither generates nor requires any notion of causality between variables, instead allowing us to represent the extent to which different discipline categories “correspond” to different salient themes and the
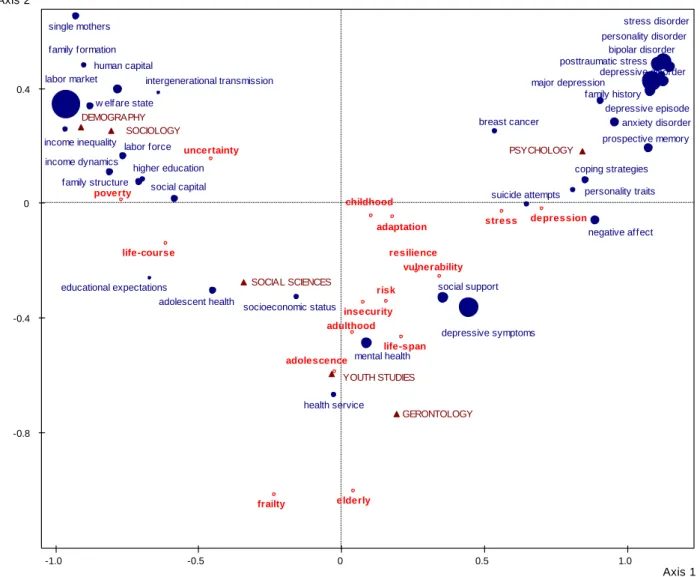
frequency of appearance of these themes in scientific abstracts. To allow for the interpretation of the detailed results, Figure 1 provides a graphical representation of the first two axes and the location of discipline categories and selected research themes in this two-dimensional space. Moreover, selected key terms (words) have been positioned a
posteriori into the graph, depending on their
potential to ease the reading of the graph; for instance, the terms childhood, adolescence, adulthood, and the elderly are indicative of the age spectrum and life course stage of the examined populations. Their computation is executed separately for each one and they do not actively construct the axes (see the boxed elements in Figure 1). Lebart (1992, p. 60) defines those variables that have only an illustrative purpose as supplementary elements.
In this first analysis, the percentages of variance of the eigenvalues were 67.5% and 15.0%, respectively, for the first two axes. Factor three carried only 9.1% of variance, followed by two additional axes with negligible inertias of 4.7% for the fourth, and 3.7% for the fifth. These results suggest a two-factor solution in which 82.5% of the overall variance of our model is explained. The overall structure of the graphical representation suggests an interpretation of the organization of the field along two main dimensions (i.e., the axes in Figure 1). We find that longitudinal and life course studies are well expressed on the first axis on a continuum from a more psychological pole to more sociological, demographic, and general social science research,3 and youth studies. Here psychology loads positively, while all other disciplines load negatively, and gerontology and youth studies take a middle position by adopting either an interdisciplinary or disciplinary approach. It is within this distinction that the difference between themes further accentuates this disciplinary divide.
7
studies that capture individual processes related to macro-structural outcomes (e.g., on mental health, health services, and social support) to individual-level research in which the standard disciplines psychology and social sciences dominate. Most interestingly, none of the salient themes (active variables) indicating the life stage of adulthood entered the most frequent words, while the
opposite was true for younger and older age groups. Thus, we can assume that many abstracts deal with the life stage of adolescence, including children, or the elderly, but omit adulthood as an important stage in the life course. We briefly describe and discuss these key dimensions of longitudinal and life course research within disciplines below.
Figure 1. Simultaneous representation in correspondence analysis of disciplines (active column
variables) and themes (active row variables)
Themes in psychology
In psychology, research focused, to a large extent, on vulnerable individuals suffering from bipolar disorder, depressive episodes, post-traumatic stress, or personality disorder5. Within the discipline we can further distinguish clinical studies and social psychological studies that are closely related to life-span psychology. One can also
note that the life-span psychology is closely associated with older ages, as could be expected from its historical origins.
Themes in sociology and demography
General themes in sociology and demography focused on family formation, education (human capital), the labour market, and the welfare state.
-1.0 -0.5 0 0.5 1.0
-0.8 -0.4 0 0.4
Axis 1 Axis 2
adolescent health
anxiety disorder bipolar disorder
breast cancer
coping strategies depressive disorder
depressive episode
depressive symptoms educational expectations
family formation
family history
family structure
health service higher education
human capital
income dynamics income inequality
intergenerational transmission
labor force
labor market major depression
mental health
negative affect personality disorder
personality traits posttraumatic stress
prospective memory single mothers
social capital
social support
socioeconomic status
stress disorder
suicide attempts w elfare state
DEMOGRAPHY SOCIOLOGY
SOCIAL SCIENCES
YOUTH STUDIES
PSYCHOLOGY
GERONTOLOGY adaptation
adolescence adulthood
childhood
depression
elderly frailty
insecurity life-course
life-span poverty
resilience
risk
stress uncertainty
8
The position of life course research in the vector space showed its proximity to its American roots and its disciplinary openness for social science disciplines, such as sociology and demography, and applied research, primarily labour market and youth studies (including research on childhood).
Themes in gerontology
We found that gerontological abstracts strongly determined the second axis, as expressed by a naturally clear dedication to studying people in old age. Thus, abstracts in gerontology often studied frailty in old age and health services rather than all other life stages.
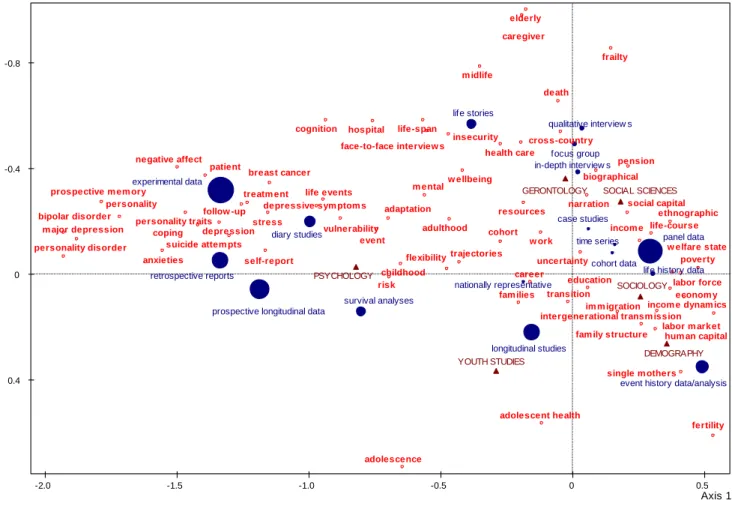
In Model 2 we explore, using the same data set, how common forms of data (active row variables) are associated with disciplines (active column variables), where the frequencies for the number of times each discipline coincides with particular forms of data (Figure 2; Appendix C). In total, 17 salient forms of data or methods entered our second model. For example, the input data would list the number of times one discipline would be related to a specific form of data, such as experimental data or panel data, and would also contain the same information for all other disciplines. For the column variables, ‘psychology’ determines almost 70% of the first axis, and only 0.3% of the second axis; for sociology, the corresponding values would be 15.4% and 6.0%. The second axis represents social sciences (35.9%), youth studies (27.0%), and gerontology (18.5%). For the row variables, we observe that data forms such as experimental data (indicated by the repeated segment ‘control group’) determine 20.8% of the first axis and only 4.3% of the second, while longitudinal data, life stories, and qualitative data mainly contribute to the second axis (the corresponding contributions are 32.1%, 17.5%, and 6.7%).
This second analysis also results in a two-factor solution: the first factor explains 65.1% of the model variance, followed by 17.9% for the second (see also Appendix C). The other three axes carry altogether less than 20% of the total variance; thus, they are dropped from the analyses and graphical representation. The overall structure of the graphical representation suggests an interpretation of the field structure along two main dimensions
(i.e., axes in Figure 2). We find that the first axis spreads along a continuum that ranges from the analysis of small samples, corresponding, for instance, to experimental designs on the one end to the analyses of larger samples using panel data and event history data on the other. We observe that the disciplines of psychology and sociology explain most of the variance of the first axis, while social sciences, gerontology, and youth studies make up for most of the variance of the second axis. We recall that, in Model 1, the first axis represented the disciplinary divide. Model 2 supports the findings from Model 1 by showing that this disciplinary distinction between psychology and sociology is, to some extent, driven by the data and methods used. For example, experimental data mainly used in psychology loads negatively (in the coordinates section, column 1), while panel data and all other structural forms of data load positively. In addition, we account for the different terminology used for the same analysis techniques in various disciplines. For instance, survival analyses techniques are specifically designed to estimate risks (in the lower-left quadrant, Figure 2) and are used as a synonym for event history models that are more common in sociology (in the lower-right quadrant, Figure 2). The second axis, which explains considerably less of the model variance (17.9%), aligns research areas with the use of particular data that are used to analyse relevant phenomena in the respective fields.
Oppositions among disciplines
9
Figure 2. Simultaneous representation of correspondence analysis of disciplines (active column
variables) and data forms (active row variables)
Data used across disciplines
Longitudinal data, life history, nationally representative surveys, time series, and cohort studies in particular are more likely to be equally employed across disciplines, though their relative weight varies substantially (with the cohort data label being far more employed than the life history label). However, both models show that each discipline may be more focused on specific social phenomena and mechanisms (micro vs. macro). Model 2 also shows that only the second and less important axis differentiates very specific data formats. There is a concentration of individual-level data in the upper part of the graph, where we find diary studies and experimental data (mainly used in disciplinary sub-fields, such as life-span psychology), but also micro qualitative data such as life stories, focus groups, in-depth interviews, and case study designs (mostly in gerontology and social sciences). Towards the centre of the graph, at the crossroad of the axes, we find, instead, the data formats that are most commonly used by all disciplines, such as
cohort and life history data and longitudinal data from nationally representative surveys. The proximity of terms such as retrospective and prospective datasets to psychology and of event history and survival analysis to demography, respectively, seem to reflect labelling habits for similar data formats. All in all, the field provides evidence that longitudinal data especially facilitates the use of common methods of causal modelling. Finally, to aid interpretation, we highlighted some key concepts being illustrative variables and thus having a contribution of 0 for the construction of the vector space of model 2. This enabled us to locate the key concepts between the prior identified spectrum of disciplines. The psychology pole is characterized by four main concepts: personality, disorder, depression, and coping. This result corroborates another analysis of social psychology literature performed by Spini, Elcheroth, & Figini (2008), which showed that personality was a main field of social psychology analysing individual development. On the sociological pole,
-2.0 -1.5 -1.0 -0.5 0 0.5
-0.8 -0.4 0 0.4 Axis 1 Axis 2
event history data/analysis life history data life stories panel data survival analyses cohort data case studies experimental data diary studies focus group in-depth interview s
longitudinal studies nationally representative
prospective longitudinal data
qualitative interview s
retrospective reports time series PSYCHOLOGY SOCIOLOGY SOCIAL SCIENCES DEMOGRAPHY GERONTOLOGY YOUTH STUDIES anxieties coping depression follow -up patient personality self-report stress treatm ent bipolar disorder breast cancer
depressive sym ptom s
m ajor depression
negative affect
personality disorder
personality traits prospective m em ory
suicide attem pts
adaptation adolescence adulthood care caregiver childhood cognition cohort cross-country death education elderly event flexibility frailty health hospital life-course life-span m ental m idlife risk trajectories vulnerability w ellbeing w ork resources adolescent health fam ilies life events biographical career econom y ethnographic face-to-face interview s
fertility incom e narration pension transition uncertainty
fam ily structure hum an capital incom e dynam ics intergenerational transm ission
labor force
labor m arket
single m others social capital
w elfare state poverty
10
we find other concepts like poverty, migration, the labour market, education, welfare, families, work, transition, and life course. On the top of Figure 2, we find concepts associated with the elderly: frailty, life span, health care, cognition, and pension. We clearly find here main issues related to the gerontological field and the overarching theme of frailty, which can be defined as a health syndrome of decreased reserves and resistance to stressors, resulting from senescence, which is associated with a lack of resilience that affects individuals’ capacity to recover from loss (Spini, Ghisletta, Guilley, & Lalive d’Epinay, 2007).
The concept of vulnerability, even if it stands closer to the psychological pole, has an intermediate position between the three poles (psychology, sociology, and gerontology). It is associated with the concepts of adaptation, events, trajectories, and flexibility, and the methods of daily diaries and longitudinal studies. Concerning age stages, both childhood and adulthood are closely associated with vulnerability.
4. Summary and directions for future
research
This paper has two aims. One is to report on the structure that emerges from scientific life course research and related areas. For that purpose, we have focused on scientific journal abstracts of the year 2000 and after. The other aim is to provide a sense of the disciplinary diversity of the field and and to make a brief assessment of the value that the ‘vulnerability’ concept may have in the study of human lives.
In highlighting the structure in terms of research themes that emerge from scientific life course research, our findings corroborate the argument that psychological and sociological traditions remain separated when it comes to examining issues related to vulnerability—and this is best exemplified by scientific output in life course sociology and life-span psychology (Mayer, 2009); these disciplines structure the two poles of the main axis of the correspondence analysis. The third pole is represented by gerontology, which covers the fields of ageing studies and youth studies, drawing from all the leading disciplines of the social sciences. Among the life stages—childhood, adolescence, adulthood (including midlife), and old age—we found that adulthood was the least invested period of life, whereas younger and older
ages were heavily studied. In particular, many life course sociologists and lifespan psychologists have considered early and late adulthood as marked by critical transitions and events (e.g., labour market entry, transition to marriage and parenthood, entry into retirement), but thought of middle adulthood as a less turbulent period. Yet, the ‘tripartite’ life course is eroding and ‘adulthood’ as a life stage will need to be re-defined. Lives are increasingly interwoven with one another, life course transitions get postponed, unions dissolve, migration trajectories increase, and generally—with the biographization of the life course—middle adulthood will certainly deserve more attention in the future.
In exploring the emergent structure of a discipline in terms of longitdudinal data and methods, this paper observes a clear divide concerning data and methods employed according to the field of study and the discipline. Prospective longitudinal studies, experimental data, and retrospective reports are clustering around the psychological pole, while household panel data, national surveys, and event history analysis are more specific for the socio-demographic pole. Gerontology appears to be more associated with qualitative methods than other poles: life stories, focus groups, and in-depth interviews. Finally, let us note that longitudinal studies, which clearly form an overarching category, bridge the discursive and theoretical spaces between psychology, geron-tology, and sociology, showing that all three disciplines are concerned with longitudinal studies. In this regard, the distinction between panel studies and prospective studies may actually denote only one type of study, that is named differently in the respective traditions.
11
orienting their empirical work towards vulnerability, for at least four key reasons.
a) First, vulnerability is a micro as well as a macro concept. We can talk about individual vulnerabilities and population vulnerabilities. It also allows us to model population behaviour as individual and group responses to structural forces (e.g., changed risk structures) and normative pressures. Central to the concept of vulnerability is the idea of how individuals, groups, and entire populations can adapt to life circumstances, overcome adversities, or recover from them by making use of resources they have or that are made accessible to them. As such, adopting the vulnerability concept can help bridge the disciplinary divide between, in particular, psychological life-span and sociological life course research, and can enhance the perspectives also of demographic researchers by providing a balanced approach integrating individual, group, and macro frames.
b) Second, vulnerability has a static and a
dynamic dimension (Spini et al., 2013). Its dynamic dimension provides social scientists with a heuristic to deal with dominant claims, mainly from life course sociologists, that human lives have become de-institutionalized through the internalization of rules and norms of conduct and behaviour. If structural contexts (institutional conditions) are shaping individual cognitive biographical scripts that guide behaviour and that exert more and more impact within individuals as they advance in age (Kohli, 2007), the study of vulnerability allows a dynamic multi-level approach. For instance, various demographic behaviours (e.g., fertility, mortality, and migration) can be modelled by assigning time-varying, life course, and group-specific weights to individual characteristics, ideational factors, and institutional conditions.
c) Third, analysing different forms of behaviour (social, economic, and demographic) and their
outcomes benefits from the increasing availability of longitudinal individual-level data covering multiple life-stages and life-domains (e.g., education, work, family, retirement, and health). Though not exhaustive, various countries provide longitudinal data for cross-national comparison, such as Great Britain (BHPS—British Household Panel), Germany (GSOEP—German Socio-economic Panel), Switzerland (SHP—Swiss Household Panel), and the United States (The Panel Study of Income Dynamics, PSID). Here, the ‘vulnerability’ concept may prove a useful tool for a two- to three-country comparison rather than a simplified tool often required to enable aggregating a larger number of institutional regime types. Vulnerability may be modelled to develop country-specific causal effects with the purpose to propose preventive policy implications and recommendations.
d) Fourth, vulnerability is commonly researched across disciplines. Health topics emerged most recently, which are closely related to morbidity and mortality. Main emerging research tracks concern the relationship between early conditions and later life health and mortality, as well as the variation of health of specific sub-groups in the population, and mortality risks by social class. Integrating the concept of ‘vulnerability’ in such research streams seems to be more promising than following discipline-specific approaches stressing either individual factors (such as age-specific risks) or structural factors (e.g., socio-economic determinants of health inequalities) for population studies. The fact that vulnerability accumulates across generations (Spini et al., 2007) makes it valuable for research on inter-generational transfers (as well as limited transfer or lack of transfer due to geographical mobility or parents’ separation). Inter-generational vulnerability hence can be analysed as an individual or group (i.e., couple, family, or ethnic minority) response to existing social structures and chances of mobility.
Acknowledgements
12
Appendix A
List of journals and number of selected articles
social science and medicine 646
journal of affective disorders 332
journal of marriage and family 308
journal of youth and adolescence 208
reflections: narratives of professional helping 199
journal of adolescent health 195
developmental psychology 183
personality and individual differences 162
social indicators research 158
the journals of gerontology. series b, psychological sciences and social sciences 153
social forces 148
journal of family psychology 146
journal of family issues 143
journal of psychosomatic research 136
children and youth services review 135
social science research 127
journal of personality and social psychology 116
social science quarterly 113
qualitative inquiry 112
health psychology (hillsdale, n.j.) 112
demography 108
journal of adolescence 103
european sociological review 96
journal of applied psychology 95
journal of health and social behavior 93
journal of abnormal psychology (1965) 90
american sociological review 90
psychology and aging 89
forum qualitative sozialforschung/forum: qualitative social research 88
journal of educational psychology 88
the gerontologist 85
ageing and society 85
journal of research on adolescence 83
international journal of behavioral development (print) 76
social science and medicine (1982) 71
sociology of health and illness 71
journal of traumatic stress 70
research on aging 69
sex roles: a journal of research 69
demographic research 68
journal of social and personal relationships 67
13
aids care 66
journal of personality 65
american journal of community psychology 63
sociological research online 61
sociology of education 60
family relations 60
industrial and labor relations review 57
aids and behavior 57
women's studies international forum 56
american journal of sociology 54
british journal of health psychology 54
journal of social and clinical psychology 54
journal of adolescent research 53
social problems 52
journal of occupational and organizational psychology 52
sex roles 52
international journal of sociology 51
the sociological quarterly 51
labour 50
international journal of aging and human development 50
sociology 50
families in society 50
the british journal of social work 49
marriage and family review 49
british journal of educational psychology 49
journal of family and economic issues 48
the journal of development studies 47
population research and policy review 47
gender and education 47
journal of youth studies 47
kolner zeitschrift fur soziologie und sozialpsychologie 47
work and stress 46
american behavioral scientist 46
british journal of sociology of education 46
journal of biosocial science 46
journal of personality disorders 45
journal of aging and health 45
journal of counseling psychology 45
qualitative research 45
journal of applied developmental psychology 44
reflections 44
population studies 44
journal of behavioral medicine 43
family process 43
14
european journal of population/revue europeenne de demographie 42
zeitschrift fur soziologie 42
psychology, health and medicine 42
journal of ethnic and migration studies 42
women and health 41
journal of aging studies 41
quality and quantity 41
the journal of socio-economics 41
youth and society 41
world development 41
journal of family violence 41
social service review 41
social work research 40
international journal of social research methodology 39
journal of comparative family studies 39
historical social research/historische sozialforschung 39
sociological methods and research 39
journal of social history 38
journal of contemporary ethnography 38
research on social work practice 38
advances in life course research 38
social behavior and personality 37
work, employment and society 37
journal of sociology and social welfare 37
sociological perspectives 37
memory and cognition 36
race, ethnicity and education 36
qualitative social work 36
research in social stratification and mobility 35
gender, place and culture 35
social psychology quarterly 35
canadian journal on aging/la revue canadienne du vieillissement 35
british journal of clinical psychology 34
the annals of the american academy of political and social science 34
psychosomatics (washington, dc) 34
journal of anxiety disorders 34
journal of community and applied social psychology 34
industrial relations 33
journal of divorce and remarriage 33
signs 33
health 33
health and social care in the community 33
adolescence 33
international migration review 32
15
revista espanola de investigaciones sociologicas 32
deviant behavior 32
sociological quarterly 31
sociological spectrum 31
studies in symbolic interaction 31
stress and health 31
international migration 30
longitudinal surveys of australian youth 30
international journal of intercultural relations 30
journal of health psychology 30
psychological assessment 30
journal of social policy 30
psychopathology 30
qualitative report 29
child and family social work 29
european psychologist 29
ethnography 29
sociology of sport journal 29
social identities 28
the sociological review 28
social work in health care 28
work and occupations 28
aids education and prevention 28
sociological forum 28
women's studies quarterly 27
acta sociologica 27
culture and psychology 27
schmollers jahrbuch 27
anthropology and medicine 27
women's history review 27
qualitative sociology 27
journal of aggression, maltreatment and trauma 27
international journal of social welfare 27
applied cognitive psychology 27
gender and society 27
canadian studies in population 27
16
Appendix B
SIMPLE CORRESPONDENCE ANALYSIS EIGENVALUES
COMPUTATIONS PRECISION SUMMARY: TRACE BEFORE DIAGONALISATION. 0.7277 SUM OF EIGENVALUES... 0.7277
FIRST 5 EIGENVALUES NUMBER
EIGEN-VALUE
PERCENT-AGE
CUMULATED PERCENTAGE
1 0.4909 67.46 67.46
2 0.1094 15.03 82.49
3 0.066 9.08 91.57
4 0.0343 4.71 96.28
5 0.0271 3.72 100
Khi-2 TEST FOR AXIS CHOICE
(USING USUAL THRESHOLD, YOU CAN GO TO THE FIRST TEST-VALUE > 2.0) NUMBER OF AXES STAT
KHI2
DEG. OF FREEDOM
PROB. X>KHI2
TEST VALUE
1 2571.61 272 0 -41.11 *
2 1383.57 201 0 -28.22 *
COORDINATES, CONTRIBUTIONS OF FREQUENCIES ON AXES 1 TO 2 ACTIVE
FREQUENCIES
FREQUENCIES COORDINATES CONTRIBU- TIONS
SQUARED COSINES IDEN - SHORT
LABEL
REL.WT DISTO 1 2 1 2 1 2
m1 - 1 36.45 0.74 0.84 0.18 52.60 10.90 0.96 0.04
m2 - 2 27.20 0.75 -0.81 0.25 36.00 15.90 0.87 0.09
m3 - 3 17.80 0.33 -0.34 -0.27 4.30 12.30 0.35 0.23
m4 - 4 3.90 1.78 -0.91 0.27 6.60 2.50 0.47 0.04
m5 - 5 6.43 0.91 0.19 -0.74 0.50 31.90 0.04 0.60
m7 - 7 8.22 0.82 -0.04 -0.59 0.00 26.50 0.00 0.43
SUPPLEMENTARY FREQUENCIES
FREQUENCIES COORDINATES CONTRIBU-TIONS
SQUARED COSINES IDEN - SHORT
LABEL
REL.WT DISTO 1 2 1 2 1 2
m1 - 2000 3.32 0.89 -0.49 -0.07 0.00 0.00 0.27 0.01
m2 - 2001 7.03 0.34 0.00 0.14 0.00 0.00 0.00 0.06
m3 - 2002 6.76 0.22 -0.05 -0.05 0.00 0.00 0.01 0.01
17
m5 - 2004 8.74 0.16 0.05 -0.02 0.00 0.00 0.02 0.00
m6 - 2005 9.73 0.12 0.05 -0.04 0.00 0.00 0.02 0.02
m7 - 2006 11.47 0.16 -0.03 -0.04 0.00 0.00 0.01 0.01
m8 - 2007 12.15 0.11 0.02 -0.01 0.00 0.00 0.00 0.00
m9 - 2008 12.92 0.16 0.11 0.02 0.00 0.00 0.07 0.00
m10 - 2009 9.82 0.30 -0.31 -0.17 0.00 0.00 0.31 0.10
m11 - 2010 13.21 0.23 0.23 0.01 0.00 0.00 0.24 0.00
m6 - 6 2.41 5.43 -0.21 -0.70 0.00 0.00 0.01 0.09
COORDINATES, CONTRIBUTIONS AND SQUARED COSINES OF CASES ACTIVE CASES (AXES 1 TO 2)
CASES COORDINATES CONTRIBUTIONS SQUARED COSINES
IDENTIFIER REL.WT. DISTO 1 2 1 2 1 2
adolescent health 3.47 1.01 -0.45 -0.31 1.40 3.00 0.20 0.09
anxiety disorder 1.29 1.04 0.96 0.28 2.40 0.90 0.88 0.08
bipolar disorder 1.72 1.52 1.13 0.49 4.50 3.80 0.84 0.16
black women 0.52 1.19 -0.91 0.47 0.90 1.00 0.70 0.19
breast cancer 1.30 0.52 0.54 0.25 0.80 0.70 0.55 0.12
coping strategies 1.20 0.74 0.85 0.08 1.80 0.10 0.98 0.01
depressive disorder 0.99 1.47 1.13 0.42 2.50 1.60 0.86 0.12
depressive episode 1.21 1.36 1.08 0.39 2.90 1.70 0.86 0.11
depressive symptoms
9.87 0.36 0.45 -0.37 4.00 12.10 0.56 0.38
economic resources 0.48 0.79 -0.83 0.21 0.70 0.20 0.88 0.06
education longitudinal
0.55 0.76 -0.76 0.19 0.70 0.20 0.76 0.05
educational attainment
2.53 0.23 -0.45 0.09 1.10 0.20 0.90 0.04
educational expectations
0.50 1.99 -0.67 -0.26 0.50 0.30 0.23 0.04
european community
0.62 1.27 -1.00 0.37 1.30 0.80 0.79 0.11
european countries 0.46 0.91 -0.82 0.29 0.60 0.40 0.74 0.09
family background 0.62 0.54 -0.71 0.09 0.60 0.10 0.92 0.02
family formation 0.54 1.15 -0.90 0.48 0.90 1.10 0.70 0.20
family history 0.77 0.95 0.91 0.36 1.30 0.90 0.86 0.13
family life 0.64 0.34 -0.54 0.02 0.40 0.00 0.85 0.00
family structure 1.92 0.55 -0.71 0.07 2.00 0.10 0.91 0.01
force participation 0.72 1.19 -0.96 0.49 1.40 1.60 0.78 0.20
health service 1.18 0.69 -0.03 -0.67 0.00 4.80 0.00 0.65
higher education 1.34 0.65 -0.69 0.08 1.30 0.10 0.74 0.01
household income 0.69 0.63 -0.75 0.07 0.80 0.00 0.89 0.01
18
income dynamics 1.59 0.78 -0.81 0.11 2.10 0.20 0.84 0.01
income inequality 0.60 1.27 -0.96 0.26 1.10 0.40 0.73 0.05
intergenerational transmiss.
0.56 0.68 -0.64 0.38 0.50 0.70 0.60 0.22
job demands 0.50 1.46 1.12 0.44 1.30 0.90 0.86 0.14
labor force 1.56 0.73 -0.76 0.16 1.80 0.40 0.80 0.04
labor market 4.81 1.08 -0.96 0.34 9.00 5.20 0.86 0.11
life expectancy 0.48 2.35 -0.61 -0.39 0.40 0.60 0.16 0.06
living arrangements 0.72 1.09 -0.66 -0.41 0.60 1.10 0.40 0.15
major depression 2.38 1.37 1.09 0.43 5.70 3.90 0.86 0.13
married women 0.66 0.67 -0.72 0.22 0.70 0.30 0.76 0.08
mean age 1.55 0.73 0.58 -0.38 1.00 2.10 0.46 0.20
mental health 6.87 0.26 0.09 -0.49 0.10 15.10 0.03 0.93
mental illness 0.69 0.36 -0.32 0.01 0.10 0.00 0.28 0.00
middle class 1.13 0.76 -0.70 0.18 1.10 0.30 0.64 0.04
negative affect 1.79 0.93 0.89 -0.06 2.90 0.10 0.85 0.00
negative effect 1.68 0.25 -0.40 0.22 0.60 0.80 0.66 0.21
outcome measures 0.85 0.91 0.91 0.25 1.40 0.50 0.91 0.07
parental divorce 0.54 0.66 -0.63 0.07 0.40 0.00 0.61 0.01
partially mediated 0.85 0.67 0.75 0.01 1.00 0.00 0.85 0.00
personality disorder
1.55 1.47 1.11 0.48 3.90 3.30 0.83 0.16
personality traits 1.04 0.67 0.81 0.04 1.40 0.00 0.97 0.00
positive effect 1.57 0.24 -0.40 0.19 0.50 0.50 0.65 0.15
posttraumatic stress
0.95 1.54 1.15 0.47 2.50 1.90 0.85 0.14
prospective memory
0.91 1.27 1.07 0.19 2.10 0.30 0.91 0.03
psychological association
0.79 1.74 1.20 0.55 2.30 2.20 0.83 0.17
rating scale 0.58 1.43 1.12 0.42 1.50 0.90 0.88 0.12
rural areas 0.43 1.23 -0.60 -0.24 0.30 0.20 0.29 0.05
single mothers 0.67 1.44 -0.93 0.65 1.20 2.60 0.60 0.29
social assistance 0.42 1.55 -1.01 0.43 0.90 0.70 0.66 0.12
social capital 2.64 0.52 -0.58 0.01 1.80 0.00 0.65 0.00
social change 0.61 0.58 -0.59 0.17 0.40 0.20 0.60 0.05
social class 1.35 0.36 -0.40 -0.14 0.40 0.20 0.44 0.05
social networks 2.04 0.21 -0.32 -0.23 0.40 1.00 0.50 0.26
social services 0.24 0.97 -0.45 -0.67 0.10 1.00 0.21 0.46
social support 6.65 0.33 0.36 -0.33 1.70 6.60 0.38 0.33
socioeconomic status
2.70 0.16 -0.16 -0.33 0.10 2.70 0.15 0.67
stress disorder 0.91 1.53 1.13 0.50 2.40 2.10 0.83 0.16
19
suicide attempts 1.11 0.57 0.65 0.00 1.00 0.00 0.73 0.00
symptom severity 0.48 1.46 1.10 0.47 1.20 1.00 0.84 0.15
united states 2.77 0.31 -0.49 -0.12 1.30 0.40 0.77 0.05
welfare recipients 0.35 0.55 -0.62 0.17 0.30 0.10 0.70 0.05
welfare state 0.84 0.98 -0.88 0.34 1.30 0.90 0.79 0.12
west germany 0.56 2.55 -0.85 0.30 0.80 0.50 0.29 0.04
young men 0.75 0.52 -0.62 -0.10 0.60 0.10 0.75 0.02
SUPPLEMENTARY CASES (AXES 1 TO 2)
CASES COORDINATES CONTRIBUTIONS SQUARED COSINES
IDENTIFIER REL.WT. DISTO 1 2 1 2 1 2
adaptation 3.04 0.05 0.18 -0.05 0.00 0.00 0.69 0.05
adolescence 44.33 1.86 -0.02 -0.59 0.00 0.00 0.00 0.19
adult 27.77 0.31 0.04 -0.45 0.00 0.00 0.01 0.65
anxieties 9.25 0.74 0.84 0.15 0.00 0.00 0.95 0.03
biographical 5.36 0.45 -0.44 -0.08 0.00 0.00 0.44 0.01
care 19.17 0.77 -0.10 -0.75 0.00 0.00 0.01 0.74
career 5.52 0.21 -0.35 0.23 0.00 0.00 0.58 0.26
caregiver 7.48 3.15 0.06 -1.10 0.00 0.00 0.00 0.38
childhood 9.16 0.06 0.10 -0.05 0.00 0.00 0.18 0.03
clinical 9.72 0.55 0.70 0.13 0.00 0.00 0.89 0.03
cognition 11.17 1.28 0.53 -0.54 0.00 0.00 0.22 0.23
cohort 9.95 0.11 -0.16 -0.24 0.00 0.00 0.24 0.52
coping 9.01 0.58 0.76 0.07 0.00 0.00 0.99 0.01
cross-country 0.64 0.41 -0.26 -0.30 0.00 0.00 0.17 0.22
cross-cultural 0.44 0.36 0.50 0.21 0.00 0.00 0.68 0.13
cross-section 1.25 0.09 0.26 0.05 0.00 0.00 0.76 0.02
death 4.32 0.80 -0.19 -0.51 0.00 0.00 0.05 0.33
demographic 5.29 0.51 -0.13 -0.12 0.00 0.00 0.04 0.03
depression 40.75 0.49 0.70 -0.02 0.00 0.00 1.00 0.00
disorder 15.92 1.09 0.98 0.32 0.00 0.00 0.88 0.10
divorce 6.99 0.51 -0.63 0.31 0.00 0.00 0.78 0.19
economy 14.04 0.68 -0.78 0.23 0.00 0.00 0.89 0.08
education 27.88 0.26 -0.50 -0.03 0.00 0.00 0.97 0.00
ehist 2.10 1.60 -0.93 0.40 0.00 0.00 0.54 0.10
elderly 4.01 2.93 0.04 -1.01 0.00 0.00 0.00 0.35
episode 4.92 0.74 0.84 0.17 0.00 0.00 0.96 0.04
ethnographic 2.31 0.84 -0.75 0.16 0.00 0.00 0.67 0.03
event 10.52 0.05 0.20 0.03 0.00 0.00 0.83 0.02
face-to-face 0.47 1.06 0.21 -0.66 0.00 0.00 0.04 0.41
families 46.34 0.12 -0.30 -0.01 0.00 0.00 0.74 0.00
20
fertility 4.19 7.89 -0.95 0.54 0.00 0.00 0.12 0.04
flexibility 1.22 0.11 -0.08 0.30 0.00 0.00 0.06 0.80
follow-up 6.62 0.45 0.66 -0.12 0.00 0.00 0.96 0.03
frail 0.87 3.41 -0.24 -1.02 0.00 0.00 0.02 0.30
graduate 1.39 0.40 -0.45 0.26 0.00 0.00 0.50 0.18
health 57.61 0.41 -0.06 -0.55 0.00 0.00 0.01 0.74
hiv-related 1.69 0.82 0.14 -0.33 0.00 0.00 0.02 0.14
hospital 4.59 0.42 0.34 -0.40 0.00 0.00 0.27 0.39
household 10.95 0.60 -0.67 0.00 0.00 0.00 0.74 0.00
immigration 8.87 1.27 -0.72 0.14 0.00 0.00 0.41 0.01
income 13.20 0.51 -0.65 -0.03 0.00 0.00 0.82 0.00
individual-level 1.08 0.33 -0.44 -0.16 0.00 0.00 0.58 0.08
labor 11.72 1.03 -0.91 0.41 0.00 0.00 0.80 0.16
lifco 4.99 0.41 -0.61 -0.14 0.00 0.00 0.91 0.05
lifsp 0.79 0.63 0.21 -0.47 0.00 0.00 0.07 0.35
lihist 2.22 0.50 -0.69 0.01 0.00 0.00 0.96 0.00
listo 1.22 0.37 0.03 -0.45 0.00 0.00 0.00 0.55
manic 1.88 1.74 1.20 0.55 0.00 0.00 0.83 0.17
market 7.03 1.05 -0.95 0.36 0.00 0.00 0.86 0.12
marriage 15.29 0.58 -0.60 0.32 0.00 0.00 0.62 0.18
mental 10.69 0.17 0.11 -0.37 0.00 0.00 0.07 0.81
midlife 1.35 1.14 0.09 -0.60 0.00 0.00 0.01 0.32
migration 9.74 2.49 -0.93 0.33 0.00 0.00 0.35 0.04
narration 24.76 0.36 -0.44 -0.05 0.00 0.00 0.54 0.01
partnership 12.07 0.05 0.08 -0.06 0.00 0.00 0.15 0.07
patient 20.78 0.68 0.76 0.12 0.00 0.00 0.86 0.02
pension 0.73 1.47 -0.47 -0.36 0.00 0.00 0.15 0.09
personality 8.77 1.07 0.99 0.28 0.00 0.00 0.92 0.07
poverty 5.86 0.88 -0.77 0.01 0.00 0.00 0.67 0.00
professionals 5.30 0.29 -0.31 -0.34 0.00 0.00 0.33 0.39
reports 24.18 0.26 0.26 -0.31 0.00 0.00 0.26 0.38
self-report 5.73 0.38 0.55 -0.19 0.00 0.00 0.80 0.10
services 9.50 0.61 -0.15 -0.70 0.00 0.00 0.04 0.82
sociological 4.86 1.35 -0.93 0.42 0.00 0.00 0.64 0.13
stress 16.65 0.34 0.56 -0.03 0.00 0.00 0.92 0.00
survey 19.62 0.27 -0.40 -0.13 0.00 0.00 0.61 0.06
trajectories 7.06 0.16 -0.05 -0.34 0.00 0.00 0.01 0.70
transition 11.12 0.26 -0.44 -0.07 0.00 0.00 0.74 0.02
treatment 13.85 0.45 0.61 0.11 0.00 0.00 0.83 0.02
uncertain 1.29 0.40 -0.46 0.15 0.00 0.00 0.52 0.06
vulnerability 3.61 0.22 0.35 -0.26 0.00 0.00 0.55 0.31
21
CASES COORDINATES CONTRIBUTIONS SQUARED COSINES
IDENTIFIER REL.WT. DISTO 1 2 1 2 1 2
welfare 7.13 0.62 -0.66 -0.04 0.00 0.00 0.69 0.00
work 42.69 0.16 -0.33 0.05 0.00 0.00 0.68 0.02
birth cohort 0.85 0.36 -0.53 -0.12 0.00 0.00 0.80 0.04
case studies 0.41 0.30 -0.47 0.00 0.00 0.00 0.71 0.00
control group 0.95 0.59 0.73 0.00 0.00 0.00 0.89 0.00
daily diary 0.64 0.20 0.41 0.05 0.00 0.00 0.85 0.01
first birth 0.55 6.21 -0.86 0.44 0.00 0.00 0.12 0.03
focus group 0.99 0.58 -0.32 -0.44 0.00 0.00 0.18 0.33
household panel 1.66 0.84 -0.87 0.12 0.00 0.00 0.91 0.02
in-depth interviews 1.07 0.35 -0.38 -0.18 0.00 0.00 0.40 0.09
later life 0.99 4.68 0.08 -1.18 0.00 0.00 0.00 0.30
life events 2.39 0.20 0.40 -0.13 0.00 0.00 0.83 0.09
logistic regression 2.75 0.52 0.05 -0.63 0.00 0.00 0.01 0.76 longitudinal studies 7.80 0.08 -0.17 -0.02 0.00 0.00 0.39 0.00 multiple regression 0.89 0.27 0.46 -0.24 0.00 0.00 0.77 0.22 national longitudinal 6.75 0.55 -0.58 -0.04 0.00 0.00 0.60 0.00
national survey 0.86 0.60 -0.69 0.09 0.00 0.00 0.80 0.01
panel survey 1.49 0.60 -0.64 -0.18 0.00 0.00 0.68 0.05
prospective cohort 0.68 0.43 0.42 -0.27 0.00 0.00 0.42 0.17
prospective longitudinal
0.90 0.39 0.53 -0.06 0.00 0.00 0.71 0.01
prospective studies 0.49 1.04 0.96 0.32 0.00 0.00 0.89 0.10
qualitative interviews
0.50 0.66 -0.33 -0.47 0.00 0.00 0.16 0.33
regression analyses 2.08 0.30 0.33 -0.31 0.00 0.00 0.36 0.33 retrospective
reports
0.59 0.53 0.64 0.28 0.00 0.00 0.77 0.15
social work 1.14 0.67 -0.69 -0.01 0.00 0.00 0.70 0.00
socio-economic panel
1.05 1.03 -0.85 0.06 0.00 0.00 0.70 0.00
time series 1.92 0.47 -0.57 0.17 0.00 0.00 0.68 0.06
young adulthood 2.03 1.64 -0.04 -0.57 0.00 0.00 0.00 0.19
young people 3.43 1.55 -0.39 -0.50 0.00 0.00 0.10 0.16
22
Appendix C
SIMPLE CORRESPONDENCE ANALYSIS EIGEN-VALUES
COMPUTATIONS PRECISION SUMMARY: TRACE BEFORE DIAGONALISATION.. 0.2511
SUM OF EIGENVALUES... 0.2511
HISTOGRAM OF THE FIRST 5 EIGENVALUES NUMBER EIGEN-
VALUE
PERCENT- AGE
CUMUL-ATED
PERCENT-AGE
1 0.1636 65.14 65.14
2 0.045 17.93 83.07
3 0.0282 11.25 94.32
4 0.0075 2.99 97.31
5 0.0067 2.69 100
Khi-2 TEST FOR AXIS CHOICE
(USING USUAL THRESHOLD, YOU CAN GO TO THE FIRST TEST-VALUE > 2.0)
NUMBER STAT DEG. OF PROB. TEST OF AXIS KHI2 FREEDOM X>KHI2 VALUE
1 471.61 60 0 -17.01 *
COORDINATES, CONTRIBUTIONS OF FREQUENCIES ON AXES 1 TO 2
FREQUENCIES COORDINATES CONTRIBU- TIONS
SQUARED COSINES IDEN - SHORT
LABEL
REL.WT DISTO 1 2 1 2 1 2
m1 - 1 16.76 0.70 -0.82 -0.03 69.10 0.30 0.97 0.00
m2 - 2 38.16 0.08 0.26 0.08 15.40 6.00 0.81 0.09
m3 - 3 21.55 0.13 0.18 -0.27 4.30 35.90 0.26 0.59
m4 - 4 8.07 0.33 0.36 0.26 6.30 12.40 0.39 0.21
m5 - 5 6.33 0.22 -0.03 -0.36 0.00 18.50 0.00 0.60
m7 - 7 9.13 0.39 -0.29 0.36 4.70 27.00 0.22 0.34
SUPPLEMENTARY FREQUENCIES
FREQUENCIES COORDINATES CONTRIBU-TIONS
SQUARED COSINES IDEN - SHORT
LABEL
REL.WT DISTO 1 2 1 2 1 2
m1 - 2000 4.77 0.11 0.18 0.10 0.00 0.00 0.31 0.10
m2 - 2001 6.31 0.05 0.03 0.01 0.00 0.00 0.01 0.00
23
m4 - 2003 7.70 0.08 -0.05 0.03 0.00 0.00 0.03 0.01
m5 - 2004 8.05 0.07 -0.04 -0.09 0.00 0.00 0.03 0.12
m6 - 2005 9.37 0.06 0.06 -0.10 0.00 0.00 0.05 0.16
m7 - 2006 10.49 0.07 -0.07 0.07 0.00 0.00 0.07 0.07
m8 - 2007 12.23 0.03 -0.06 0.05 0.00 0.00 0.13 0.09
m9 - 2008 12.01 0.06 0.00 -0.01 0.00 0.00 0.00 0.00
m10 - 2009 11.34 0.05 0.05 -0.03 0.00 0.00 0.05 0.02
m11 - 2010 12.75 0.04 -0.04 0.00 0.00 0.00 0.04 0.00
m6 - 6 2.19 0.39 -0.17 0.09 0.00 0.00 0.07 0.02
COORDINATES, CONTRIBUTIONS AND SQUARED COSINES OF CASES ACTIVE CASES (AXES 1 TO 2)
CASES COORDINATES CONTRIBUTIONS SQUARED COSINES
IDENTIFIER REL.WT. DISTO 1 2 1 2 1 2
event history 4.23 0.55 0.49 0.35 6.30 11.70 0.44 0.23
life history 4.47 0.11 0.31 0.00 2.50 0.00 0.83 0.00
life story 2.47 0.50 -0.38 -0.57 2.20 17.50 0.29 0.64
panel data 35.91 0.10 0.30 -0.09 19.30 5.90 0.89 0.08
survival analyses
1.67 0.87 -0.80 0.14 6.60 0.80 0.74 0.02
birth cohort 1.71 0.05 0.15 -0.08 0.20 0.20 0.50 0.13
case studies 0.84 0.10 0.06 -0.17 0.00 0.50 0.04 0.30
control gr. (experiments)
1.91 2.07 -1.33 -0.32 20.80 4.30 0.86 0.05
daily diary 1.28 1.12 -0.99 -0.20 7.70 1.10 0.88 0.03
focus group 2.00 0.38 0.01 -0.49 0.00 10.80 0.00 0.63
in-depth interviews
2.15 0.18 0.02 -0.39 0.00 7.10 0.00 0.81
longitudinal studies
29.32 0.09 -0.15 0.22 4.30 32.10 0.28 0.57
nationally representative
4.16 0.19 -0.19 0.03 0.90 0.10 0.18 0.00
prospective longitudinal
1.82 1.44 -1.19 0.06 15.60 0.10 0.98 0.00
qualitative interviews
1.00 0.44 0.04 -0.55 0.00 6.70 0.00 0.68
retrospective reports
1.19 2.08 -1.34 -0.05 13.00 0.10 0.86 0.00
24
SUPPLEMENTARY CASES (AXES 1 TO 2)
CASES COORDINATES
CONTRIBU-TIONS
SQUARED COSINES
IDENTIFIER REL.WT. DISTO 1 2 1 2 1 2
adaptation 6.12 0.56 -0.70 -0.21 0.00 0.00 0.87 0.08
adolescence 89.35 1.75 -0.64 0.73 0.00 0.00 0.24 0.31
adult 55.98 0.49 -0.47 -0.21 0.00 0.00 0.45 0.09
anxieties 18.65 2.60 -1.55 -0.09 0.00 0.00 0.93 0.00
biographical 10.80 0.23 0.09 -0.39 0.00 0.00 0.04 0.66
care 38.64 0.75 -0.19 -0.50 0.00 0.00 0.05 0.33
career 11.12 0.14 -0.16 0.03 0.00 0.00 0.18 0.01
caregiver 15.07 3.23 -0.19 -0.98 0.00 0.00 0.01 0.30
childhood 18.47 0.46 -0.65 -0.04 0.00 0.00 0.92 0.00
clinical 19.60 2.10 -1.34 -0.28 0.00 0.00 0.86 0.04
cognition 22.51 2.02 -0.94 -0.58 0.00 0.00 0.43 0.17
cohort 20.06 0.12 -0.27 -0.12 0.00 0.00 0.61 0.12
coping 18.15 2.18 -1.42 -0.18 0.00 0.00 0.92 0.02
cross-country 1.28 0.31 -0.04 -0.54 0.00 0.00 0.01 0.94
cross-cultural 0.89 1.56 -1.11 -0.27 0.00 0.00 0.79 0.05
cross-section 2.52 0.77 -0.82 -0.16 0.00 0.00 0.87 0.03
death 8.70 0.69 -0.05 -0.65 0.00 0.00 0.00 0.62
demographic 10.65 0.34 -0.35 0.12 0.00 0.00 0.37 0.04
depression 82.13 1.90 -1.34 -0.19 0.00 0.00 0.94 0.02
disorder 32.09 3.47 -1.75 -0.09 0.00 0.00 0.88 0.00
divorce 14.09 0.16 0.18 0.02 0.00 0.00 0.21 0.00
economy 28.30 0.19 0.37 0.06 0.00 0.00 0.72 0.02
education 56.20 0.02 0.06 0.05 0.00 0.00 0.21 0.18
elderly 8.07 3.01 -0.17 -1.00 0.00 0.00 0.01 0.33
ethnographic 4.66 0.40 0.37 -0.20 0.00 0.00 0.35 0.10
event 21.20 0.63 -0.74 -0.17 0.00 0.00 0.87 0.04
face-to-face 0.95 1.35 -0.55 -0.54 0.00 0.00 0.22 0.22
families 93.41 0.06 -0.20 0.11 0.00 0.00 0.70 0.20
fatherhood 2.12 0.37 0.12 0.24 0.00 0.00 0.04 0.15
fertility 8.44 3.40 0.53 0.61 0.00 0.00 0.08 0.11
flexibility 2.45 0.40 -0.48 -0.02 0.00 0.00 0.56 0.00
follow-up 13.34 1.69 -1.25 -0.26 0.00 0.00 0.93 0.04
frail 1.74 3.29 0.15 -0.85 0.00 0.00 0.01 0.22
graduate 2.80 0.22 -0.10 0.23 0.00 0.00 0.05 0.25
health 116.11 0.44 -0.27 -0.49 0.00 0.00 0.17 0.55
hospital 9.24 0.93 -0.76 -0.58 0.00 0.00 0.61 0.36
household 22.07 0.15 0.32 -0.15 0.00 0.00 0.67 0.15
immigration 17.87 0.38 0.32 0.14 0.00 0.00 0.27 0.05