2 Abstract
SMALL AUXIN UP RNA (SAUR) genes are the largest class of primary auxin (growth
hormone) responsive genes in all land plants, many of which are expressed in actively growing
plant tissues. This project focuses on the study of four SAUR genes in the model plant
Arabidopsis thaliana. Previous studies have indicated that SAUR63 promotes elongation of
growing cells by regulating other proteins at the plasma membrane. Overexpression of the
protein in a broader domain, including in guard cells, caused the guard cells to swell, leading to
constitutive stomatal opening. To test whether other SAUR genes regulate guard cell function in
wild-type plants, we are studying three additional members of the family, SAUR30, SAUR56 and
SAUR60, which are expressed preferentially in guard cells. We hypothesize that these SAUR
genes regulate guard cell function based on their localization. We found that plants that
overexpressed and stabilized SAUR60 or SAUR63 proteins exhibited constitutively open stomata,
even during physiological conditions favoring stomatal closure. These results suggest that SAUR
proteins indeed regulate guard cell function. This is the first demonstration that certain
members of the SAUR protein family can lead to open stomata. Similar experiments for SAUR30
and SAUR56 are in progress. We are currently knocking-out these genes to test if they are
required to open stomata. Understanding how stomatal aperture is regulated may lead to
3 Introduction
SMALL AUXIN UP RNA (SAUR) genes are expressed in actively growing plant tissues and
are the largest class of primary auxin responsive genes in all land plants (Ren and Gray, 2015).
These genes are members of a large gene family, many of which are induced by the growth
hormone auxin. To study this protein family, we have chosen to work with the model organism
Arabidopsis thaliana. In growing A. thaliana hypocotyls, 26 out of 49 genes induced within 30
minutes of auxin application are SAUR genes (Chapman et al. 2012). Several SAUR proteins,
including SAUR19 and SAUR63 are found to localize to the plasma membrane and promote
growth (Chae et al., 2012, Spartz et al., 2012). Among these, SAUR19 can inhibit phosphatases
that inactivate the plasma membrane H+-ATPase (Spartz et al., 2014). Other SAUR proteins may
act similarly, but it is also possible that they have distinct biochemical functions.
The SAUR63 gene promotes cell growth by regulating other proteins at the plasma
membrane (Chae et al., 2012). We found that overexpression of the protein throughout the
plant, including in guard cells, caused the guard cells to swell, leading to constitutively open
stomata. Guard cells are important for plants because they swell and shrink in order to regulate
gas exchange through the stomata on the leaf surface. To test whether other SAUR genes
regulate guard cell function in wild-type plants, we focused on three additional members of the
family, SAUR30, SAUR56 and SAUR60, which have been found to be expressed preferentially in
guard cells (Bauer et al., 2013). Further studies on the previously characterized SAUR63 were
also carried out to test whether SAUR proteins are sufficient in causing stomatal phenotypes.
4
SAUR56 and SAUR60 will have similar functions since they are sister genes. On the other hand,
SAUR30 has a more distinct sequence and is also known to have an opposite regulation;
SAUR56 and SAUR60 are repressed by drought or the stress hormone ABA, whereas SAUR30 is
induced by drought and ABA. (Bauer et al., 2013)
The overarching project aims to determine the role that SAUR proteins have in
regulating physiological responses (guard cell swelling) indirectly involved in processes
impacting cell growth, such as photosynthesis and respiration. Future goals include identifying
the regulatory targets of each SAUR protein as well as elucidating the structural requirements
for their localization and function. Understanding how stomatal opening is regulated could
possibly improve understanding of, and modifications to, traits directly involved in
photosynthesis and drought resistance in crops.
Methods
Generation of transgenic plants
Vectors containing the gene of interest with detectable protein tags were constructed
and cloned into Agrobacterium tumefaciens strain GV3101 via electroporation. Table 1 provides
a summary of the vectors and primers used as well as the gene constructs we made.The HA tag
was selected due its small size so that the fusion protein can maintain its native configuration,
although these lines have not been characterized yet. Gus fusion proteins can easily be
detected by staining to determine which cells express the fusion, whilst GFP tags can be viewed
5 The genes of interest were amplified using gene-specific primers and cloned into
Gateway binary vectors (Table 1). These constructs were transfected into A. tumefaciens and
then introduced into wild-type A. thaliana (ecotype Columbia) plants by floral dip (Clough &
Bent, 1998). The successfully transformed plants were then selected on MS-agar (Murashige
and Skoog salts) medium containing 30µg ml-1 kanamycin: the first generation of plants was
screened for single-locus insertions by 3:1 segregation in kanamycin resistance. Multiple
subsequent generations of plants were then grown and harvested to select for the homozygote
containing the gene of interest.
Fluorescence imaging for subcellular protein localization
Homozygous seedlings containing the SAUR60:GFP gene were analyzed by taking images
on a Zeiss 710 DUO confocal microscope. A negative control of wild-type seedlings was used as
a baseline to deduce localization of the protein.
Gus-staining imaging for cellular protein localization
Homozygous seedlings containing the SAUR56:Gus gene were stained with staining
solution (50 mM NAHPO4, 5 µg ml-1 of X-gal, 1.75 mM of ferricyanide, 1.75 mM of ferrocyanide
and 0.1% Triton-X buffers) and analyzed by taking images on a compound microscope. A
negative control of wild-type seedlings and a positive control of plants known to exhibit staining
6 Hypocotyl Length Measurement
Seeds of respective genotypes were plated and grown vertically for 4-5 days in 0.5x MS,
0.6% phyto-agar plates. We then took photographs of the seedlings to measure the hypocotyl
length of each seedling using ImageJ (Schneider et al., 2012). Measured lengths were averaged
and a Student’s t-test for significance was performed using Microsoft Excel.
Stomatal Aperture Assays
Lower (abaxial) epidermal cells from leaves were mounted onto a slide using medical
adhesive glue, incubated in opening buffer (10 mM KCl, 10 mM MES, pH 6.15) for 1 hour and
stained with Toluidine Blue to be imaged. We measured responsiveness to different light levels,
and ABA concentration. An initial experiment tested for response to the absence and presence
of each variable (light and ABA) before dosage response experiments were carried out to
determine responsiveness to varied levels of light or ABA concentration. To determine the
effect of light, lower epidermal cell samples were incubated in darkness, intermediate or high
light levels (0 µmol m-2 s –1, 15.50 µmol m-2 s –1 and 157.20 µmol m-2 s –1 respectively) for 2
hours before being imaged. In the experiment testing the effect of varied ABA concentration,
once the 2 hour long incubation in opening buffer was completed, some tissue samples were
incubated in 0 µM, 1 µM, 10 µM or 100 µM ABA solutions (in opening buffer) for 30 minutes
before being imaged. Stomatal aperture ratios were measured with ImageJ software (Schneider
et al., 2012) and analyzed quantitatively as the ratio of stomatal opening divided by stomatal
length. The stomatal aperture ratios were averaged and analyzed with a Two-way ANOVA,
7 Furthermore, a leaf drying assay was conducted as an indirect measure of stomatal
aperture. Leaves from respective genotypes were detached and weighed. The leaves were then
placed under bright light (157.20 µmol m-2 s –1) to allow for water loss over a span of 120
minutes. Measurements were taken after 30, 60 and 120 minutes, and the collected data were
normalized to initial weights and analyzed using standard t-tests for significant difference in
water loss. Lastly, the circadian rhythm of stomatal opening was studied indirectly, via
measurement of stomatal apertures of transgenic plants both 2 hours before the lights in the
growth chambers came on and 6 hours after the lights went out. These were times where
stomata are expected to be closed according to the natural circadian rhythm of plants.
Results
Overexpressed SAUR60 proteins localized throughout the plant
Expression of fusion proteins in a larger domain via the P35S promoter resulted in the
expression of SAUR60:GFP proteins throughout the plants, including the roots, hypocotyls and
guard cells (Figure 1). The protein was also visualized to localize to the cell membrane,
cytoplasm as well as nucleus at a sub-cellular level.
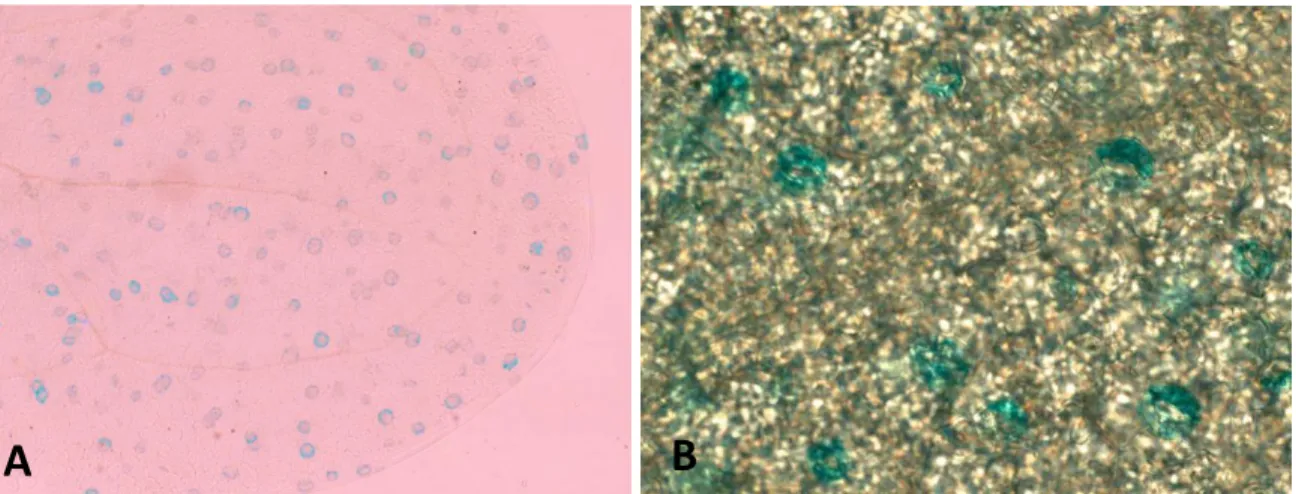
SAUR56 was confirmed to be expressed in guard cells
Through Gus staining, it was found that the PSAUR56:SAUR56:Gus protein was
expressed in the guard cells (Figure 2). Since the native promoter was used, it can be concluded
that the wild-type protein localizes in the guard cell, in agreement with microarray data (Bauer
8 Overexpressed SAUR63, SAUR60 and SAUR30 affect hypocotyl elongation
Previously, we found that SAUR63:GFP fusion proteins have a gain-of-function, which
results in faster elongation of hypocotyls and flower organs (Chae et al. 2012). Similarly, we
found that plants expressing a SAUR60:GFP fusion protein behind a strong viral promoter also
have increased hypocotyl elongation, suggesting that SAUR60 has similar activity compared to
SAUR63. Furthermore, overexpressed SAUR63 (P35s:SAUR63:YFP:HA, P35s:SAUR63:GUS #9,
PSAUR63:SAUR63:GUS #15) and SAUR60 lines (Col x P35s:SAUR60:GFP, P35s:SAUR60), had
significantly longer hypocotyls than the wild-type A. thaliana (Columbia ecotype) (Figure 3A).
The P35S:SAUR63:YFP:HA transgenic plant had the longest hypocotyls suggesting the strongest
expression of SAUR63 proteins or greatest abundance or activity of the protein of interest.
Interestingly, the P35s:SAUR63:Gus #9 construct did not show the elongated hypocotyl
phenotype likely due to a technical problem in the experiment, as we have observed long
hypocotyls in this line in previous experiments. Ost2-2 is a hyperactive form of the H+-ATPase
that may be a target of SAUR proteins (Merlot et al., 2007), and the ost2-2 mutant also had a
long hypocotyl (Figure 3A). Conversely PP2C-D1 belongs to a family of phosphatases that inhibit
the activity of H+-ATPase (Spartz et al., 2014), and plants overexpressing this gene had short
hypocotyls.
In the investigation of the SAUR60:GFP protein, the amount of protein expressed past a
certain threshold did not seem to contribute significantly to the elongated hypocotyl phenotype
since the heterozygotes and homozygotes exhibited similar elongated hypocotyl lengths (Figure
9 Similarly, hypocotyl lengths were measured in three overexpressed SAUR30 lines. Using
the same controls as previously discussed, it was found that the lines, with overexpressed
SAUR30, SAUR30:GFP and GFP:SAUR30, showed a trend towards significantly longer hypocotyls
(Figure 3H). The overexpressed SAUR30 protein demonstrated the longest hypocotyls, similar
to P35S:SAUR63:YFP:HA control line, whilst the overexpressed fusion proteins, SAUR30:GFP and
GFP:SAUR30, had lengths closer to the intermediate phenotype of the P35s:SAUR60:Gus #9 line,
suggesting that SAUR30 proteins had similar activities to SAUR60 and SAUR63.
Overexpressed SAUR60:GFP adversely affects development of the plant
Despite having largely similar lengthened hypocotyl, the homozygous and hemizygous
P35s:SAUR60:GFP adult plants had drastically different phenotypes. The homozygous plant was
severely dwarfed in comparison to both the hemizygote and wild type plant (Figure 3C).
Although the adult homozygote is able to survive, it does not grow significantly larger and
appears to be virtually sterile, with the production of only 2 seeds. (Figure 3F, 3G). In contrast,
the hemizygote produced viable seeds. However, the hemizygote was also dwarfed, had twisty
inflorescences, and thinner, shorter leaves (Figure 3D). These were distinct phenotypes in
comparison to the wild-type plant.
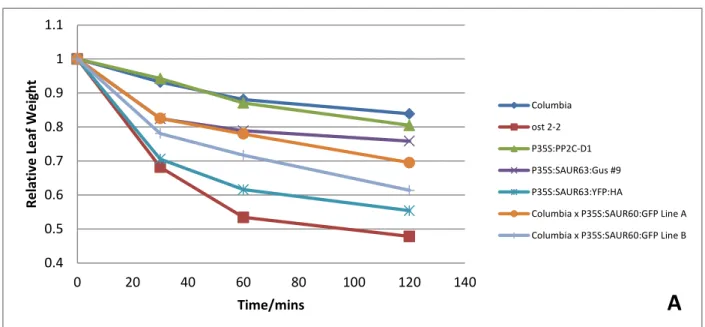
Overexpressed SAUR63 and SAUR60 causes increased rate of water loss
We found that the overexpressed SAUR63:YFP:HA protein caused the most rapid
decrease in leaf weights due to water loss over a span of 120 minutes. This was almost as fast
as the control line ost2-2 which is known to have opened stomata phenotypes (Merlot et al.,
10 increased rate of water loss but to a smaller degree (Figure 4A). Similar results were observed
in two other replications to support its accuracy.
SAUR60 and SAUR63 proteins led to guard cell phenotypes and affected stomatal aperture
All the transgenic plants exhibited a higher stomatal aperture ratio in comparison to the
wild-type. The overexpressed SAUR63:YFP:HA protein exhibited the largest stomatal aperture
ratios, while the hemizygous P35s:SAUR60:GFP and homozygous P35s:SAUR63:Gus lines had the
smallest increase in stomatal aperture size. The P35s:PP2-CD1 line also had unexpectedly large
stomatal aperture sizes despite exhibiting a wild-type rate of water loss in the water loss assay.
(Figure 4C,D) Additionally, the guard cells in the P35s:SAUR63:YFP:HA and P35s:SAUR60:Gus lines
were often observed to be deformed and elongated in comparison to the wild type (Figure 4B).
Varied light conditions and ABA concentrations changes the stomatal ratios
Varying the light levels during incubation time altered the stomatal aperture ratios of
each genotype to differing degrees (Figure 4B). P35s:PP2C-CD1, ost 2-2 and P35s:SAUR63:YFP:HA
constructs were not significantly affected by decreasing light intensity. However, the two other
transgenic plants exhibited more wild-type phenotypes in terms of stomatal aperture size at
high light levels. (Figure 4C.1) However, all the genotypes studied were less responsive to
decreasing light levels than wild-type. (Figure 4C.2) Lastly, measurement of stomatal aperture 2
hours before the lights came on and 6 hours after the lights went out showed that stomata of
P35s:SAUR63:YFP:HA lines were constitutively open while wild-type stomata were closed; this
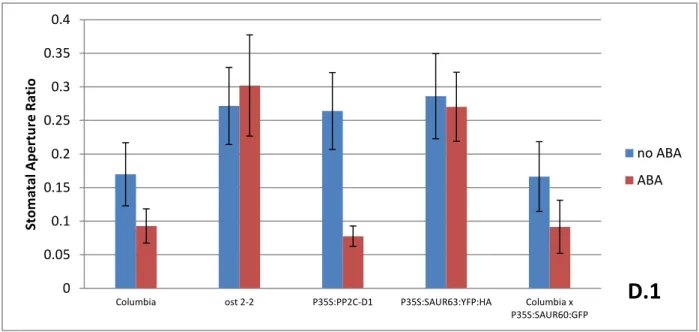
11 Based on our data, ABA (drought-stress hormone) caused wild-type stomata to close as
expected. Columbia and P35s:PP2C-D1 all exhibited closure of stomata in the presence of ABA,
while Columbia x P35s:SAUR60:GFP exhibited closure of stomata to a lesser degree. P35s:PP2C-D1
was the most sensitive to the presence of ABA, having mostly open stomata in the absence of
ABA, and behaved like the wild-type in the presence of ABA. On the other hand, ost2-2 and
P35s:SAUR63:YFP:HA did not appear to be sensitive to the presence of ABA. (Figure 4D.1)
Comparable results were yielded from repeating the experiment, suggesting that the activities
of SAUR60 and SAUR63 may be interestingly different in some aspects. Similar to light response,
all the genotypes studied were less responsive to varied ABA concentration than wild-type.
(Figure 4C.2)
Mutation in aha1 suppressed the effects of overexpressed SAUR63 proteins
AHA genes encode plasma membrane proton pumps which control guard cell swelling
and hence these genes regulate stomata opening (Spartz et al., 2014). It was found that the null
mutant aha1-6 had more closed stomata in both repeats of the experiment. Furthermore, in
the double mutant,aha1-6 x SAUR63:YFP:HA, stomata remained closed in a similar manner to
the single mutant. This suggested that mutations in aha1 gene caused the suppression of
effects due to overexpressed SAUR63. However, further experiments have to be carried out to
determine whether this was due to silencing of SAUR63 expression or truly due to suppression
by aha1 mutation. Lastly, we also found that phenotypes of aha2 single and double mutants
12 Discussion
Our study showed that the overexpression SAUR proteins does indeed have large
phenotypic impacts on A. thaliana, and these results provide the foundation for further studies
into characterizing this protein family. The hypocotyl length studies are a convenient
quantitative measure of the effects of SAUR proteins on the elongation growth of A. thaliana. It
was found that SAUR60:GFP localizes to the plasma membrane and increases elongation,
suggesting that its activity is similar to SAUR63 (Chae et al., 2012). Similarly, overexpressed
SAUR30:GFP and GFP:SAUR30 also led to elongated hypocotyls, despite SAUR30 expression
being known to be induced by ABA, opposite to the regulation of SAUR56 and SAUR60 (Bauer et
al., 2012). Further studies such as inflorescence stem growth, flower organ development and
fruit sizes should be carried out for a more complete indicator of organ elongation due to
SAUR60 and SAUR30 expression. Few or no seeds were harvested from the homozygous
P35s:SAUR60:GFP plant and whether or not the plant is truly sterile will be determined in
subsequent studies.
Previous studies have demonstrated that, SAUR63 is known to stimulate cell expansion
(Chae et al., 2012). Mature guard cells do not grow, but instead they swell reversibly to cause
stomatal opening. Thus the stomatal phenotypes caused by increased SAUR63 activity may
reveal a similar effect in stomata as in growing organs, since the growth and swelling of cells are
presumably caused by similar underlying biochemistry. The results obtained, together with
published data (Bauer et al., 2012) that SAUR60 is expressed in guard cells, suggesting that
13 Comparing the results obtained in the water loss assay and stomatal aperture assay, it
was found that the overexpressed SAUR63:YFP:HA construct caused the widest open stomata
and the fastest water loss, which is consistent with the previous results demonstrating this line
having the strongest hypocotyl phenotype. The SAUR60:GFP plants also had more modest
stomatal phenotypes, comparable to their hypocotyl phenotypes. The corresponding results
suggest that varying phenotypic strength was likely due to the level of expression of the
respective SAUR protein. Furthermore, overexpressed SAUR63:YFP:HA demonstrated
constitutively open stomata even at night, showing disruption of circadian rhythm in stomata
opening regulation. Similar experiments will be carried out to study the effect of SAUR30,
SAUR56 and SAUR60 proteins on the diurnal rhythm of stomatal apertures.
The suppression of stomata opening by aha1 mutations suggested that SAUR proteins
act upstream to the AHA1 plasma membrane proton pump. Further studies of other proteins
involved in the pathway will determine whether SAUR genes are indeed directly regulating the
proton pump.
The PP2C-D1 construct was included since it was found to act in an opposite manner
compared to SAUR proteins (Spartz et al., 2014). While results under varied light levels
indicated that it had more open stomata than wild-type, it was later found that it was
significantly sensitive to the presence of ABA. This suggested that PP2C-D1 proteins might
control the stomatal aperture opening mechanism through a different pathway from the SAUR
14 exact upstream and downstream members in the pathway would have to be done to confirm
this hypothesis.
Our study is the first to demonstrate that particular members of the SAUR protein family
lead to an open stomata. Similar experiments for SAUR30 and SAUR56 are in progress. Further
studies are being designed to determine whether near-constitutive stomatal opening in our
mutants are due to anomalous growth of the guard cells or regulation by SAUR gene expression.
In the next experimental phase, we hope to determine the specific function of SAUR proteins
when being expressed in their normal domains, driven by their native promoters. Protein
abundance would be studied using the transgenic plants designed with native promoters.
Ultimately, our goal is to identify the regulatory targets of each SAUR protein as well as defining
the structural requirements for their localization and function. This would involve the
purification of the proteins of interest with their interacting partners so that the regulatory
targets of each protein can be analyzed. Functional domains and interacting sites can also be
identified via proteomic analysis. The identification of knockout mutations in these genes via
genome engineering may provide support for the findings of this project.
Through the study of stomatal aperture regulation, improvements in physiological traits
affecting photosynthesis and drought resistance may be established to improve crop
15 Figures and Tables
Generation of transgenic plants
Gene of interest
Primers Construct Vector
Forward Reverse
SAUR30 CACCACTTGCCAG C GATCAAAGT AA
Natural sequence:
TTAGAAACATCGCAA ATGGTTG
Stop codon removed:
GAAACATCGCAAATG GTTGT
P35s:SAUR30 pGWB2
P35S:SAUR30:GFP pGWB5
P35S:GFP:SAUR30 pGWB6
PSAUR30:SAUR30:GFP* pGWB4
PSAUR30:SAUR30:Gus* pGWB3
PSAUR30:SAUR30:HA* pGWB13
SAUR56 CACCCACTCATGA AAGTAGAAGA GA
Natural sequence:
TTAGGAAACT AATGACTGAA GC
Stop codon removed:
GGAAACTAAT GACTGAAGCT GG
PSAUR56:SAUR56:GFP* pGWB4
PSAUR56:SAUR56:Gus* pGWB3
PSAUR56:SAUR56:HA* pGWB13
SAUR60 CACCGCGATTTCA GGATATAGGTTT
Natural sequence:
TTAAAAAACTAGAGA CTGGAGC
Stop codon removed:
AAAAACTAGAGACTG GAGCTTG
P35s:SAUR60 pGWB2
P35S:SAUR60:GFP pGWB5
P35s:GFP:SAUR60 pGWB6
P35s:SAUR60:Gus pMDC140
PSAUR60:SAUR60:GFP* pGWB4
PSAUR60:SAUR60:Gus* pGWB3
PSAUR60:SAUR60:HA* pGWB13
SAUR63 CACCAGACTGCCT CATCAAAGTCAA
AAATACAAGCAACTG TTGCGT
P35S:SAUR63:Gus #9 pGWB3
P35S:SAUR63:Gus #15 pGWB3
P35S:SAUR63:YFP:HA pEARLY101
16
Fluorescence and Gus-staining imaging for protein localization
Figure 1: Representative images showing confocal imaging of overexpressed SAUR60:GFP localization in (A) hypocotyls, (B) roots, and (C) cotyledon. (The red fluorescence indicates the plasma membrane stained with FM4-64 while green indicates GFP. Green fluorescence
indicates that the SAUR60:GFP protein localized both in plant cell membrane, cytoplasm as well as the nucleus of cells. Figure 1A was taken by Punita Nagapal.
Figure 2: Representative images showing X-Gluc staining SAUR56:Gus localization in guard cells at (A) 10x and (B) 40x magnifications.
C
A
B
17 0 1 2 3 4 5 H yp o co tyl Len gth ( m m ) 0 0.5 1 1.5 2 2.5 3 3.5 4 4.5 5
Homozygous Heterozygous Wild Type
H yp oc ot yl len gth s (m m ) Genotypes
Hypocotyl measurements and plant growth of SAUR60 and SAUR63 transgenic plants.
Figure 3A: Hypocotyl lengths of seedlings of the indicated genotypes grown for 5 days on 0.5X MS plates. Data are shown as means + SDs; * P < 0.05 in a Students t-test compared with the wild type.
18 Figure 3C-E: Phenotype of 5.5 weeks old segregating transgenicplantsas labeled with the wild type segregant on the right of (C), while white arrow in upper left of (C) indicates the dwarfed homozygous plants and left of (C) and (D) show phenotypes of the hemizygote plant. (E) Close up of the homozygous transgenic plant.
19 Figure 3H: Hypocotyl lengths of seedlings of the indicated genotypes grown for 5 days on 0.5X MS. Each bar shows results for an independent transgenic line. Data are shown as means + SDs; * P < 0.05 in a Students t-test compared with the wild type.
H
*
*
*
*
*
*
*
*
*
*
*
*
*
*
*
*
*
*
*
* * *
*
*
*
*
20 0.4 0.5 0.6 0.7 0.8 0.9 1 1.1
0 20 40 60 80 100 120 140
Re lati ve Leaf W ei gh t Time/mins Columbia ost 2-2 P35S:PP2C-D1 P35S:SAUR63:Gus #9 P35S:SAUR63:YFP:HA
Columbia x P35S:SAUR60:GFP Line A
Columbia x P35S:SAUR60:GFP Line B Water loss and stomatal aperture assay results.
Figure 4A: Representative data of leaf water loss over a period of 120 mins.
Figure 4B: Data of stomatal formation phenotype: (B.1)Data of measured stomata lengths in each genotype. Data are shown as means + SDs; * P < 0.05 in a Students t-test compared with the wild type, (B.2) Representative picture of deformed stomata in P35S:SAUR63:YFP:HA lines in comparison to (B.3) wild-type stomata.
21 0 0.05 0.1 0.15 0.2 0.25 0.3 0.35 0.4 Sto m atal A p e rtu re R atio High Light Low Light
Figure 4C: (C.1) Stomatal Aperture Ratio measurements of indicated genotypes in: varied light condition, only P35:SAUR63:GUS #9 and Columbia x P35s:SAUR60:GFP exhibit significant
differences between low and high light (P≤0.05). However at low light, these genotypes appeared to be similar to wild-type (P>0.05). (C.2) Results from darkness response where samples were subjected to 3 different light conditions. Two-way ANOVA, followed by Tukey’s multiple comparison test, was used for statistical analysis (P≤0.05). Means with the same letter are not significantly different from each other.
0 0.05 0.1 0.15 0.2 0.25 0.3 0.35
160 µmol m^-2 s ^–1 16 µmol m^-2 s ^–1 0 µmol m^-2 s ^–1
Sto m atal A p e rtu re R atio Columbia ost2-2 p35S:S63:GUS p35S:S63:YFP:HA p35S:S60:GFP
C.1
C.2
ab ab ab
bc c
i ad
ade def
efg
efg
fgh fgh
22 0 0.05 0.1 0.15 0.2 0.25 0.3 0.35 0.4
Columbia ost 2-2 P35S:PP2C-D1 P35S:SAUR63:YFP:HA Columbia x P35S:SAUR60:GFP Sto m atal A p e rtu re R atio no ABA ABA
Figure 4D: (D.1) Stomatal Aperture Ratio measurements of indicated genotypes in: presence of ABA, Columbia, P35s:PP2C-D1 and Columbia x P35s:SAUR60:GFP all exhibit significant differences in the presence of ABA (P≤0.05). P35s:PP2C-D1 exhibit significant difference in the absence of ABA, but behaves like wild-type in the presence of ABA. ost2-2 and P35s:SAUR63:YFP:HA exhibit significance difference from wild-type (P≤0.05). (D.2) Results from ABA dose response
experiment where samples were subjected to 4 different concentrations of ABA. Two-way ANOVA, followed by Tukey’s multiple comparison test, was used for statistical analysis (P≤0.05). Means with the same letter are not significantly different from each other.
0 0.05 0.1 0.15 0.2 0.25 0.3
0 1 10 100
Sto m atal ap e rtu re /sto m atal le n gth
[ABA], mM
ABA response 7-15
Columbia ost2-2 p35S:S63:YFP:HA p35S:S60:GFP p35S:S63:GUS
D.1
D.2
h ab bc c ab ababc abc
bcd cde cd
def efg
fg g fg fg fg fg
23 Figure 4E: Stomatal Aperture Ratio measurements of indicated genotypes, including aha
mutants to establish downstream or upstream relations between SAUR proteins and aha protein interactions. Data are shown as means + SDs; * P < 0.05 in a Students t-test compared with the wild type.
Figure 4F: (F.1-F.3) Representative pictures of a PP2C-D1 transgenic plant lower epidermis photographed showing the same stoma in varying magnifications. (F.4) Picture of a stoma of the same genotype incubated in ABA for 1 hour.
0 0.05 0.1 0.15 0.2 0.25 0.3
Sto
m
atal ap
e
rtu
re
r
atio
F.1
F.2
F.4
0.25 mm
E
0.50 mmF.1
2.5mm 0.25 mmF.3
0.25 mm*
*
*
F.1
F.2
F.4
F.2
0.50 mmF.4
0.25 mmF.3
0.25 mm 0.25 mm24 References
Bauer, H., Ache, P., Lautner, S., Fromm, J., Hartung, W., Al-Rasheid, K.A., Sonnewald,
S., Sonnewald, U., Kneitz, S., Lachmann, N., Mendel, R.R., Bittner, F., Hetherington,
A.M. and Hedrich, R. (2013) The stomatal response to reduced relative humidity
requires guard cell-autonomous ABA synthesis. Current biology, 23: 53-57.
Chae, K., Isaacs C.G., Reeves, P.H., Maloney, G.S., Muday, G.K., Nagpal, P. and Reed,
J.W. (2012) Arabidopsis SMALL AUXIN UP RNA63 promotes hypocotyl and stamen
filament elongation. Plant J., 71(4): 684-697.
Chapman, E.J., Greenham, K., Castillejo, C., Sartor, R., Bialy, A., Sun, T.P. and Estelle,
M. (2012) Hypocotyl Transcriptome Reveals Auxin Regulation of Growth-Promoting
Genes through GA-Dependent and -Independent Pathways. PloS one, 7: e36210.
Clough, S.J. and Bent, A.F. (1998) Floral dip: a simplified method for
Agrobacterium-mediated transformation of Arabidopsis thaliana. Plant J., 16: 735–743.
Feng, Z., Mao, Y., Xu, N., Zhang, B., Wei, P., Yang, D., Wang, Z., Zhang, Z., Zheng, R.,
Yang, L., Liu, X. and Zhe, J. (2014) Multigeneration analysis reveals the inheritance,
specificity, and patterns of CRISPR/Cas-induced gene modifications in Arabidopsis.
Proc Natl Acad Sci USA, 111(12): 4623-4627.
Hagen, G. and Guilfoyle, T. (2002) Auxin-responsive gene expression: genes,
promoters, and regulatory factors. Plant Mol. Biol., 49: 373-385.
Merlot, S., Leonhardt, N., Fenzi, F., Valon, C., Costa, M., Piette, L., Vavasseur, A.,
25 a plasma membrane H(+)-ATPase prevents abscisic acid-mediated stomatal closure.
EMBO J., 26(13): 3216-3226.
Schneider, C.A., Rasband, W.S., Eliceiri, K.W. (2012)"NIH Image to ImageJ: 25 years
of image analysis". Nature Methods, 9: 671-675.
Spartz, A.K., Ren, H., Park, M.Y., Grandt, K.N., Lee, S.H., Murphy, A.S., Sussman, M.R.,
Overvoorde, P.J. and Gray, W.M. (2014) SAUR Inhibition of PP2C-D Phosphatases
Activates Plasma Membrane H+-ATPases to Promote Cell Expansion in Arabidopsis.
Plant Cell, 26: 2129-2142.
Ren, H. and Gray, W.M. (2015) SAUR Proteins as Effectors of Hormonal and