#
ABSTRACT
BRYAN EDWARD RAMSTACK. Analysis of Respirator Cartridges and
Filters as a Determination of Occupational Exposure. (Under
the direction of Dr. PARKER C. REIST)
This research attempted to determine occupational
exposure from the amount of contaminant deposited on
respirator cartridges. The flowrate through the respirator
was estimated by existing ergonomic and respiratory
ventilation models. The respirator concentrations were
compared with simultaneous breathing zone air samples. A
respiration flow model was modified into 18 different
variations depending on 1) the increase in oxygen required per
increase in workload; 2) estimate of total ergonomic workload;
and 3) the basal oxygen exceeded the calculated maximum
possible flowrate. Of the 18 models only 5 were acceptable.
Dust/mist respirator results were 1.5 to 2.2 times less than
the breathing zone samples. Respirator cartridge organic
vapor constituents were 1.0 to 2.5 times less than the
charcoal tube values. The models appear to overestimate the
actual flow, although factors such as mask leakage, faceshield
blocking, sensitivity of filter pads to relative humidity, and
differences in analytical sensitivities made quantitative
conclusions unreliable. The results of organic vapor
respirator cartridges did show countenance for this procedure
in screening workplace exposures or estimating a respirator
#
Table of Contents
Page
Introduction... 2
Background ... ... 3
Sampling Methods ... 5
Sampling Locations and Operations ... 5
Sampling Techniques and Analysis ... 6
Respirator Airflow Estimates ... 11
Ergonomic Estimates of Total Energy Required .... 13
Basal Metabolic Rate ... 14
Volumetric Rate of Oxygen Required per Work Rate . 16
Total Volume of Expired Air ... 16
Results and Discussion ... 18
Operations Sampled ... 18
Observations of Operations ... 19
General Trends of Raw Data ... 19
Respirator Air Flow Models ... 22
Particle Sizing of Dust/Mist Operations... 25
Trends of Calculated Data for Dust/Mist Samples . 26
Statistical Testing for Dust/Mist Samples ... 30
Trends of Calculated Data for Organic Vapor Samples 31
Statistical Analysis for Organic Vapor Samples ... 39
Conclusion ... 40
References... ... 41
Appendix I: Operation Observations by Sample ... 44
Appendix II: Dust/Mist and Organic Vapor Sampling
Results by Weight ... 57
Appendix III: Dust/Mist Sampling Concentrations
by Respirator Flow Model ... 60
Appendix IV: Organic Vapor Sampling Concentrations
for Respirator Flow Model #17 ... 85
Appendix V: Porton Gradicule Particle Sizing Data ... 88
List of Tables:
Page
Table 1: Corrections to Respirator Dust/Mist Samples Due
to Changes in Laboratory Relative Humidity ... 10
Table 2: Volatile Aromatic Hydrocarbons Analyzed
During Painting Operations ... 10
Table 3: Predictive Ratios of Expired Minute Volume to Rate
of Oxygen Uptake at Various Levels of Exercise . 12
Table 4: Estimated Energy Expenditures ... ... 14
Table 5: Basal Metabolic Rate in Calories per Hour per
Square Meter of Body Surface Area at Various Ages
as of Last Birthday ... 15
Table 6: Ratios of Breathing Zone Sampling Results to
Respirator Cartridge Results for Organic Vapors 21
Table 7: Acceptable Dust/Mist Sample Results ... 24
Table 8: Paired Student-t Test Results
For Dust/Mist and Organic Vapor Samples ... 32
List of Figures
Figure 1: Standardized Respirator Filter Weight versus
Retention Time ... 8
Figure 2: Percent Change in Respirator Filter Weight
versus Relative Humidity at 1.5 Hrs Retention ..8
Figure 3: Ventilation Rate versus Workload; Utilizing
Hanson's Model and Silverman's Data ... 17
Figure 4: Dust/Mist Breathing Zone versus Respirator Filter
Pad Results; Using Respirator Flow Model #8 .. 27
Figure 5: Dust/Mist Breathing Zone versus Respirator Filter
Pad Results; Using Respirator Flow Model # 13 .. 27
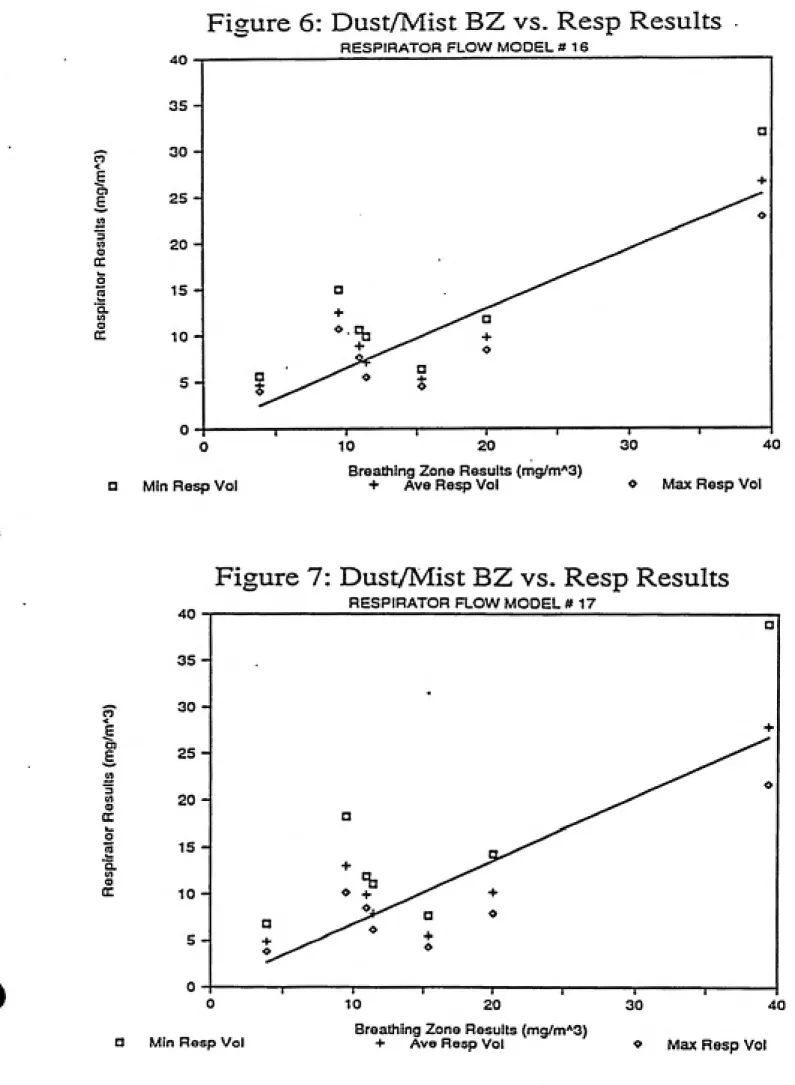
Figure 6: Dust/Mist Breathing Zone versus Respirator Filter
Pad Results; Using Respirator Flow Model # 16 .. 28
Figure 7: Dust/Mist Breathing Zone versus Respirator Filter
Pad Results; Using Respirator Plow Model # 17 .. 28
Figure 8: Dust/Mist Breathing Zone versus Respirator Filter
#
Figure 9:
Figure 10;
Figure 11
Figure 12
Figure 13
Figure 14
Figure 15
Figure 16;
Figure 17:
Figure 18;
List of Figures (con't)
Page
Respirator Cartridge versus Charcoal Tube Results:
Organic Vapor Sample # 1; All Constituents:
Using Respirator Flow Model # 17 ... 34
Respirator Cartridge versus Charcoal Tube Results:
Organic Vapor Sample # 2; All Constituents:
Using Respirator Flow Model # 17 ... 34
Respirator Cartridge versus Charcoal Tube Results:
Organic Vapor Sample # 3; All Constituents:
Using Respirator Flow Model #17 ... 35
Respirator Cartridge versus Charcoal Tube Results:
Organic Vapor Sample # 4; All Constituents:
Using Respirator Flow Model #17 ... 35
Respirator Cartridge versus Charcoal Tube Results:
Organic Vapor Sample # 5; All Constituents:
Using Respirator Flow Model #17 ... 36
Respirator Cartridge versus Charcoal Tube Results:
for Methylcyclopentane; All Organic Vapor Samples:
Using Respirator Flow Model #17 ... 36
Respirator Cartridge versus Charcoal Tube Results:
for n-Heptane; All Organic Vapor Samples:
Using Respirator Flow Model #17 ... 37
Respirator Cartridge versus Charcoal Tube Results:
for Toluene; All Organic Vapor Samples:
Using Respirator Flow Model #17 ... 37
Respirator Cartridge versus Charcoal Tube Results:
for p-Xylene; All Organic Vapor Samples:
Using Respirator Flow Model #17 ... 38
Respirator Cartridge versus Charcoal Tube Results:
for o-Xylene; All Organic Vapor Samples:
Using Respirator Flow Model #17... 38
Introduction:
A worker's exposure to airborne workplace contaminants can be
measured by several methods. As air sampling equipment technology
has improved, personal sampling increasingly relies upon battery
operated pumps or passive dosimeters. However, breathing zone
samples do not evaluate the effectiveness of respiratory protection
in areas requiring personal protective equipment to supplement
traditional engineering controls. Furthermore, breathing zone
sample results can vary by the type (passive vs. active), location
and orientation of the collecting device.
In an article published in 1988, First [1] stated "Analysis of
the respirator pad or chemical cartridge gives a good integrated
sample of the air that would have reached the lungs, although the
exact air volume can only be estimated." This research attempted to
determine industrial airborne workplace concentrations based on the
amount of contaminant deposited on respirator cartridges. The
airborne concentrations were calculated by estimating the flowrate
through the respirator with existing ergonomic and human ventilatory
models. The calculated concentrations were compared with concurrent
continuous breathing zone air samples to determine any statistical
correlation. The goal of this research was to determine if the
respirator cartridge analysis method could be used as a screening
device for estimating workplace airborne concentrations.
Background;
The use of respirator pads to determine exposure to pesticides
was described by Durham and Wolf [2] in 1962. Respiratory exposure
was estimated by the amount of pesticide deposited on the filter
pads of a properly fitted "single unit respirator and a modified
plastic funnel" covering. The covering protected the respirator pad
from direct spray. The stem of the funnel covering was plugged and
two 12mm holes drilled 6mm apart midway between the base and the
apex. During sampling, the holes were directed downward to simulate
the aerodynamic effect of human nostrils. Durham and Wolf listed
several previous studies comparing the results of respirator pad
analysis to breathing zone air samples.
Measurements by Batchelor & Walker [3] during orchard spraying
with parithion indicated the respiratory pad technique gave values 3
to 5 times greater (in mg/kg/day) than air sampling results. Durham
and Wolfe [2] contended that the ratios of respiratory pad samples
to air sampling results were actually "of the same order of
magnitude" because Batchelor 5 Walker did not shield the respirator
pads to prevent impingement of the parithion aerosol. Durham and
Wolfe argued that about 75* of the apparent exposure on an
unshielded respirator pad was actually due to impingement and
therefore not representative of potential Inhalable contaminates.
m
Further measurements of DDT by Wolfe [4] revealed the
respirator pad method gave values about two times as high as
breathing zone samples. Again, the author stated the results were
"considered to be about the same order of magnitude."
This method continues to be utilized in agricultural pesticide
sampling, e.g. see Winterlin, et. al [5] in a 1984 survey of
strawberry harvesters in California. Winterlin's 28 liter per
minute (1pm) "low flow" breathing zone results for captan and THPI
(tetrahydrophtalimide) were 2 to 5 times the respirator pad values
[assuming 10 1pm respiration rate as stated by the author; in
micrograms per cubic meter].
The results of these studies question the validity of
correlating respirator filter sampling to breathing zone air
sampling. However, all of the above cited studies assumed a single
worker breathing rate over the entire sampling period (8 1pm for
Batchelor, et. al. [3] and Wolfe [4] versus 10 1pm for Winterlin, et
al. [5]). This assumption was not well-founded if the workers used
multiple body positions (i.e. sitting, stemding, or walking) during
the operation. It was also not logical if the ph/sical workload
varied during the sampling period. Using improvements in estimating
the exact respiratory air volume of a worker, it was anticipated
that the respirator filter cartridge analysis method would
approximate the continuous breathing zone air sampling pump results.
Sampling Methods:
Sampling Location and Operations: Sampling was conducted at
three separate industrial areas at Pope Air Force Base located in
Fayatteville, North Carolina. The first area was a vehicle
maintenance facility. Work at this facility included body work and
spray painting on military cars, vans, and specialized vehicles.
All spray painting was conducted in an enclosed auto spray paint
booth. The paint booth ventilation system provided an average
exhaust ventialtion of 212 cubic feet per minute per square foot of
cross section (CFM/Ft^). This facility was used for sampling
painting operations for paint mist and organic vapors. Personnel
used an air atomization method of spraying to apply a mixture of
acrylic enamel, thinner and hardener (drier).
The second industrial area studied was an aircraft structual
repair shop used for sanding and painting specialized military
equipment such as aircraft engine housings and maintenance
scaffolding. Operations were conducted in a waterfall paint booth
which provided an average exhaust ventilation of 143.3 CFM/Pt^.
This facility was used for sampling sanding operations only.
Sanding operations utilized a pneumatic orbital disk sander.
The last industrial area was a fiberglass repair shop. The
personnel in this shop mended and sanded aircraft components. The
shop included two large paint booths with exhaust flow rates of 505
Jjjjk CFM/Ft2 and 488 CFM/Pt^. One sanding operation was sampled from
•
•
this shop. During this study personnel used a pneumatic orbital
disk Sander similar to that used in the sanding operations above.
The personnel in all areas wore cartridge-type respirators and
were previously monitored through industrial hygiene and respiratory
protection programs. The respirators worn during painting were
half-face dual filter (American Optical) with organic vapor
cartridges (R51A TC-23C-235) and dust/mist prefilter (R30
TC21C-144). The dust/mist filters were constructed of resin coated
composite fibers. During sanding operations the same model of
repirator was worn, but only the dust/mist filter was used.
Sampling Tecbniqaes & Analysis: Painting and sanding
operations were sampled for total dust and mist particulates.
Breathing zone dust samples were taken with 35 millimeter mixed
cellulose ester filters (0.8 micrometer; matched weight) in an open
face cassette. The sampling pumps (DuPont Alpha 1) were calibrated
to a flowrate of 2.0 liters per minute (1pm). During sampling, the
cassette filter was placed in the breathing zone of the subject by
attachment to the coverall collar. The filter cassette was attached
such that the filter was vertical (perpendicular to the floor) with
the open face directed towards the front of a standing worker. The
respirator samples were collected by installing new dust/mist
filters over each respirator cartridge. The filters were attached
over the organic vapor cartridges for painting operations. During
sanding operations, the organic vapor cartridges were removed and
the filters attached directly to the respirator. Both the membrane
-•
and respirator filters were analyzed by determining the pre-sampling
versus post-sampling weight changes utilizing an analytical balance
(Mettler 52L). i
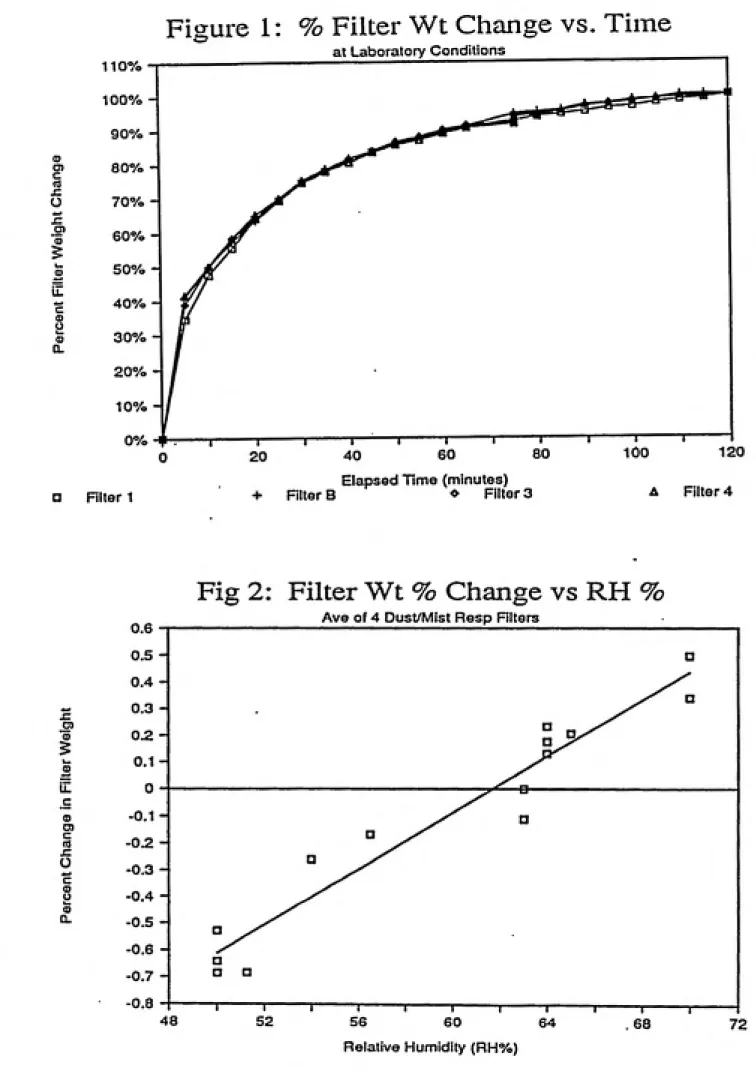
Initial sampling revealed the weight of the respirator filters
were influenced by the relative humidity and the elapsed time at
ambient laboratory conditions. Repeated weighting, over elapsed
time, showed that the weight of a resin coated respirator filter
changed over time vmtil an equilibritun weight was achieved. The
filter weight continued to change until elapsed time reached two
hours. A plot of percent of total filter weight change (during
elapsed time of two hours) versus elapsed time at ambient laboratory
conditions revealed an inverse exponential curve (Figure 1). This
figure indicated that 95S5 of the total weight gain/loss occurred
within 1.5 hours. Therefore, all samples (pre-weight and
post-weight) were analyzed after 1.5 hours of equilibration to ambient
laboratory conditions.
In addition, four (4) blank respirator filters were repeatedly
weighted over a period of several weeks at relative humidities
ranging from 50* to 70*. Thirteen (13) sets of measurements were
taken at eight (8) different relative humidities. A regression
curve was calculated from these measurements to estimate the average
percent change in filter weight versus relative humidity (Figure 2).
The regression indicated that the percent change in respirator
filter weight is determined by the relative humidity with the
Figure 1: % Filter Wt Change vs. Time
at Laboratory Conditions
110% 100% 90%
(D
80%
(0 x:
O 70%
0) 60% 5
®
il
50% 40%
Q.
30% 20% 10% 0%
120
Filter 1 + Filters FiltersElapsed Time (minutes) Filter 4
Fig 2: Filter Wt % Change vs RH %
0.6 0.5 0.4
*rf 0.3
s:
o>
ID 0.2
5
w 0.1
<D
il 0
c
(D -0.1
o>
c
(0 -0.2
£
O
-0.3
c
8 -0.4
(D Q.
-0.5 -0.6 -0.7 -0.8
Ave of 4 Dust/Mist Resp Filters
Relative Humidity (RH%)
% change in filter wt = [ 0.05233 X RHX ] - 3.2273
The percent change in filter weight is relatively small (-0.7* to
+0.585) with respect to changes in relative humidity. However, it
corresponds to corrections of up to 2.5 times the sample weight
(Table 1). This is explained by the fact that the sample weights
(2.1 mg to 27.1 mg) were only an average of 0.6 percent of the
respirator filter weights (2296.18 mg to 2664.24 mg). The
regression analysis was used to correct all respirator filter
sampling results.
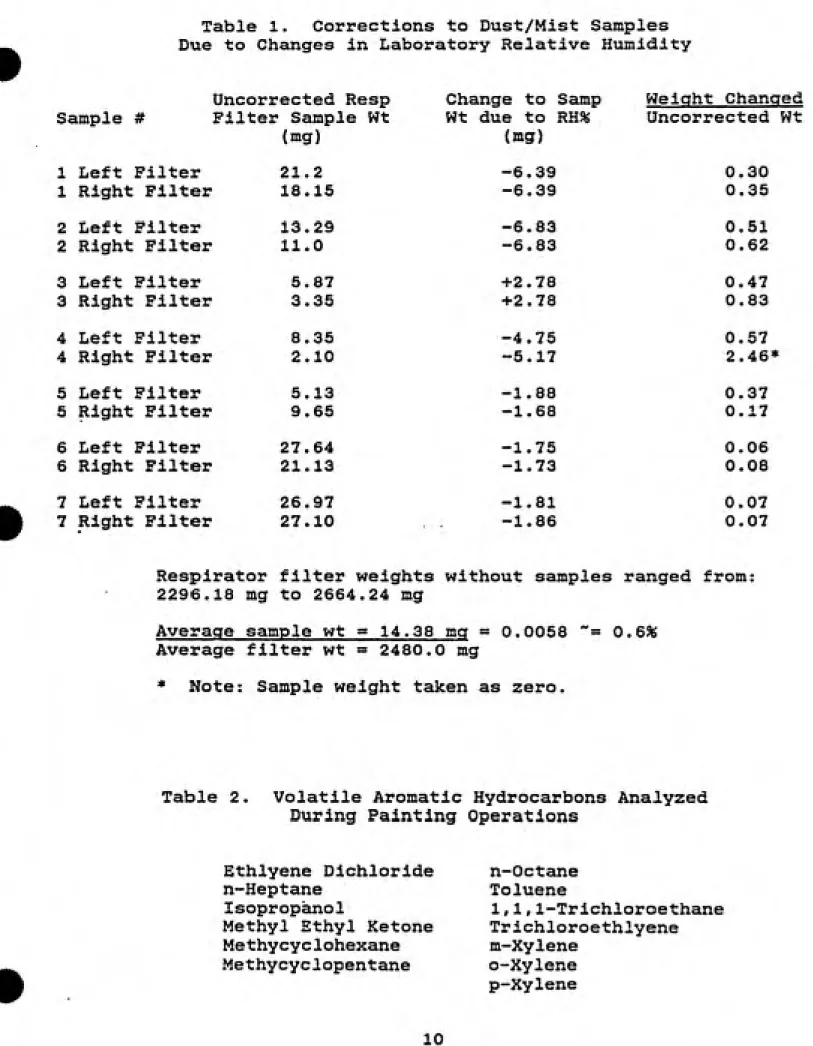
Three painting operations were sampled for detectable aromatic
hydrocarbons. A list of analyzed hydrocarbons can be found in Table
2. The breathing zone samples of painting operations were obtained
with large charcoal tubes (1 gram front portion, 0.25 grams rear
portion) at a flow rate of 1.0 1pm. New organic vapor respirator
cartridges were used for each sample. After each sample the
charcoal tube was capped and respirator cartridges wrapped in foil.
All samples were transported on ice to the laboratory, where they
remained until analyzed. All organic vapor samples were analyzed on
a Perkin Elmer 990 gas chromatograph auid analyzer. Desorption
efficiencies and blank analysis were determined for both the
charcoal tube and respirator cartridge. The average weight of
several blank organic vapor cartridges was approximately 52 grams of
activated charcoal.
•
Table 1. Corrections to Dust/Mist Samples
Due to Changes in Laboratory Relative Humidity
Uncorrected Resp
Sample # Filter Sample Wt
(jng) 1 Left Filter 21.2
1 Right Filter 18.15
2 Left Filter 13.29
2 Right Filter 11.0
3 Left Filter 5.87
3 Right Filter 3.35
4 Left Filter 8.35
4 Right Filter 2.10
5 Left Filter 5.13
5 Right Filter 9.65
6 Left Filter 27.64
6 Right Filter 21.13
7 Left Filter 26.97
7 Right Filter 27.10
Respirator filter weights without samples ranged from:
2296.18 mg to 2664.24 mg
Average sample wt = 14.38 mg = 0.0058 ~= 0.6*
Average filter wt = 2480.0 mg
Change to Samp
Wt due to RH%
(mg) Weight Uncorr Changed ected Wt -6.39 -6.39 0.30 0.35 -6.83 -6.83 0.51 0.62 +2.78 +2.78 0.47 0.83 -4.75 -5.17 0.57 2.46* -1.88 -1.68 0.37 0.17 -1.75 -1.73 0.06 0.08 -1.81 -1.86 0.07 0.07
Note: Sample weight taken as zero.
Table 2. Volatile Aromatic Hydrocarbons Analyzed
During Painting Operations
Ethlyene Dichloride n-Octane
n-Heptane TolueneIsopropanol 1,1,1-Trichloroethane
Methyl Ethyl Ketone Trichloroethlyene
Methycyclohexane m-Xylene
Methycyclopentane o-Xylene
p-Xylene
#
•
The respirator cartridges were removed from the freezer,
immediately opened, and the charcoal transfered into a 500 ml
beaker. The charcoal was thoroughly agitated for one minute. Then
five one-gram samples (ten for organic vapor samples #4 and #5) were
selected from the beaker. The beaker was agitated between each
sample. The samples were weighted in Miniert screw cap reaction
vials to +/- .0005 grams. The results of the five (or ten) grab
samples were averaged for each chemical constituent and multiplied
by 52.
The respirator and breathing zone results were compared by mass
collected per volume of air sampled. This concentration was
calculated by dividing the measured mass collected on the filters by
the volume of air that flowed through the respirator or sampling
pump. The volume of air flowing through the sampling pump was
determined by multiplying the average flowrate (pre-operation
calibration and post-operation calibration) by the pump operating
time. The respirator volumetric flowrate was calculated by a model
adapted from predictions of human respiration during exercise.
Respirator Airflow Estimates:
Previous respirator pad studies [2, 3, 4, 5] have shown that
the assumption of constant worker respiration over the sampling
period leads to inconsistent results. This research determined the
amount of air flowing through the respirator filters by a predictive
human respiration model adapted from Hansen, et al [6]. Hansen's
study predicted a range of expected breathing performance in normal
subjects during exercise. Measurements of the rate of oxygen uptake
(Vol Rate O2; ipm) and expired minute ventilation (Vol Rate Exp;
1pm) found different predictive ratios of Vol Rate Exp/Vol Rate O2
at progressive stages of exercise (Table 3).
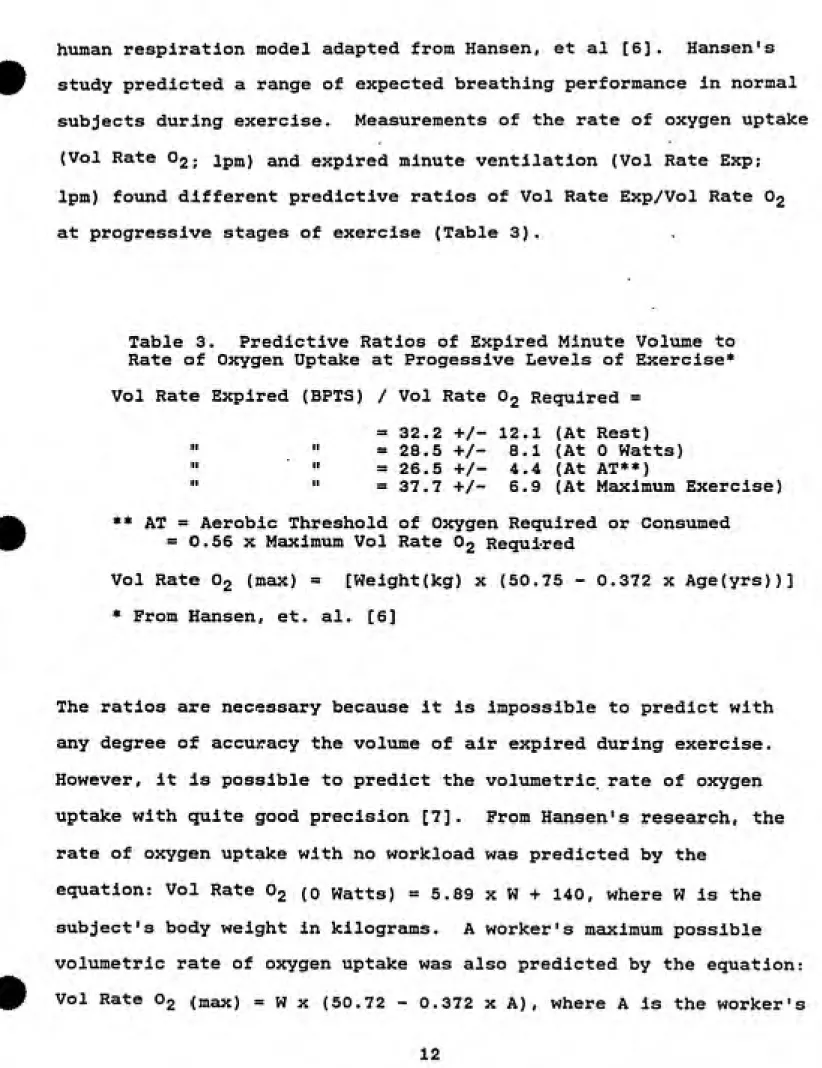
Table 3. Predictive Ratios of Expired Minute Volume to
Rate of Oxygen Uptake at Progessive Levels of Exercise*
Vol Rate Expired (BPTS) / Vol Rate O2 Required =
= 32.2 +/- 12.1 (At Rest) " =28.5 +/- 8.1 (At 0 Watts) " •• = 26.5 +/- 4.4 (At AT**)
" " =37.7 +/- 6.9 (At Maximum Exercise)
** AT = Aerobic Threshold of Oxygen Required or Consumed
= 0.56 X Maximum Vol Rate O2 Required
Vol Rate O2 (max) = [Weight(kg) x (50.75 - 0.372 x Age(Yrs))]
* From Hansen, et. al. [6]
The ratios are necessary because it is impossible to predict with
any degree of accuracy the volume of air expired during exercise.
However, it is possible to predict the volumetric rate of oxygen
uptake with quite good precision [7]. Prom Hansen's research, the
rate of oxygen uptake with no workload was predicted by the
equation: Vol Rate O2 (o Watts) = 5.89 x W + 140, where W is the
subject's body weight in kilograms. A worker's maximum possible
volumetric rate of oxygen uptake was also predicted by the equation:
Vol Rate O2 (max) = W x (50.72 - 0.372 x A), where A is the worker's
•
age in years. From these predictions, Hansen et. al. could
determine a worker's total volume of expired (or Inspired) air, if
the total rate of oxygen required during the task is known.
The rates of oxygen required during the sampled operations were
calculated in three steps. The first step was to estimate the total
work rate (power) necessary for the worker to perform the operation.
The second step was to subtract the worker's basal metabolic rate
from the total work rate to determine the actual physical work rate
of the operation. The final step was to calculate the worker's
Increase In the rate of oxygen required due to task. Then this
Increase was added to the rate of oxygen required at zero work rate
(0 watts). This yielded a total rate of oxygen required (1pm) per
work rate (watt) for the operation.
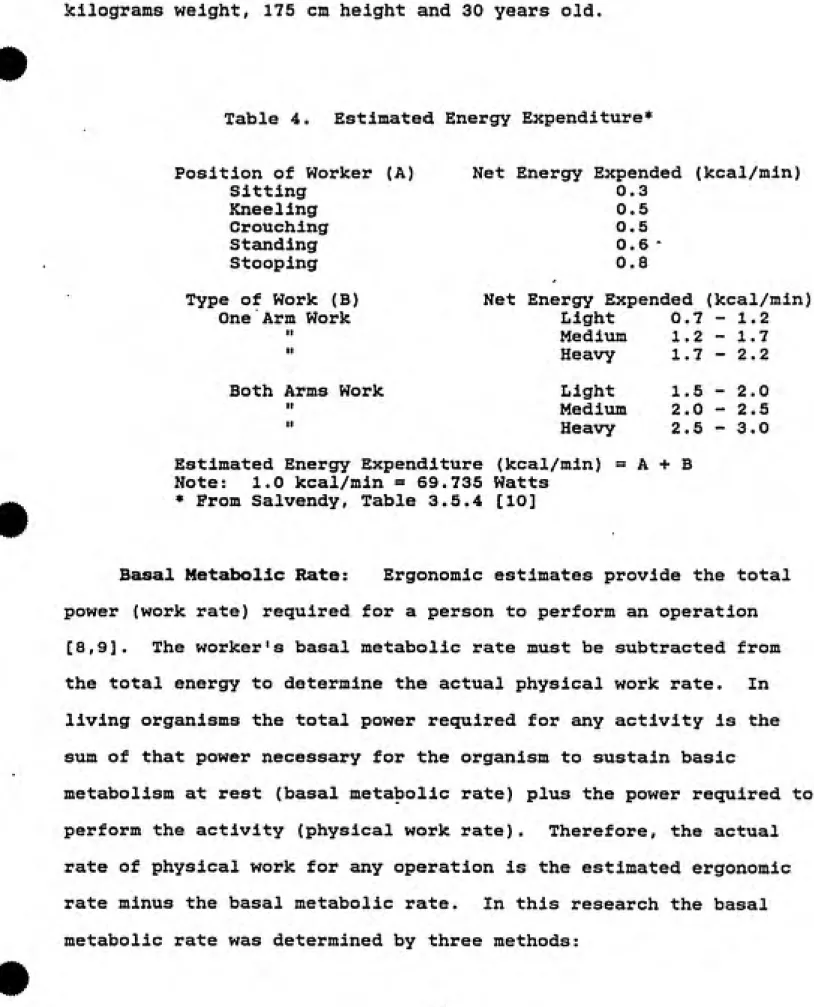
Ergonoaic Estimates of Total Energy Required: An estimate of
the operation work rate was determined from three (3) ergonomic
references. Krager and Hancock [8] list work rates for average
workers at specific operations. For this research, using Krager and
Hancock's list, both sanding and painting require a total work rate
of 3400 calories per minute. Passmore and Durnln [9] also list work
rates for average workers at specific operations. Both sanding and
painting require 2000 calories per minute using Passmore and
Durnln's list. Salvendy [10] does not list work rates by specific
operations, but uses estimates based on a worker's position and
movement. A copy of Salvendy's values are listed in Table 4. All
of these work rates are tabulated for a standardized man of 70
kilograms weight, 175 cm height and 30 years old.
•
•
•
Table 4. Estimated Energy Expenditure*
Position of Worker (A) Net Energy Expended (kcal/min) Sitting 0.3
Kneeling 0.5
Crouching 0.5
Standing 0.6 -Stooping 0.8
Type of Work (B) Net Energy Expended (kcal/min)
One Arm Work Light 0.7 - 1.2
Medium 1.2-1.7
" Heavy 1.7 - 2.2
Both Arms Work Light 1.5-2.0 " Medium 2.0 - 2.5 " Heavy 2.5 - 3.0
Estimated Energy Expenditure (kcal/min) = A + B
Note: 1.0 kcal/min = 69.735 Watts
* From Salvendy, Table 3.5.4 [10]
Basal Metabolic Rate: Ergonomic estimates provide the total
power (work rate) required for a person to perform an operation
[8,9]. The worker's basal metabolic rate must be subtracted from
the total energy to determine the actual physical work rate. In
living organisms the total power required for any activity is the
sum of that power necessary for the organism to sustain basic
metabolism at rest (basal metabolic rate) plus the power required to
perform the activity (physical work rate). Therefore, the actual
rate of physical work for any operation is the estimated ergonomic
rate minus the basal metabolic rate. In this research the basal
metabolic rate was determined by three methods:
1) Calculate the rate of oxygen required at rest as
follows: Vol Rate Og (rest;ml/min.) = Vol Rate Og (0 Watts) =
( 5.89 X Weight (kg) ) + 140 [6], The power required at rest was
then calculated from the inverse of 9.3 (+/- 1.35) milliliters of
oxygen per minute required per watt required [6].
2) Calculate the rate of oxygen required at rest as
follows: Vol Rate O2 (rest;ml/min.) = Vol Rate O2 (0 Watts) =
( 5.89 X Weight (kg) ) + 140 [6]. The rate of energy required at
rest was then calculated from the inverse of 11.5 milliliters of
oxygen per minute required or consumed per watt required [11].
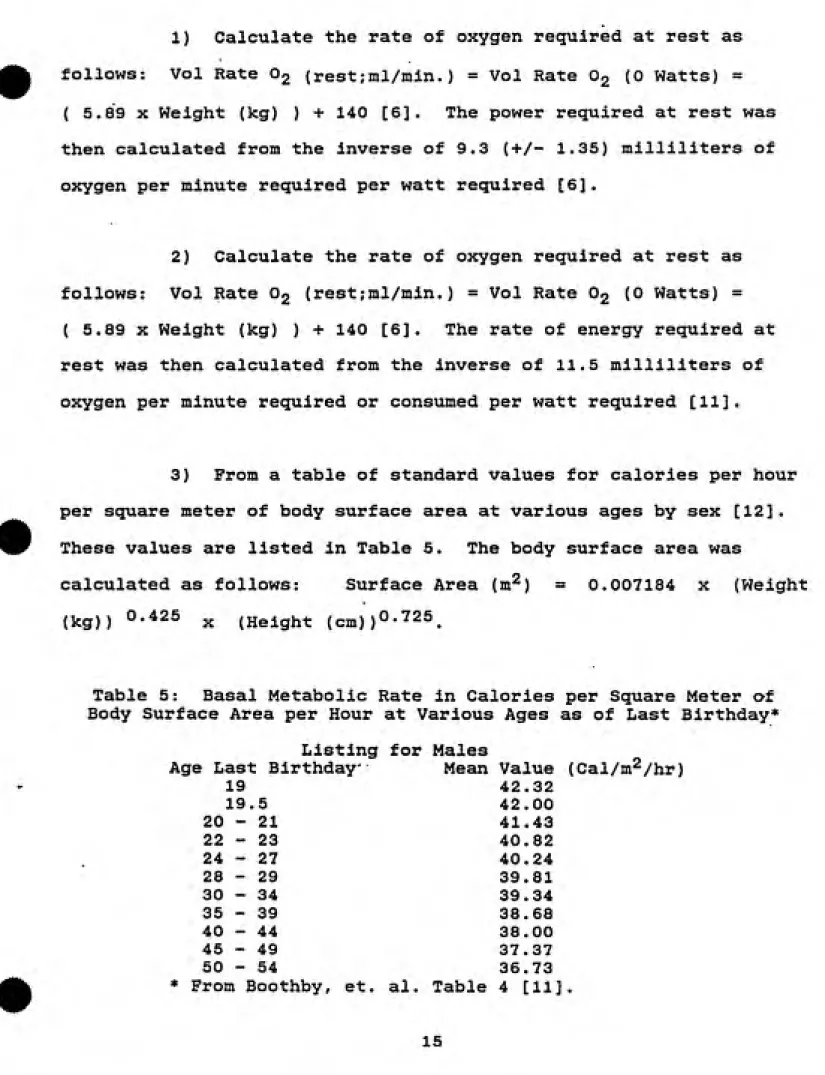
3) From a table of standard values for calories per hour
per square meter of body surface area at various ages by sex [12].
These values are listed in Table 5. The body surface area was
calculated as follows: Surface Area (m^) = 0.007184 x (Weight
(kg)) 0-425 ^ (Height (cm))0-'25^
Table 5: Basal Metabolic Rate in Calories per Square Meter of Body Surface Area per Hour at Various Ages as of Last Birthday*
Listing for Males
Age Last Birthday Mean Value (Cal/m^/hr)
19 42.32 19.5 42.00
20 - 21 41.43 22-23 40.82
24 - 27 40.24 28-29 39.81 30 - 34 39.34 35-39 38.68 40-44 38.00 45-49 37.37 50-54 36.73 * From Boothby, et. al. Table 4 [11].
•
Volumetric Rate of Oscygen Required Per Work Rate: With the
actual physical rate known, the total rate of oxygen required per
work rate was calculated from the rate of oxygen required at no work
(0 Watts; see equation above) plus the increase in rate of oxygen
uptake caused by the physical work rate. The increase in Vol Rate
©2 required per increase in work rate was determined from two (2)
references. Hansen's [6] model assumed an increase of 9.3
(+/-1.35) milliliters of oxygen per minute per increased watt of
physical work rate (0.0093 Ipm/watt). The Handbook of Respiration
[11] assumed an increase of 13.94 milliliters of oxygen per minute
per increased watt of physical work rate (0.01394 Ipm/watt).
Consequently, a worker's volumetric rate of oxygen (1pm of Og),
strictly due to the task, will be the power required by the task
(watts) multiplied by the increase in Vol Rate O2 per increase in
work rate (Ipm/watt). Finally, a worker's total volumetric rate of
oxygen was calculated as the sxim of the Vol Rate O2 (0 Watts) plus
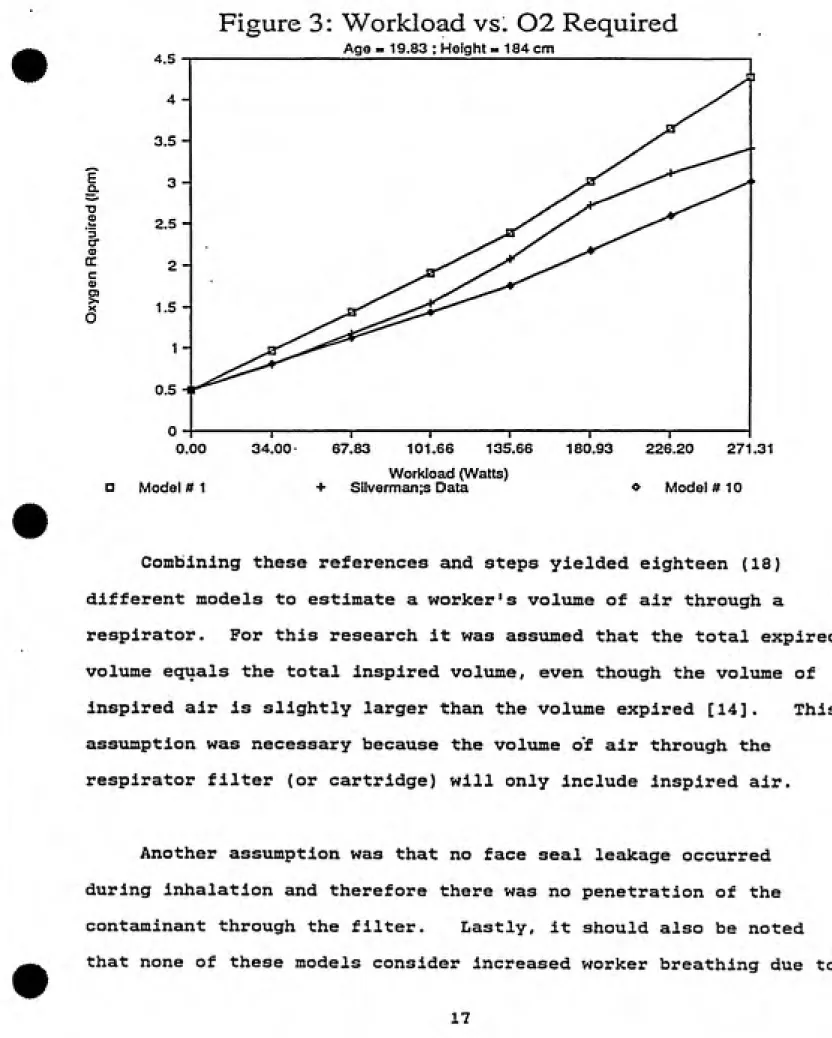
the Vol Rate Og strictly due to the operation. To validate the
calculation of total Vol Rate Og required during a task, these
models were compared with published clinical data on ventilation
rates with respiratory resistance at various workloads [13]. The
models demonstrate excellent .agreement as shown in Figure 3.
Total Volnae of Air Escpired: From the calculated total rate of
oxygen required and the predicted ratios of Vol Rate Exp/Vol Rate
O2, the total volume of expired air was computed by knowing the
duration of the task. Total volume of expired air = Total volmetric
rate of oxygen X Vol rate expired/Vol rate Og X time of operation.
E
a
ͣ
o ID
ͣ
5
cr
a
QC
c a>
O
4.5
Figure 3: Workload vs. 02 Required
0.00
a Model # 1
Age = 19.83 ; Height = 184 cm
34.00 67.83 101.66 135.66 180.93 226.20 271.31
« Model # 10
Workload (Watts)
Silverman;s Data
Combining these references and steps yielded eighteen (18)
different models to estimate a worker's volume of air through a
respirator. For this research it was assumed that the total expired
volume equals the total inspired volume, even though the volume of
inspired air is slightly larger than the volume expired [14]. This
assumption was necessary because the volume of air through the
respirator filter (or cartridge) will only include inspired air.
Another assumption was that no face seal leakage occurred
during inhalation and therefore there was no penetration of the
contaminant through the filter. Lastly, it should also be noted
that none of these models consider increased worker breathing due to
the resistance of increased respirator filter load. For the
simplicity of the models and the short sampling times involved
(maximum length was 2 hours), it was assumed that these factors were
negligible.
Resalts and Dlscrassion;
Operations saapled: There were seven dust/mist samples
collected: four samples during sanding on painted metal, one sample
while sanding on unpainted fiberglass, and two from spray painting
procedures. In addition there were five organic vapor samples
carried out during the spray painting operations. The subjects
sampled were all males with ages ranging from 21 to 50 years
(average = 26.3 years; standard deviation = 8.08 years). The
lengths of operations sampled ranged from 20 to 120 minutes (average
= 54.67 min; S.D. = 26.84 min). The seven dust/mist samples
included four different individuals. The four sanding samples (#1,
#2, #6, and #7) were all from the same person. The five organic
vapor samples included three different individuals two of which werealso included in the dust/mist samples (0V-#3 in dust/mist #3; OV-4
and OV-5 in dust/mist #4). In total, over the twelve samples, five
(5) different individuals participated in the sampling. During all
operations, except organic vapor samples #1 and #2, the respirators
were worn during the entire breathing zone sampling period. During
dust/mist samples #1, #2, #6 and #7, the subject also wore a full
faceshield which partially blocked the respirator filters.
•
Observations of Operations: The sanding operations involved
standing, sitting, stooping and kneeling, while the painting
operations only involved standing and stooping (Appendix I). During
organic vapor samples #1 and #2, the subject's respirator was
removed each time the paint spray gun was refilled. However, the
charcoal tube sampling pump was not shut off during refilling.
Refilling the spray paint gun was accomplished outside the
paint spray booth on a table adjacent to a large open overhead
doorway. The subject poured a mixture of paint, thinner and
hardener into the paint spray-gun receptacle and agitated the
mixture with a stick. The refilling operation lasted from 2 to 12
minutes. The paint spray gun would operate from 10 to 24 minutes
between refills. For organic vapor sample #1, the paint spray gun was refilled seven (7) times for a total of 38 minutes. Organic
vapor sample # 2 included four (4) refills for a total of 20
minutes. During the remaining organic vapor samples the worker was
asked wear the respirator during paint spray gun refills.
General Trends of Raw Data: The weights of dust/mist sampling
and organic vapor sampling may be found in Appendix II. Breatiiing
zone samples during sanding operations measured from 0.47 to 5.29
milligrams (mg) of dust, while the respirator filters measured from
10.63 to 50.46 mg. The painting operations breathing zone mist
samples ranged from 0.63 to 1.12 mg, while the respirator filters
measured from 3.60 to 4.19 mg. There was no observable trend over
the seven (7) samples between the ratio of respirator cartridge
ͣ
sample weight to breathing zone membrane filter sample weight. The
ratios of the weights ranged from 3.7 to 25.3 and did not correspond
to the length of sampling time.
Weight corrections for respirator filter pads by relative
humidity ranged from -6.83 to +2.42 mg (Table 1). Weight
corrections were not applied to the breathing zone dust/mist
samples. In sample #4, the right cartridge respirator pad had a
negative sample value when the weight correction was applied. In
this case the sample value taken as 0 mg and the left respirator
cartridge filter weight used for the total weight.
For all orgeuiic vapor samples the respirator cartridges
measured more mass per constituent than the charcoal filter tube.
There were no observable trends for the ratios of respirator
cartridge constituent mass to charcoal tube constituent mass among
or between samples (Table 6). However, for seven (7) constituents,
1,1,1-trichloroethane in OV Sample #1 (OV-1); isopropanol in OV
Sample #2 (OV-2); m-xylene in OV Sample #3 (OV-3); isopentane,
n-octane, and isopropanol in OV Sample #4 (OV-4); and n-hexane in OV
Sample #5 (OV-5), the constituent was detected in the charcoal tube,
but not in the respirator cartridges (first case). Three (3)
constituents; methyl ethyl ketone and 1,1,1-trichloroethane in
OV-3; and 1,1,1-trichloroethane in OV-5, were detected in the
respirator cartridges, but not in the charcoal tube (second case).
(See Appendix II).
•
Table 6: Ratios of Charcoal Tube to Respirator Organic Uapor Cartridge Sampling Results
to Chemical MethyI eye1opentane n-Heptane Cyclohexane Methy1 eye1ohexane n-Octane
Methyl Ethyl Ketone Isopropanol
Tr i ch1oroethy1ene Toluene Ethlyene Dichloride p-Xylene m-Xylene o-Xylene Model *17 used for resp vol
Chemical Methy1 eye1opentane n-Heptane Cyolohexane Methy1 eye1ohexane n-Qetane
Methyl Ethyl Ketone
Isopropanol Tr i ch1oroethy1ene
Toluene
Ethlyene Dichloride
pi-Xylene rri-Xylenc c«-Xylene
Samp * OU-1 BZ / Resp mg / mg
0.07 0.09 0.02 0.05 0.05 0.16 0.07 0.07 0.10 0.07 0.05 o:o6
Samp * GU-1 BZ / Resp
mg/m'*>3 / mg/m'^S (note 1) 1.00 1.19 0.22 0.67 0.75 2.27 0.99 0.99 1.44 0.92 0.75 o.ei
Samp # OU-2 B2 / Resp mg / mg
0.09 0.10 0.06 0,06 0.07 0.08 0.0? 0.09 0.06 0.05 0.05
Samp * OU-2 B2 / Resp mg/m'^S / mg/m'^3 (note 2) 2.01 2.3? 1.40 1.51 1.64 2. 1. 2. 1. 1. 1. 07 78 24 39 16 13
Samp # OU-3 BZ / Resp mg / mg
0.05 0.05 0.03 0.00 0.06 0.03 0.05 0.15 0.04 0.04
Samp * OU-3 BZ / Resp mg/m'*'3 / mg/m'^3 1.88 2.41 1.56 0.00 2.99 1.49 2.55 7.42 2.17 1.79
Samp * OU-4 BZ / Resp mg / mg
0.05 0.06 0.04 0.06 0.06 0.08
Samp * OU-4 BZ / Resp mg/m'"3 /
fng/m'^3
1.74 2.19
1.34
Note' 1: BZ result includes 38 minutes during refilling wh
NotG' 2: BZ result includes 20 minutes during refilling uili
2.16
2.34
2.80
en respirator
en resp i rator
Samp * 0U~5 BZ / Resp mg / mg
0.05 0.03 0.03 0.04 0.01 0.05 0,04 0.06 0.04 0.04 0.03
•
The detection of some constituents in one method and not the
other were probably caused by two different events. In the first
case, the detection of constituents in the charcoal tube, but not in
the respirator cartridge was probably caused by the greater
analytical sensitivity of the charcoal tube. The constituents were
detected in relatively low quantities in the charcoal tubes and thus
may have been present in the respirator cartridges, but below
detectable limits. The analytical detection limit of the respirator
cartridges was over ten times (lOx) higher (i.e. less sensitive)
than the charcoal tubes. This was a consequence of the application
of grab sampling from the total weights of charcoal in the
respirator filter cartridges. In the charcoal tubes, the entire
samples of activated charcoal were analyzed.
In the second case constituents were detected in the respirator
cartridge but not in the charcoal tube. This was probably caused by
contamination of the respirator cartridge samples. In both samples
where this event occurred (OV-3 and OV-5) the respirator cartridges
were stored in the laboratory the longest amount of time before
analysis (up to 30 days). In addition, the constituents were
detected in fairly low concentrations and with very poor precision.
In two cases, methyl ethyl ketone in OV-3 and 1,1,1-trichloroethane
in OV-5, the precision was so inadequate that the standard deviation
of the analysis was greater than the actual amount detected.
Respirator Air Flow Models: The volume of air sampled through
a worker's respirator was calculated from a model developed by
Hansen, et al, [6] and modified with respect to increased rate of
oxygen required per increase in work rate (Ipm/watt); the total work
rate required for the operation (watts); and basal metabolic rate
(watts). All 18 models were applied to each of the seven dust/mist
samples (see Appendix III). Models were rejected if the required
total volumetric rate of oxygen (1pm) for the operation exceed the
subject's calculated maximum possible volumetric rate of oxygen.
For models that calculated total work rate required based on the
worker's position (i.e. standing, walking; models #4, #5, #6, #13,
#14, and #15), any model was rejected even if only one subject
position in one sample met this criteria. Of the 18 models only
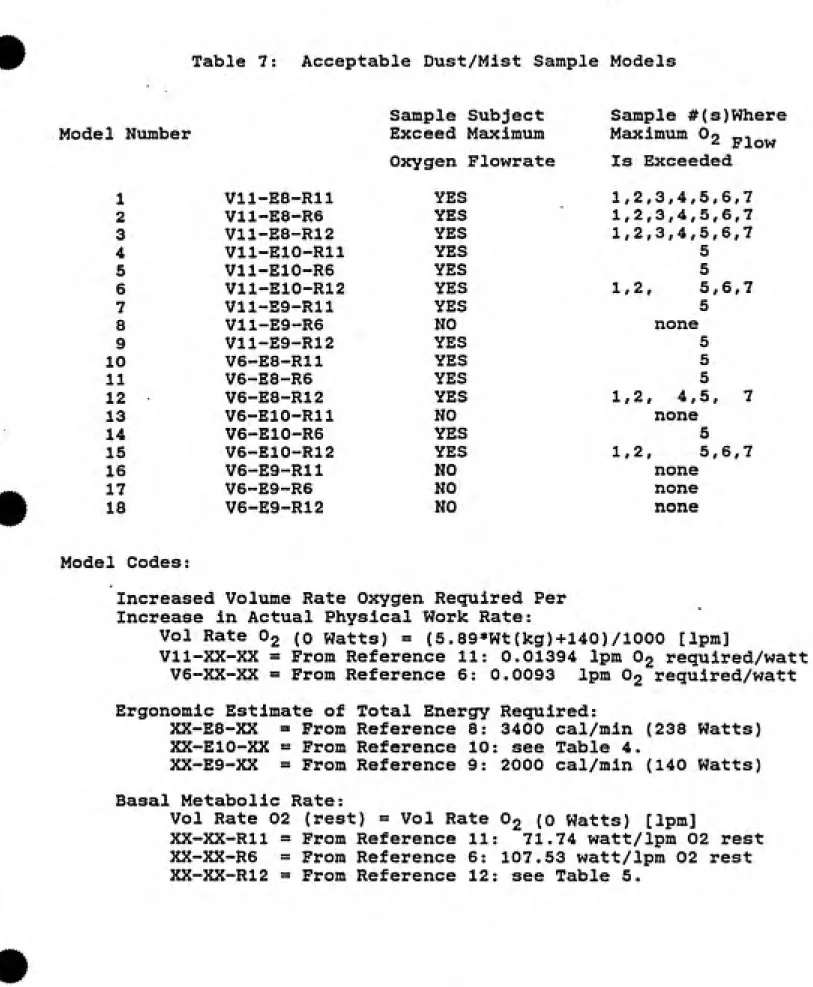
five (5) were acceptable for all the dust/mist samples. The
acceptable models are annotated in Table 7.
To determine if the accepted models provided legitimate
estimates of total inspired volume, the calculated rates of
expiration were compared to published ventilatory patterns measured
during exercise [5]. Published studies measured expired minute
volumes of 20.0 (+/- 5.5) 1pm up to 93.3 (+/- 23.0) 1pm at
various stages of exercise. The acceptable respirator air flow
models from this research calculated an average expiration rate of
56.3, 46.4, 43.0, 37.0, and 55.0 1pm for models #8, #13, #16, #17,
and #18, respectively. All of the models fall within a range of
expiration rates that would indicate a moderate level of exercise,
which was expected from operations such as sanding and painting.
Table 7: Acceptable Dust/Mist Sample Models
Model Number
Sample Subject
Exceed Maximum
Oxygen Flowrate
1 V11-E8-R11 YES
2 V11-E8-R6 YES
3 V11-E8-R12 YES
A Vll-ElO-Rll YES
S V11-E10-R6 YES
6 V11-E10-R12 YES
7 V11-E9-R11 YES
8 V11-E9-R6 NO
9 V11-E9-R12 YES
10 V6-E8-R11 YES
11 V6-E8-R6 YES
12 V6-E8-R12 YES
13 V6-E10-R11 NO
14 V6-E10-R6 YES
15 V6-E10-R12 YES
16 V6-E9-R11 NO
17 V6-E9-R6 NO
18 V6-E9-R12 NO
Model Codes:
Sample #(s)Where Maximum Oo _,
^ Flow
Is Exceeded 1,2,3,4,5,6,7 1,2,3,4,5,6,7 1,2,3,4,5,6,7 5 5
1,2, 5,6,7
5
none
5 5 5
1,2, 4,5, 7
none
5
1.2, 5,6,7
none
none
none
Increased Volume Rate Oxygen Required Per Increase in Actual Physical Work Rate:
Vol Rate ©2 (0 Watts) = (5.89*Wt(kg)+140)/lOOO [1pm]
Vll-XX-XX = From Reference 11: 0.01394 1pm O2 required/watt
V6-XX-XX = From Reference 6: 0.0093 1pm O2 required/watt
Ergonomic Estimate of Total Energy Required:
XX-E8-XX = Prom Reference 8: 3400 cal/min (238 Watts)
XX-EIO-XX = From Reference 10: see Table 4.
XX-E9-XX = From Reference 9: 2000 cal/min (140 Watts)
Basal Metabolic Rate:
Vol Rate 02 (rest) = Vol Rate
XX-XX-Rll = From Reference 11 XX-XX-R6 = From Reference 6:
XX-XX-R12 = From Reference 12
O2 (0 Watts) [1pm]
71.74 watt/lpm 02 rest
107.53 watt/lpm 02 rest see Table 5.
•
Particle Sizing of Dust/Mist Seunples: Particle sizing was
conducted to distinguish discrepancies between initial sanding and
painting sampling results. By comparing particle sizes with
published data, it was possible to determined if the operations were
representative of typical industrial processes. During dust/mist
samples #2 (sanding) and #3 (painting), 5 and 10 minute samples were
obtained for particle sizing. The samples were taken in the
breathing zone of the subject during the operation with a membrane
filter cassette (0.8 urn matched weight). The sampling pump was
calibrated to 2.0 1pm. The samples were optically sized with a
porton graticule (Ernst Leltz Wetzler Binocular Microscope; 12.5x
eyepiece, lOx object). The porton graticule was calibrated with a
stage micrometer. The corresponding diameters of the porton numbers
were determined by linear regression (Appendix V).
The results of sizing the 5 and 10 minute spray painting
samples were identical. A count of 9 fields in each sample measured
particle sizes ranging from 0.716 to 16.84 micrometers. The count
median aerodymanlc diameters (CMAD) were 0.716 microns and the mass
median aerodynamic diameters (MMAD) were 5.44 microns. This result
agrees with the results by Chan, et al. [15] who measured MMAD of
4.7 - 6.6 microns for conventional air-atomized paint spray guns.
Likewise, the results of the 5 and 10 minute sanding samples
were identical. A count of 9 fields in each sample measured
particle diameters from 3.74 to 76.0 microns, with a CMAD of 7.934
microns and MMAD of 52.1 microns. The approximate 10 fold increase
m
m
in MMAD for sanding versus painting is anticipated because of the
abrasive method in which particulates were generated during sanding.
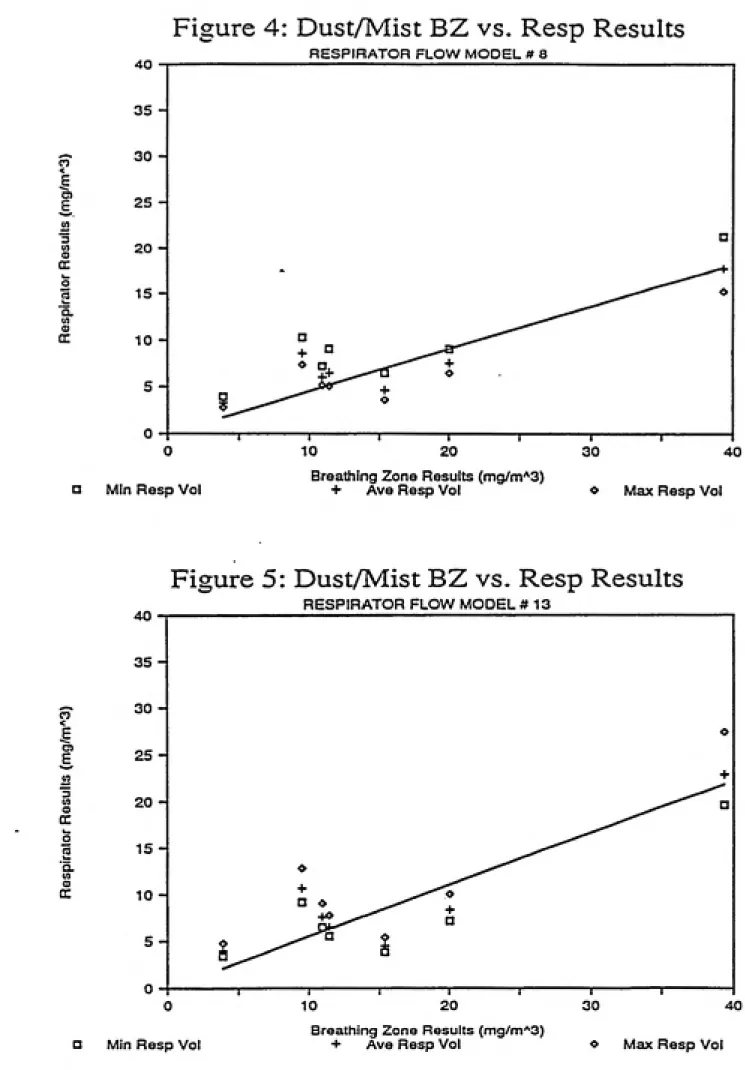
Trends of Calculated Data for Dust/Mist Samples: For all of
the acceptable models, the dust/mist breathing zone results were 1.5
to 2.2 times the respirator filter samples (See Appendix III).
Respirator flowrate models #13 and #18 determined the respirator
concentrations for all dust/mist operations less than the comparable
breathing zone results. Only in samples #1 and #2 (sanding
operations) with respirator flowrate models #8, #16 and #17 did the
respirator filter results exceed the breathing zone values. Figures
4-8 show dust/mist sampling results by respirator filter versus
breathing zone results for respirator flow rate models #8, #13, #16,
#17 and # 18, respectively. Linear regression (with a zero
intercept) of all dust/mist sample results produced coefficients of
2.22 (model #8), 1.79 (model #13), 1.57 (model #16), 1.47 (model
#17), and 1.89 (model #18) for breathing zone (BZ) versus respirator
filter pad (RFP) results (i.e. BZ = coefficient X RFP).
There ware several reasons why the respirator filter pad
results could be less than the breathing zone values. One
possibility was a poor fitting respirator. In this research, one of
the assumptions necessary to model airflow through a respirator was
no respirator face seal leakage during inhalation. However, after
one painting sample there was irrefutable physical evidence of mask
leakage. Paint spots were visible around the subject's nose where
the respirator should have provided a tight seal. If the respirator
o
I
3
(O
ID
a: w
O a
w
ͣ
3.
u
o
Figure 4: Dust/Mist BZ vs. Resp Results
RESPIRATOR FLOW MODEL # 8a Min Resp Vol
Breathing Zone Results (mg/m'^3)
+ Ave Resp Vol * Max Resp Vol
•
n <
M
<0
OC
o
o
a. (0
(D
s
Figure 5: Dust/Mist BZ vs. Resp Results
RESPIRATOR FLOW MODEL # 13
a Min Resp Vol
Breathing Zone Results (mg/m'^3)
+ Ave Resp Vol « Max Resp Vol
< E 3 n o cr w O •3. M O QC
Figure 6: Dust/Mist BZ vs. Resp Results
RESPIRATOR FLOW MODEL # 16
40 35 -ͤ 30 -+
25-^^^-""""^ *
20-15 - n
10
-+
+
5-0---1---1---1---1---1---1---
—1---1
10 20
n Min Resp Vol
Breathing Zone Results (mg/m'^S)
+ Ave Resp Vol
30 40
« Max Resp Vol
03 < e "v. O) 3 M O cc O rt ͣ s. (0 QC
Figure 7: Dust/Mist BZ vs. Resp Results
An — RESPIRATOR FLOW MODEL # 17
a 35- 30-•¥ 25 -« 20-ͤ 15 - 10-+
^^
+ S0 -a + ^ ---1---a 1---1---1---1---10 20 30 40
Q Min Resp Vol Breathing Zone Results (mg/m^3)+ Av« Resp Vol
•
Figure 8: Dust/Mist BZ vs. Resp Results
40
RESPIRATOR FLOW MODEL # 18
35
-n 30
<
E
f
25M
3 M
nr
20
i
I
151
o
OC 10
5
-ͤ
Min Resp Vol Breathing Zone Results (mg/nr^S)+ Ave Resp Vol * Max Resp Vol
fit were deficient, the flow of air through the filter pads would be
diminished, thus decreasing the amount of paint mist deposited on
the filter.
Another possibility was the influence of the faceshield
blocking the respirator filters, but not the breathing zone cassette
filters, for samples #1, #2, #6, and #7. The faceshield would
impede the impaction of large particles onto the respirator pads.
This is significant because of the relatively large particle sizes
(MMAD 52 um) of the sanding dust. However, the effect of the
faceshield would make the respirator pads more representative of the
true breathing zone concentration. The cassette filter sample,
being outside the faceshield, would overestimate the particulate
•
concentration susceptible to inhalation. This was analogous to
studies that indicated the concentrations of welding fumes outside a
welders helmet were 3.3 - 15 times the concentration inside the
helmet [16].
A third possiblity for discrepancies were errors in determining
the sample weights deposited on the respirator filter pads. The
corrections to respirator filter weight due to changes in relative
hximidity in the laboratory (Table 1) were based on limited data (4
filters @ 14 days). Because comparatively minute variations in
relative humidity corresponded in several samples (#2 and #4) to
large deductions in sample weight, small errors in the relative
humidity correction factor lead to significant differences in the
amount of sample detected.
Additional factors that would have effected this difference
were loss of sample during storage/transport and errors in
analytical balance measurements. However, these additional factors
are considered negligible.
Statistical Analysis for Dast/Nlst Samples: The breathing zone
and respirator cartridge sampling results were compared using a
Paired Student-t test protocol (MYSTAT Ver 2.0, Copyright (c) 1988,
Systat Inc., Evanston, II). The analysis determined if there was a
significant difference between the sampling means of the respirator
filter concentrations versus the breathing zone sampling pump
concentrations for the dust/mist sample. All five of the acceptable
#
#
respirator airflow models (average flowrates) were employed for the
comparison. Because the models provided a range of possible
respirator flowrates, the lower limits of this range {mimimum flow
rates) were also used to calculate resprator filter concentrations.
The minimvim flowrate concentrations were then compared to the
breathing zone results.
The results of paired student-t tests are listed in Table 8.
Of the five (5) acceptable respirator flow rate models, only model
#17 maintained no significant difference (95as confidence level)
between the breathing zone and respirator filter values for
dust/mist samples. For minimum flow rate values of acceptable
respirator models, all of the models have no significant difference
between the breathing zone and respirator filter pad results. This
outcome suggests that the respirator flow rate models overestimated
the actual worker inspiration rates. However, operational
differences such as the faceshield covering during sanding and leaks
around the edge of the respirator during painting interfered with
quantifying this difference.
Trends of Calculated Data for Organic Vapor Samples:
Respirator airflow model #17 was the only model to show no
significant differences between the respirator and breathing zone
dust/mist concentrations. Therefore, all of the respirator
cartridge sampling results utilized this model for calculating
workplace concentrations. The organic vapor sampling results
indicated the breathing zone charcoal tube constituents were 1.5 to
•
Table 8 Paired Student-t Test Results
Average Breathing Mean Std. Dev. T P
Zone Difference Difference Value Value
Versus
~ " ALL DUST / MIST SAMPLES ~ ~
Model #8 6.650 6.585 2.636 0.030
Average Model #13 8.376 7.384 3.001 0.038
Flow Model #16 5.123 6.034 2.246 0.045 Rate Model #17 4.449 5.965 1.973 0.088*
Model #18 7.019 6.770 2.743 0.027
Model #8 4.723 5.954 2.099 0.081* Minimum Model #13 6.189 6.834 2.396 0.054*
Flow Model #16 2.801 5.574 1.330 0.232*
Rate Model #17 0.227 5.439 0.110 0.916* Model #18 5.271 6.121 2.279 0.063*
- ~ ALL DETECTED ORGANIC VAPOR CONSTITUENTS
-Ave OV-1 (all) 0.571 2.792 0.678 0.513*
Flow OV-2 (all) 3.655 4.004 3.028 0.013
Rate** OV-3 (all) 2.746 3.914 2.219 0.054*
OV-4 (all) 2.613 4.800 1.440 0.200*
OV-5 (all) 0.616 8.141 0.251 0.807*
~ ~ SPECIFIC ORGANIC3 VAPOR CONSTITUENTS ~ ~
Methylcyclo-pentane 0.286 0.267 2.397 0.075*
Ave n-Heptane 1.396 1.396 2.281 0.085*
Plow Toluene 7.434 5.421 3.066 0.037
Rate** p-Xylene 0.806 0.638 2.826 0.048
o-Xylene 0.348 0.619 1.257 0.277*
•
Note: OV = organic vapor (volatile aromatic hydrocarbons) samples (all constituents; See Table 5)
* = No statistically significant difference at 95% confidence level
** = Using Respirator Flow Model # 17
2.5 times greater than the respirator cartridge constituents. There
was a general trend in the ratios of respirator cartridge to
charcoal tube (breathing zone) results within and between samples.
Within a sample the ratios were fairly constant among the
constituents, allowing for confidence limits due to the analytical
procedure. The ratios were about 1.0, 1.75, 2.7, 2.1 and 1.5 for
samples OV-1, OV-2, OV-3, OV-4, and OV-5, respectively, with
confidence allowances. However, OV-1 and OV-2 involved breathing
zone charcoal tube sampling while the worker refilled the paint gun
and did not wear the respirator. To correct for this discrepancy,
the exposures to the charcoal tube during the refill operations were
assumed to be zero and the concentration adjusted by subtracting the
duration of the refill operations (38 minutes in OV-1; 20 minutes in
OV-2) from the total sampling time. The adjusted ratios of
breathing zone charcoal tube concentrations to respirator cartridge
concentrations were 1.7 (OV-1) and 3.0 (OV-2). Disregarding the
results of OV-1 and OV-2 because of the inconsistencies in exposure
measurements, the ratios of charcoal tube to respirator cartridge
concentrations were fairly uniform approximately 2.0.
Figures 9 through 13 display the respirator cartridges results
versus charcoal tube (breathing zone) results for all the organic
vapor constituents detected. From linear regression (with intercept
at zero) the coefficient of charcoal tube to respirator cartridge
constituents were 1.06 1), 1.71 2), 1.94 3), 1.43
(OV-4), and 0.59 (OV-5). Figures 14 - 18 exhibit comparisons of
•
CO
<
1
I
ͣ
c
<
c
a
O
a
M o
ft
n
<
E
§
5
o
a
w o
cr
Figure 9: Organic Vapor Sample # 1
All Detected Constituents
Charcoal Tube (Breathing Zone) (mg/m'*3)
Figure 10: Organic Vapor Sample # 2
All Detected Constituents
Figure 11: Organic Vapor Sample # 3
All Detected Constituents
05
<
E
"S
ͣ
D O
§
<
t:
(9
o
a
cc
Charcoal Tube (Breathing Zone) (nng/m'^S)
Figure 12: Organic Vapor Sample # 4
<
I
<
o
a
Id m
All Detected Constituents
10 20 30
Charcoal Tube (Breathing Zone) (mg/m'^3)
40
Figure 13: Organic Vapor Sample # 5
Ail Detected Constituents
en
<
a
e
o
ͣ
o o o
<
i
O
«
8 12 16 20 24 Charcoal Tube (Breathing Zone) (mg/m*3)
03
E
?
o
(9
O
a
o
Figure 14: Organic Vapor Sample Results
For Methylcyclopentane
0.4 0.8 1.2
Charcoal Tube (Breathing Zone) (mg/nT*3)
n
<
o O
s
o
;3
o
a M
n
I
I
r <
c
(S
O
a.
M
(D
CC
Figure 15: Organic Vapor Sample Results
For n-Heptane
Charcoal Tube (Breathing Zone) (mg/nn'^3)
Figure 16: Organic Vapor Sample Results
For Toluene
Charcoal Tube (Breathing Zone) (mg/m*3)
n
^
I
r
n
O
a 9
Figure 17: Organic Vapor Sample Results
For p-Xylene
Charcoal Tube (Breathing Zone) (nng/m*3)
Figure 18: Organic Vapor Sample Results
•
n
<
a
o
<
I
a
M
oc
c * For o-Xylene
^^
4
-^
^
3
-a
^
2-•
^^
1-qO a
n
-c
1
J
1 1
2
---1---4
m
m
toluene, p-xylene and o-xylene. Calculated linear regression
coefficients for individual constituents were 1.30
(methylcyclopentane), 1.61 (n-heptane), 1.27 (toluene), 1.48
{p-xylene), and 1.10 (o-xylene).
One possible reason why the charcoal tube results were greater
than the respirator cartridges was the poor fitting respirators.
The affect is identical to the explanation of the discrepancy in
dust/mist samples. A consequence of this incident was the
implication that the respirator protection factorl (pp) would
actually be reduced to 2,0, instead of the assumed value of PF=10
for half-mask dual cartridge respirators.
Statistical Analysis for Organic Vapor Samples: The organic
vapor results were compared statistically by all non-zero
constituents in each sample and five (5) individual constituents
among samples (Table 8). For four (4) of the five (5) of the
volatile aromatic hydrocarbon samples, except OV-2, there was no
significant difference (9585 confidence level) between the charcoal
tube breathing zone results and the respirator cartridges when all
of the constituents were compared. For indvidual constituents,
three of the five, methylcyclohexane, h-heptane, and o-xylene,
demonstrated no significant differences between the charcoal tubes
1. The respirator protection factor is defined as the concentration outside the respirator divided by the concentration inside the
resprirator [17]. PP = Cone (out) / Cone (in).
and the respirator filter catridges. These outcomes signified that
^^P this method would be viable for workplace exposure screening samples
or estimating a resprirator workplace protection factor.
•
#
Conclusion;
It has been suggested that industrial airborne workplace
concentrations can be calculated based on the amount of contaminant
deposited on respirator cartridges and estimating the flowrate
through the respirator with ergonomic and respiratory ventilation
models.
The physiological models used in this research appear to
overestimate the actual flow, although several factors such as
respirator mask leakage, sensitivity of resin coated filter pads to
relative humidity, and differences in analytical sensitivities
between the methods made quantitative conclusions unreliable.
However, the results of the organic vapor respirator cartridges did
show countenance for this procedure in screening workplace exposures
or estimating a resprirator workplace protection factor [17, 18].
Further studies should be conducted to validate this method.
Additional studies might Include more subjects and operations and
probably include qualitative fit testing immediatly before and after
(and possibly during) the sampling.
#
•
Further studies may indicate that, like biological exposure
indicies [18], respirator cartridge analysis methods are
inconsistant to charcoal tube sampling because too many factors
influence the results. However, if the purpose of workplace
sampling is to determine the potential employee exposure, then the
affect of factors such as faceshields would make the respirator pad
analysis more representative of the true breathing zone
concentration.
References
1. First, M.W.: "Sampling and Analysis of Air Contaminants: An Overview." Appl. Ind. Hyg. 3{12):F20-F27 (1988).
2. Durham, W.F. and H.R. Wolfe: "Measurement of Exposure of
Workers to Pesticides." Bull. Wld. Hlth. Org. 26:75-91
(1962).
3. Batchelor, B.S. and K.C. Walker, in Durham, W.F. and H.R.
Wolfe: "Measurement of Exposure of Workers to Pesticides."
Bull. Wld. Hlth. Org. 26:75-91 (1962).
4. Wolfe, H.R., K.C. Walker, J.W. Elliot and W.F. Durham in
Durham, W.F. and H.R. Wolfe: "Measurement of Exposure of
Workers to Pesticides." Bull. Wld. Hlth. Org. 26:75-91 (1962).
5. Winterlin, W.L., W.W. Kilgore, C.R. Mourer and S.R. Schoen: "Worker Reentry Studies for Captan Applied to Strawberries in California." J. Agric. Food Chem. 32(3):665-672 (1984).
6. Hansen, J.E., D.Y. Sue and K. Wasserman: "Predicted Values for Clinical Exercise Testing." Am. Rev. Respir. Dis. 129:Suppl
S49-S55 (1984).
7. Whlpp, B.J., S.A. Ward and K. Wasserman: "Ventilatory Responses to Exercise and Their Control in Man." Am. Rev. Respir. Dis. 129:Suppl sl7-s20 (1984).
8. Krager, D.W. and W.M. Hancock: "Advanced Work Measurement."
Industrial Press, Inc. 1982. pp. 58-62.
9. Passmore, R. and J.V.G.A. Durnin: "Human Energy Expenditure."
Physiol. Rev. 35:801 (1955).
10. Salvendy, G.: "Handbook of Human Factors." New York: Wiley
Interscience Publication, 1987. Table 3.5.4.
11. National Academy of Sciences National Research Council:
"Handbook of Respiration." W.B. Sanders Company 1958.
12. Boothby, W.M., J. Berkson and H.I. Dunn: "Studies of the Energy of Metabolism of Normal Individuals: A Standard of
Basal Metabolism, With a Nomogram for Clinical Application."
Am. J. Physiol. 116:468, (1936).
13. Silverman, L., G. Lee, T. Plotkin, L.A. Sawyers and Yancey, A.R.: "Air Flow Measurements on Human Subjects
with and without Respiratory Resistance at Several Work Rates." Arch. Ind. Hyg. Occup. Med. 3:461-478 (1951).
•
14. Astrand, P.and K. Rodahl: "Textbook of Work Physiology,
Physiological Basis of Exercise. 3rd Ed. New York:
McGraw-Hill, 1986.
15. Chan, T.I., J.B. D'Arcy and R.M. Schreck: "High-Solids Paint
Overspray Aersols in a Spray Painting Booth: Particle Size
Analysis and Scrubber Efficiency." Am. Ind. Hyg. Assoc. J.
47(7):411-417 (1986).16. Anonymous: "Fume Measurements in the Helmet Region" in The
Welding Environment: A Research Report on Fumes and Gases
Generated During Welding. American Welding Society, 1973.
17. Hack, A., C. Fairchild and B.J. Skaggs: in "The Forum."
Am. Ind. Hyg. Assoc. J. 43(12):A12-16 (1982)18. American Congress of Governmental Industrial Hyglenists:
"Threshold Limit Values and Biological Exposure Indices for
1989-1990", ACGIH, Cincinnati, OH. 1989.
#
Appendix IOperation Observations by Sample
Sample # 1
Dust/Mist Sample # 1 Subject Info; Pneumatic disk sanding
inside paint booth Operation:
Breathing Zone Sampling Info:
Height: 182.88 cm
Weight: 81.64 kg Age: 25 yrs
Sex: M
Time Pump (on/off) 0959/1054
Total Sampling Time: 55 min
Flowrate (on/off;1pm) 2.04/1.97 Total Volume Sampled (liters) = 111
Membrane Filter Wt (post/pre or matched): 0.04992/0.04887
Respirator Sampling Info:
Left Filter Weights (Post/Pre):
Right Filter Weights (Post/Pre):
2.66993/2.64878 2.41849/2.40034
note: 2.0 hrs § room temp; No post incubation before weighting Blank correction is + 0.00639 grams/filter
Open face filter cartridges (no filter covers).
Observation:
Elapsed Time
hr: min
0 :00 - 0 :02 0 02 - 0 :35 0 :35 - 0 :43 0.43 - 0 :45 0 :45 - 0 .48 0:48 - 0 :51 0 :51 - 0 :55
1 Position Position
1 of sub.iect Time (min)
1 standing (prep) 2
1 standing 33
1 kneeling 8
1 sitting 2
1 standing 3
1 kneeling 3
1 standing 4
Respirator (on/off)
on
on
on
on
on
on
on
Ergonomic note:
Opei'ation required
two arm movement.
Total Respirator Time On »
Time Resp on Kneeling = Time Resp on Standing = Time Resp on Sitting =
55 min
11 min
42 min
2 min
Sample # 2
#
Dust/Mist Sample # 2 Subject Info:
Operation: Pneumatic disk sanding
inside paint booth
Breathing Zone Sampling Info:
Height: 182.88 cm Weight: 81.64 kg
Age: 25 yrs Sex: M
Time Pump (on/off) 1207/1306
Total Sampling Time: 59 min
Flowrate (on/off;1pm) 2.05/2.05
Total Volxime Sampled (liters) = 121
Membrane Filter Wt (post/pre or matched): 0.04937/0.04890
Respirator Sampling Info:
Left Filter Weights (Post/Pre):
Right Filter Weights (Post/Pre)
2.69486/2.68157 2.48315/2.47215
note: 2.0 hrs @ room temp; No post incubation before weighting
Blank correction is + 0.00683 grams/filter
Open face filter cartridges (no filter covers).
Observation;
Elapsed Time
hr:min
0:00 0:02 0:26 0:28
0:02
0:26 0:28 0:59
Position
of subject
Position
Time (min)
standing standing kneeling standing
(prep) 2
24 2 31
I Respirator
I (on/off)
I on
I on
I on
I on
Ergonomic note;
Total Respirator Time On = 59 min
Operation required
two arm movement.
Time Resp on Kneeling
Time Resp on Standing
2 min 57 min
Sample #3
Dust/Mist Sample # 3
Operation: Spray Painting
Breathing Zone Sampling Info:
Time Pump (on/off) 0840/0928
Total Sampling Time: 48 min
Flowrate (on/off;1pm) 2.04/2.04
Total Volume Sampled (liters) = 98
Membrane Filter Wt (post/pre or matched)
Respirator Sampling Info:
Left Filter Weights (Post/Pre):
Right Filter Weights (Post/Pre)
Subject Info;
Height 180.34 cm
Weight 88.45 kg
Age 26 yrs
Sex M
0.04912/0.04800
2.54415/2.53828 2.29953/2.29618
note: 1.5 hrs @ room temp; No post incubation before weighting
Blank correction is -0.002775 grams/filter
Dservation:
Elapsed Time
Position 1
Position 1 Respiratorof subject 1 Time (min) 1 (on/off)
0:00 - 0:07
stooping |
7 i on0:07-0:24 standing | 17
1 on 0:24 - 0:29
stand(refill) |
5 1 on0:29 - 0:35
standing |
6 1 on0:35 - 0:38
stand(fix gun) |
3 1 on0:38 - 0:48