163
Integrating information of the efficient and anti-efficient frontiers in
DEA analysis to assess location of solar plants: A case study in Iran
Ehsan Dehghani
1, Mohammad Saeed Jabalameli
1∗, Mir SamanPishvaee
1, Armin
Jabbarzadeh
11
School of Industrial Engineering, Iran University of Science and Technology, Tehran, Iran
[email protected], [email protected], [email protected], [email protected]
Abstract
The solar photovoltaic (PV) energy is one of the most promising sources of energy, which has attracted many interests. It is potentially the largest source of energy in the world and is capable to mitigate greenhouse gas (GHG) emissions significantly in comparison with fossil fuels. Location optimization of solar plants can play a vital role to rise the efficiency and performance of the solar PV systems. In this regard, this study aims at evaluating different areas for solar plants according to a set of social, geographical and technical criteria through a data envelopment analysis (DEA) model. The proposed DEA model considers both information of the efficient and anti-efficient frontiers in order to rise discrimination power in DEA analysis. The proposed approach is evaluated and validated via studying a real case study in Iran. The extracted results reveal the usefulness and applicability of the proposed DEA model in choosing appropriate locations for solar plants.
Keywords:
Data envelopment analysis, efficient frontier, anti-efficient frontier, photovoltaic, solar plant.1-
IntroductionIn the last years, the requirement to implement energy sources that are substitute to fossil fuels, whose usage is the main reason of air pollution, climate changes and global warming, is becoming very prominent. Public and political consciousness, technological progression and environmental degradation are factors that, at the dawn of third millennium, open real outlooks for development of the so-called renewable energies. Renewable energies derive from limitless sources and consequently all come directly or indirectly from the sun, which is the most abundant and the most widely distributed renewable energy in the world. Specially, PV technology converts solar energy directly into electrical energy employing the PV effect (Desideri et al., 2012). The solar PV energy is taken into account as one of the most promising options for future energy. The following are its advantages: (1) large availability of solar energy; (2) no noise and substantial emissions realizing during the function phase; (3) little needs for freshwater sources for the goal
*Corresponding author
ISSN: 1735-8272, Copyright c 2018 JISE. All rights reserved
Journal of Industrial and Systems Engineering Vol. 11, No. 1, pp. 163-179
164
of mirror washing and cooling; (4) application, where the power supply is not desirable and possible via network (5) high ability to mitigate GHG emissions; and (6) easy development of its grid system since fast implementation of PV plants.
However, solar PV energy has not still attained sufficient maturity and the high costs of PV systems in contrast to other electricity generation alternatives have until now hampered its rapid deployment (Bazilian et al., 2013; Chen et al., 2014). Therefore, great efforts must be performed for alleviating manufacturing costs and rising efficiencyin order to expedite the commercialization of the PV industry(Chen et al., 2014). Large-scale PV installations, as one of the most important applications of solar energy,can play an important role in energy supply, especially in shiny and remote regions (Azadeh et al., 2011). One of the main needs for successful large-scale PV installations is determining the optimal locations in order to achieve higher returns and maximize the performance of solar PV systems. However, different factors are responsible in this problem, which make decision making a complex task (Jun et al., 2014; Sabo et al., 2016).Indeed, locations with higher solar radiation are not necessarily suitable for solar plants when other criteria are also considred(Sabo et al., 2016).Accordingly, different methods are utlized in the literatere to cope with this problem. In this sense,Kengpol et al. (2013) used Geographical Information System (GIS) method to specify the optimum site for a solar power plant. Likewise, they proposed a hybrid method of AHP and fuzzy logic for evaluating the selected alternatives. Sánchez-Lozano et al. (2016) applied a two-stage approach for selecting the best locations of solar PV farms. In the first two-stage, they utlized a GIS method to obtain the suitable locations. Then, a multi-criteria decision modelis exploited for evaluating the seleted alternative. Using a GIS method, Sabo et al. (2016) determined optimal sites for large-scale PV systems installation in Peninsular Malaysia. In addition, they derived accurate predictions from optimal sites for three other important parameters including carbon emission reduction, energy generation potential and installation capacity.
DEA, as a powerful optimization tool, is a mathematical model in order to assess the performance of homogeneous decision-making units (DMUs) according to theavailable data. This method is known as a non-parametric approach and it has been broadly exploited for the goal of specifying the locations of renewable energy facilities (see e.g., Azadeh et al. (2011),Azadeh et al. (2008)Yokota and Kumano (2013),Sueyoshi and Goto (2014),Babazadeh et al. (2015),Wu et al. (2016) and Babazadeh et al. (2016)). It is capable to conduct the complex nature of the relations between the multiple inputs and multiple outputs, whilst it does not need predetermined weights for the inputs and the output criteria. Furthermore, the normalizing of variable dimensions is unnecessary for the method in efficiency computation. Two significant early contributions in this issue are the works of Farrell (1957) and Charnes et al. (1978). Hitherto, many applications and extensions of DEA models have been proposed based on the model presented by Charnes et al. (1978) that takes into account constant return to scale. In the literature, this model is known as the CCR model. Thereinafter, Banker (1984) developed this model by considering variable returns to scale, which the resulted model is known as the BCC model. Recognizing the production frontier, i.e., where DMUs will be regarded as efficient, is primary concept behind these classic DEA models. Likewise, through comparing those DMUs, which are not on the frontier, with their peerson production frontier, the other scores are also attained. Noteworthy, it is deemed that all the DMUs, which are on the frontier, have the same performance level as well as highest score. As mentioned before, one of the importantcharacters of the DEA models is that they do not need predetermined weights. Indeed, the weights of the criteria are decision variables and their values are specified by maximizing the efficiency scores. Nonetheless, this full flexibility may much decline the discrimination power of DEA models. The relational behind this is that too many DMUs may existon the frontier, which leads to alleviatethe performance ranking of DMUs. Thus, many scholars have tried to propose different methods with the aim of enhancing discrimination power of DEA models. These methods can be categorized into four classes as follows:
(1) Applying prior or preferential information from pertaining decision makers (Allen et al., 1997; Paradi et al., 2004; Thanassoulis et al., 2004; Zhang et al., 2009)
(2) Utilizing cross efficiency method and evaluating each DMU through both itself and other peers(Doyle and Green, 1994; Sexton et al., 1986)
165
(3) Employing super efficiency method, in which the DMU under evaluation, itself is excluded from the reference set and its efficiency is estimated with a linear fit of all other units (Andersen and Petersen, 1993; Banker and Chang, 2006; Banker and Gifford, 1988)
(4) Comparing the DMUs with good and bad references simultaneously(Shen et al., 2016; Sueyoshi and Goto, 2011)
In this study, we implement the methods of fourth group to evaluate different areas for solar plants according to a set of social, geographical and technical criteria. Unlike the methods of other mentioned groups, the main merit of these methods is that they are not limited to a specific issue and can be utilized in many problems (Shen et al., 2016). Indeed, the proposed DEA model using the information of both efficient and anti-efficient frontiers increases the discrimination power in DEA analysis. The application and usefulness of the proposed approach are validated and verified in a real case study in Iran. Likewise, some interesting managerial implications are extracted based on numerical results.
The remainder of this paper is structured as follows. In the next Section, the proposed DEA model for assessing the solar plants is explained in details. Section 3 proposes the studied case and addresses the considered criteria. Section 4 discusses the computational results and insights and finally concluding remarks and possible future research avenues are presented in section 5.
2-The proposed DEA model
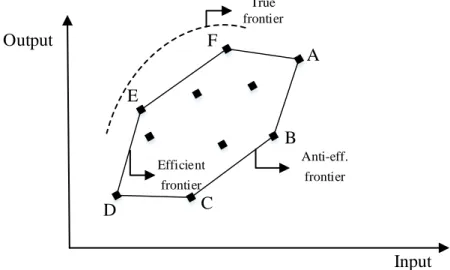
In this section, we introduce the implemented DEA model, first proposed by Shen et al. (2016), for the goal of performance ranking of DMUs. It is worthy to note that each solar plant is considered as a DMU. Utilizing the distances to both efficient and the anti-efficient frontiers, the proposed DEA model aims to improve distinction power in DEA analysis. Indeed, the proposed approach applies the standard DEA model, presented by Charnes et al. (1978), and the inverted DEA model, presented by Yamada et al. (1994), to respectively trace the efficient and the anti-efficient frontiers. Afterwards, the obtained information are integrated employing an indicator. Graphical illustrations of the efficient and anti-efficient frontiers are represented in figure 1. From this figure, the best practice DMUs F, E, D and A are obtained by the standard DEA model. As such, the worst practice DMUs D, C, B and A are proposed by the inverted DEA model.
B
C D
E
F
True frontier
Input Output
Efficient frontier
Anti-eff. frontier
A
Fig 1. Graphical illustrations of the efficient and anti-efficient frontiers
The implemented approach is addressed as follow. To do so, the following indices, parameters and variables in problem formulation are first introduced.
166
Indices
,
c l
Index of candidate locations for solar plant (DMUs) c l, =1,..., ,nd Index of inputs d =1,..., ,g e Index of outputs e=1,..., .q Parameters
dc
x
Amount of input dfor DMU c,ec
y
Amount of output efor DMU c.Variables
l
θ
The measure of efficiency of DMU l,c
λ
The dual weight assigned to all inputs and outputs of DMU “c”.The standard DEA model is given in model (1)-(4). As mentioned previously, this model traces the efficient frontier. In other words, the distances to good references are obtained by solving this model.
*
bl l
Min h
=
θ
(1)1
,
1,...,
n
dc c l dl c
x
λ θ
x
d
g
=
≤
=
∑
(2) 1,
1,...,
nec c el c
y
λ
y
e
q
=
≥
=
∑
(3) 0, 1,..., unconstrained. c l c nλ
θ
≥ = (4)In addition, the model (5)-(8) represents the inverted DEA model, which offers the distances to bad references.
* wl l
Max h
=
θ
(5)1
,
1,...,
n
dc c l dl c
x
λ θ
x
d
g
=
≥
=
∑
(6) 1,
1,...,
nec c el c
y
λ
y
e
q
=
≤
=
∑
(7)0,
1,...,
unconstrained.
c lc
n
λ
θ
≥
=
(8)By solving the standard DEA model and the inverted DEA model for the l th DMU, the efficiency scores
* *
,
bl wl
h h
are reached. Therefore, to obtain the efficiency scores for all DMUs, the models should be solvedn times.
For the goal of calculating the distances to the good and bad references simultaneously and integrating the information of both efficient and anti-efficient frontiers, an indicator is computed as follows:
167 * * * 1 (1 ) 2 bl wl l h h hi + −
= (9)
In the event that
DMU
l is only on the efficient frontier (e.g., DMUs E and F),hi
l*will be higher than 1 2 and also if it is only on the anti-efficient frontier (e.g., DMUs B and C),h
wl*=
1
and consequently* *
1
2
2
bl lh
hi
=
≤
. Furthermore, if it is on both the efficient and anti-efficient frontiers (e.g., DMUs A and D), i.e.,h
bl*=
1
andh
wl*=
1,
then *1
2
l
hi
=
.According to the presented descriptions, the approach can distinguish between the DMUs noting their positions on the frontiers.3- Case study description
The proposed DEA model is utilized to evaluate different places for solar plants in Iran, which is one of the world's supplies of fossil energy. There are many motivations to implement the solar PV energy in Iran. Excessive use of fossil energy in Iran has created many environmental problems. One of the most prominent of these problems is the pollution of big cities in Iran such as Tehran, Esfahan, Tabriz and Mashhad. Moreover, Iran is also very talented to the use of the PV systems since the average annual solar radiation is very high in Iran and there are vast unused lands, which the systems can be installed in them. Moreover, by exploiting new energies, the country can enhance its energy diversity. Iran's government and parliament have also passed approvals and laws to encourage investment in renewable energies.
We introduce a set of social, geographical and technical criteria in order to assess different locations for solar plants. Locations with higher scores are more appropriate for establishing solar plants. It is worth noting that the criteria with increasing trend is considered as output critera and those with decreasing trend are implemented as input criteria. The considered criteria is explained in details as follows.
• Distance of power distribution network
This criterion has a great impact on the amount of electrical pressure drop. In other words, if the distance between solar plant and grid is high, the pressure drop increases dramatically. Thus, less distance is more favorable and therefore it is as an input criterion.
• Natural disasters occurrence
By this viewpoint, security of solar plant is taken into account. In fact, the combination of earthquake and torrent, as two important disasters, are defined as an input criterion.
• Population density
Higher value of this criterion is more plus because the locations with more population, have a more electricity demand. As a result, this criterion has an increasing trend and it is regarded as an output indicator.
• Topography feature
This matter considers characters and shape of the surface of the Earth. Specially, choosing rough and rocky lands for establishing solar plants is unreasonable or even inconceivable. This factor can play an important role to select solar plants and has as increasing trend. Hence, it is an output criterion.
• Beam radiation
This criterion is defined as a proportion of solar radiation that is reached on the earth's surface. Assuredly, the locations with more annual radiation can yield more electrical energy. Consequently, this criterion is taken into account as an output indicator.
168
3-1- Data gathering
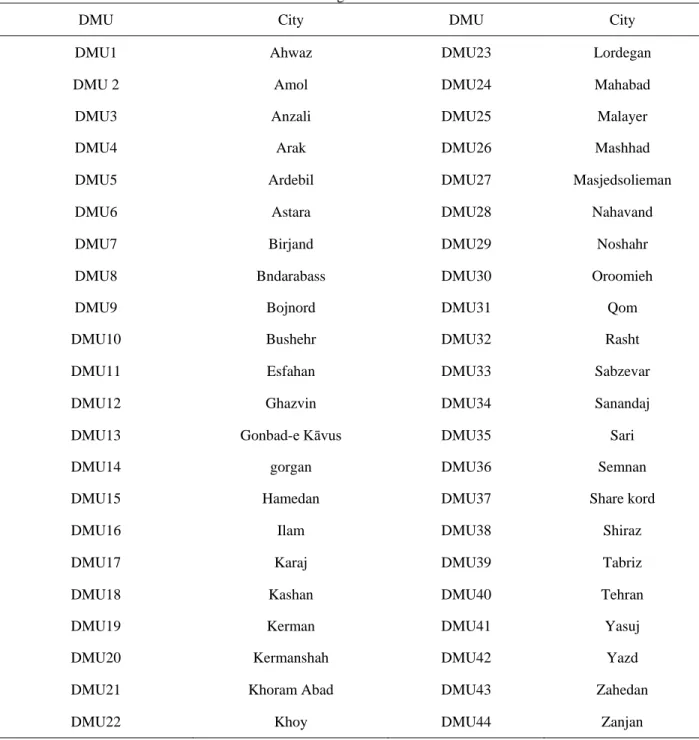
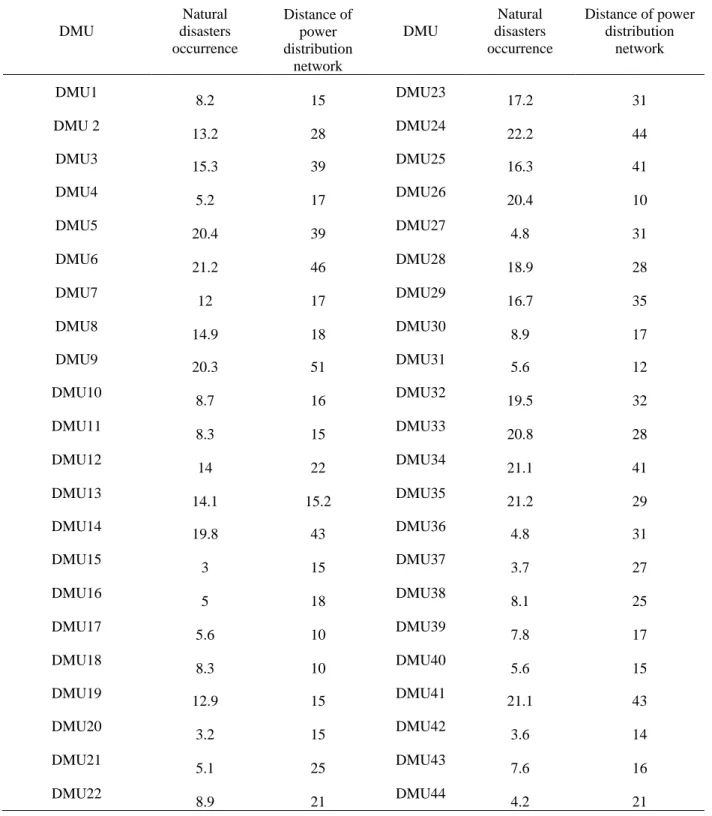
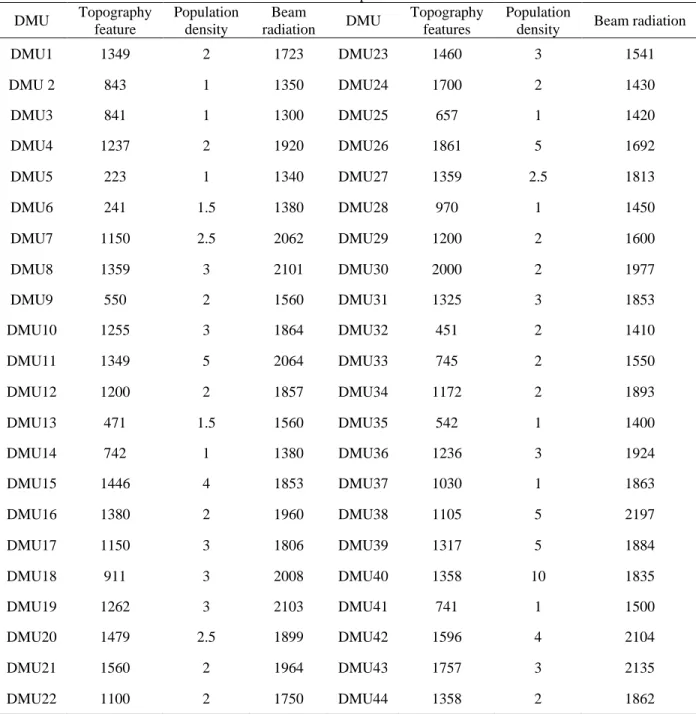
Gathering and estimating of parameter values have been done based on available historical data. Different locations, which are considered for solar plant centers, are given in table 1. Responsible organizations for input criteria of the proposed DEA model encompassing “natural disasters occurrence” and “distance of power distribution network” arerepectivelyDisaster Management Organization (http://www.ndmo.ir) and Iran Grid Management Company (http://www.igmc.ir). Table 2 represents the collected data corresponding to input criteria for all DMUs. As such, the values of output criteria, i.e., “topography feature”, “population density” and “beam radiation” have been provided from Geological Survey of Iran (http://www.gsi.ir), National Statistical Center of Iran (http://www.amar.org.ir), and Renewable Energy Organization of Iran (http://www.suna.org.ir), respectively. The values of output criteria for DMUs are presented in table 3.
Table 1. Introducing the considered DMUs
DMU City DMU City
DMU1 Ahwaz DMU23 Lordegan
DMU 2 Amol DMU24 Mahabad
DMU3 Anzali DMU25 Malayer
DMU4 Arak DMU26 Mashhad
DMU5 Ardebil DMU27 Masjedsolieman
DMU6 Astara DMU28 Nahavand
DMU7 Birjand DMU29 Noshahr
DMU8 Bndarabass DMU30 Oroomieh
DMU9 Bojnord DMU31 Qom
DMU10 Bushehr DMU32 Rasht
DMU11 Esfahan DMU33 Sabzevar
DMU12 Ghazvin DMU34 Sanandaj
DMU13 Gonbad-e Kāvus DMU35 Sari
DMU14 gorgan DMU36 Semnan
DMU15 Hamedan DMU37 Share kord
DMU16 Ilam DMU38 Shiraz
DMU17 Karaj DMU39 Tabriz
DMU18 Kashan DMU40 Tehran
DMU19 Kerman DMU41 Yasuj
DMU20 Kermanshah DMU42 Yazd
DMU21 Khoram Abad DMU43 Zahedan
169
Table 2. Values of input criteria for DMUs
DMU
Natural disasters occurrence
Distance of power distribution
network
DMU
Natural disasters occurrence
Distance of power distribution
network DMU1
8.2 15 DMU23 17.2 31
DMU 2
13.2 28 DMU24 22.2 44
DMU3
15.3 39 DMU25 16.3 41
DMU4
5.2 17 DMU26 20.4 10
DMU5
20.4 39 DMU27 4.8 31
DMU6
21.2 46 DMU28 18.9 28
DMU7
12 17 DMU29 16.7 35
DMU8
14.9 18 DMU30 8.9 17
DMU9 20.3 51 DMU31 5.6 12
DMU10
8.7 16 DMU32 19.5 32
DMU11
8.3 15 DMU33 20.8 28
DMU12
14 22 DMU34 21.1 41
DMU13
14.1 15.2 DMU35 21.2 29
DMU14 19.8 43 DMU36 4.8 31
DMU15
3 15 DMU37 3.7 27
DMU16
5 18 DMU38 8.1 25
DMU17
5.6 10 DMU39 7.8 17
DMU18
8.3 10 DMU40 5.6 15
DMU19 12.9 15 DMU41 21.1 43
DMU20
3.2 15 DMU42 3.6 14
DMU21
5.1 25 DMU43 7.6 16
DMU22
170
Table 3.The values of output criteria for DMUs DMU Topography
feature
Population density
Beam
radiation DMU
Topography features
Population
density Beam radiation
DMU1 1349 2 1723 DMU23 1460 3 1541
DMU 2 843 1 1350 DMU24 1700 2 1430
DMU3 841 1 1300 DMU25 657 1 1420
DMU4 1237 2 1920 DMU26 1861 5 1692
DMU5 223 1 1340 DMU27 1359 2.5 1813
DMU6 241 1.5 1380 DMU28 970 1 1450
DMU7 1150 2.5 2062 DMU29 1200 2 1600
DMU8 1359 3 2101 DMU30 2000 2 1977
DMU9 550 2 1560 DMU31 1325 3 1853
DMU10 1255 3 1864 DMU32 451 2 1410
DMU11 1349 5 2064 DMU33 745 2 1550
DMU12 1200 2 1857 DMU34 1172 2 1893
DMU13 471 1.5 1560 DMU35 542 1 1400
DMU14 742 1 1380 DMU36 1236 3 1924
DMU15 1446 4 1853 DMU37 1030 1 1863
DMU16 1380 2 1960 DMU38 1105 5 2197
DMU17 1150 3 1806 DMU39 1317 5 1884
DMU18 911 3 2008 DMU40 1358 10 1835
DMU19 1262 3 2103 DMU41 741 1 1500
DMU20 1479 2.5 1899 DMU42 1596 4 2104
DMU21 1560 2 1964 DMU43 1757 3 2135
DMU22 1100 2 1750 DMU44 1358 2 1862
4-Results and discussions
The proposed algorithm for the purpose of obtaining corresponding scores, i.e., efficiency and anti-efficiency scores, is coded in General Algebraic Modeling System ®
(GAMS ) software and the CPLEX solver is employed to solve the models. The overall procedure of the implemented algorithm is explained in figure 2. As it can be seen from figure 2, for all DMUs, the standard and the inverted DEA models are solved. Afterward, the proposed indicators are computed and pertaining ranking for each DMU is determined. In addition, all the empirical experiments are performed by a Pentium five-core 2.53 GHz computer with 4 GB RAM.
171
(
x
dc:d =1,..., ,g c=1,..., ;ny
ec:c=1,...,n)
Input
For l=1 to 𝑛𝑛𝑛𝑛𝑛𝑛𝑛𝑛𝑛𝑛𝑛𝑛𝑜𝑜𝑜𝑜𝐷𝐷𝐷𝐷𝐷𝐷𝐷𝐷{
Solve the standard DEA model for DMU l; ;
* bl
h
Obtain the amount of
Solve the inverted DEA model for DMU l; ;
* wl
h
Obtain the amount of
* l
hi
the indicator Calculate
}
Rank DMUs according to the obtained indicators;
Fig 2. Pseudo code of the implemented algorithm
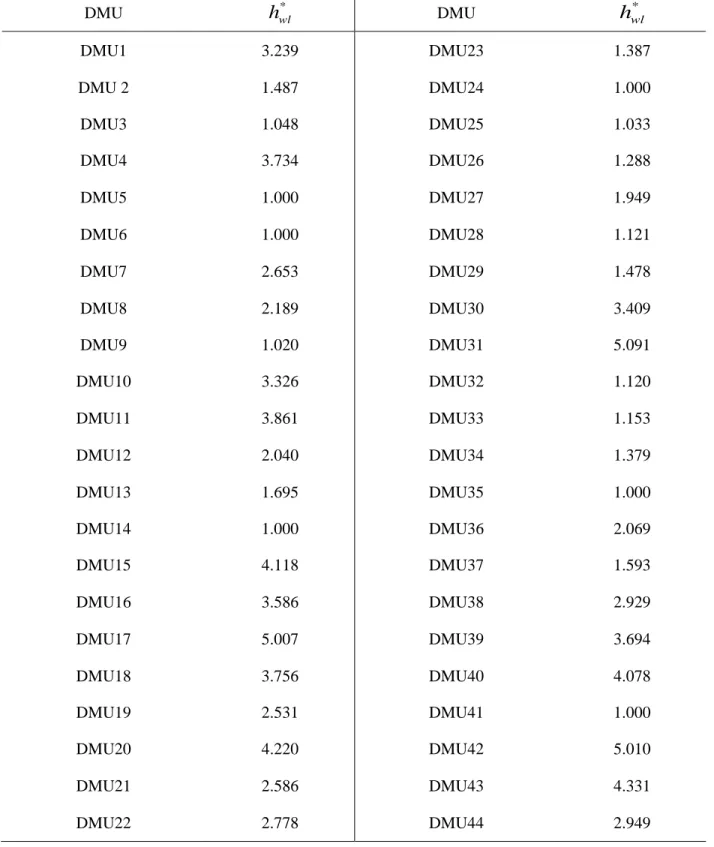
The obtained efficiency scores and ranks of DMUs, acquired by standard DEA model, are illustrated in table 4. What is seen from this table is that some of DMUs have a same score and we cannot discriminate between them. For example, DMU#15(i.e., Hamedan), DMU#17(i.e., Karaj), DMU#26 (i.e., Mashhad), DMU#40 (i.e., Tehran) and DMU#42 (i.e., Yazd) obtain the same score equal to 1, which ranking between them is impossible. To increase discrimination power of the standard DEA model, the information of anti-efficient frontier is also determined. Table 5 represents the anti-anti-efficient scores acquired by the inverted DEA model. Now, in order aggregate the information of both efficient and anti-efficient frontiers, the indictor proposed in equation 9 is calculated for the all DMUs. The obtained scores and ranks of DMUs are reported in table 6.
172
Table 4. Scores and rankings of DMUs obtained through the standard DEA model
DMU
h
bl* Rank DMUh
bl* RankDMU1 0.727 15 DMU23 0.374 29
DMU 2 0.281 34 DMU24 0.312 30
DMU3 0.203 39 DMU25 0.211 38
DMU4 0.728 14 DMU26 1.000 1
DMU5 0.194 41 DMU27 0.612 24
DMU6 0.176 44 DMU28 0.288 31
DMU7 0.641 21 DMU29 0.286 32
DMU8 0.635 23 DMU30 0.943 8
DMU9 0.186 43 DMU31 0.939 9
DMU10 0.670 19 DMU32 0.239 37
DMU11 0.829 11 DMU33 0.285 33
DMU12 0.466 28 DMU34 0.262 35
DMU13 0.511 26 DMU35 0.250 36
DMU14 0.188 42 DMU36 0.649 20
DMU15 1.000 1 DMU37 0.815 12
DMU16 0.715 17 DMU38 0.581 25
DMU17 1.000 1 DMU39 0.713 18
DMU18 1.000 1 DMU40 1.000 1
DMU19 0.745 13 DMU41 0.201 40
DMU20 0.981 7 DMU42 1.000 1
DMU21 0.639 22 DMU43 0.894 10
173
Table 5. The scores of DMUs obtained through the inverted DEA model
DMU
h
wl* DMUh
wl*DMU1 3.239 DMU23 1.387
DMU 2 1.487 DMU24 1.000
DMU3 1.048 DMU25 1.033
DMU4 3.734 DMU26 1.288
DMU5 1.000 DMU27 1.949
DMU6 1.000 DMU28 1.121
DMU7 2.653 DMU29 1.478
DMU8 2.189 DMU30 3.409
DMU9 1.020 DMU31 5.091
DMU10 3.326 DMU32 1.120
DMU11 3.861 DMU33 1.153
DMU12 2.040 DMU34 1.379
DMU13 1.695 DMU35 1.000
DMU14 1.000 DMU36 2.069
DMU15 4.118 DMU37 1.593
DMU16 3.586 DMU38 2.929
DMU17 5.007 DMU39 3.694
DMU18 3.756 DMU40 4.078
DMU19 2.531 DMU41 1.000
DMU20 4.220 DMU42 5.010
DMU21 2.586 DMU43 4.331
174
Table 6. The scores and rankings of DMUs obtained through the proposed DEA model
DMU
hi
l* Rank DMUhi
l* RankDMU1 0.709 14 DMU23 0.327 29
DMU 2 0.304 31 DMU24 0.156 36
DMU3 0.124 38 DMU25 0.121 39
DMU4 0.730 11 DMU26 0.612 21
DMU5 0.097 42 DMU27 0.549 26
DMU6 0.088 44 DMU28 0.198 34
DMU7 0.632 18 DMU29 0.305 30
DMU8 0.589 23 DMU30 0.825 9
DMU9 0.103 40 DMU31 0.871 6
DMU10 0.685 16 DMU32 0.173 35
DMU11 0.785 10 DMU33 0.209 33
DMU12 0.488 27 DMU34 0.268 32
DMU13 0.461 28 DMU35 0.125 37
DMU14 0.094 43 DMU36 0.583 24
DMU15 0.879 3 DMU37 0.594 22
DMU16 0.718 13 DMU38 0.620 20
DMU17 0.900 2 DMU39 0.721 12
DMU18 0.867 7 DMU40 0.877 4
DMU19 0.675 17 DMU41 0.101 41
DMU20 0.872 5 DMU42 0.900 1
DMU21 0.626 19 DMU43 0.832 8
DMU22 0.570 25 DMU44 0.689 15
To validate and verify the obtained rankings by the proposed DEA model, a nonparametric measure namely Spearman’s rank correlation method (Sheskin, 2003) is adopted.This method evaluates the positive correlation between the proposed sets of ranks, i.e., reached by the standard DEA model and the proposed DEA modelby applying the following measure:
175
(
2)
6 1
i id n n
ρ
=−
∑
(10) Note that𝑑𝑑𝑖𝑖 represents difference between ranks of the mentioned procedures for DMU i, and n denotes the total number of DMUs. In this regard, we test the null hypothesis H0 in contrast to the alternative
hypothesis H1 as follows:
H0: Correlation between the ranks obtained by the proposed DEA
model and the standard DEA model does not exist.
H1: A positive correlation between the ranks obtained by the
proposed DEA model and the standard DEA model exists.
For this experiment, the confidence level (i.e.,1− 𝛼𝛼) is considered 0.95. The Spearman’s rank correlation coefficient and pertaining P-value are respectively obtained0.946 and 0.000. Since P-value is smaller than the value of 𝛼𝛼 (i.e., 0.05), then the null hypothesis H0 is rejected and therefore it can be implied that a strong
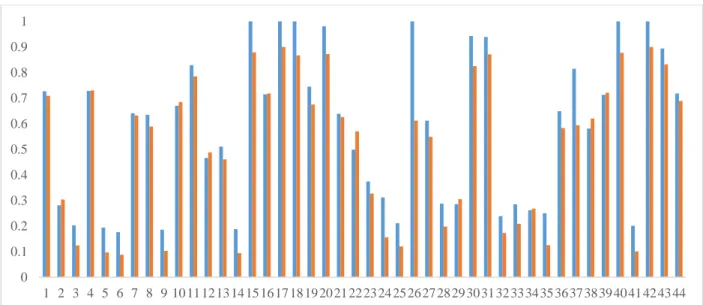
relationship between the ranks reached by the standard DEA model and the proposed DEA model exists. Overall, it can be concluded that the ranks reached by the proposed DEA model are compatible with the ones in the standard DEA model. That is, the obtained results by the proposed DEA model are verified. As such, figure 3 compares the scores acquired by the standard DEA model and the scores acquired by the proposed DEA model. It is clear that the proposed DEA model increases the difference between DMUs and consequently rankings between the DMUs are easily carried out. In other words, this highlights the validation of the results obtained by the proposed DEA model.
Fig 3. Comparison between the scores reached by the proposed DEA model and the standard DEA model
4-1- Sensitivity analysis
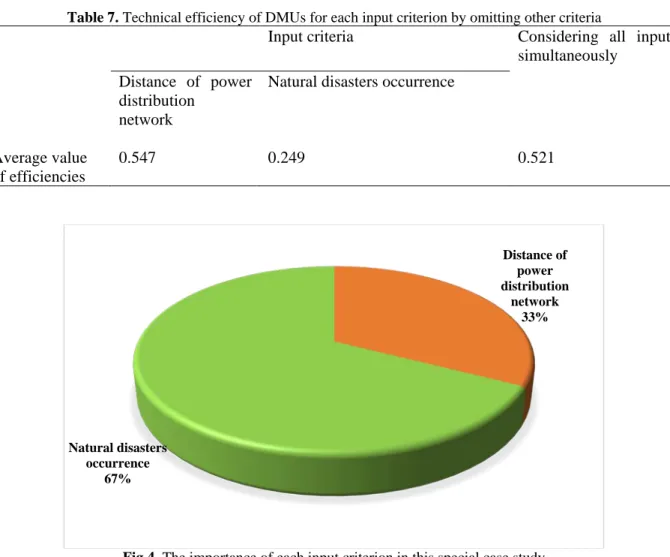
In this section, we aim to recognize the influential criteria on efficiency of DMUs using sensitivity analysis to help decision makers for the goal proposing appropriate strategies in decision-makings. To do this, the implemented algorithm explained in figure 2 is run 2 and 3 times to identify the influences of the input and output criteria, respectively. In other words, for studying the impact of each criterion, other criteria that are in a same class, i.e., input or output class, with considered criterion are omitted. For input criteria, the results obtained from this experiment is summarized in table 7. Additionally, the percentage of change in the efficiency scores, which is caused by omitting other criterion are represented in figure 4. The result
0 0.1 0.2 0.3 0.4 0.5 0.6 0.7 0.8 0.9 1
176
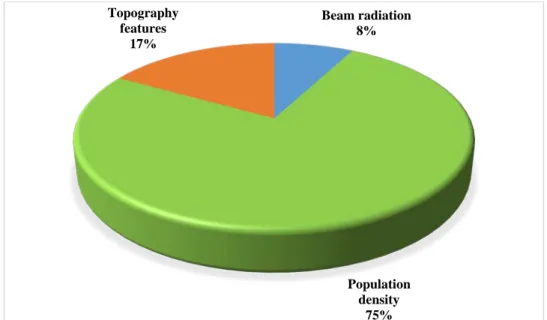
shows that “natural disasters occurrence” are more effective than “distance of power distribution network”. It means that mangers and policymakers by selecting the safe and secure places for solar plants can improve efficiency of selected locations significantly. In conjunction of the output criteria, table 8 shows the related efficiency to each criterion by omitting other output criteria. Figure 5 also illustrates the importance of output criteria. What is evident from these results is that the most important output criterion is “population density”. Thus, by choosing location with higher “population density”, most return can be achieved.
Table 7. Technical efficiency of DMUs for each input criterion by omitting other criteria
Input criteria Considering all inputs
simultaneously Distance of power
distribution network
Natural disasters occurrence
Average value of efficiencies
0.547 0.249 0.521
Fig 4. The importance of each input criterion in this special case study
Table 8. Technical efficiency of DMUs for each output criterion by omitting other criteria
Output criteria Considering all outputs
simultaneously Beam radiation Population
density
Topography features Average
value of efficiencies
0.547 0.249 0.507 0.521
Distance of power distribution
network 33%
Natural disasters occurrence
177
Fig 5. The importance of each output criterion in this special case study
5- Conclusion
Economic motivations, environmental concerns as well as energy security are major triggers for the development of renewable energy resources. Among the renewable energy resources, the solar PV energy has attracted many interests because it is potentially largest source of energy in the world and capable to mitigate GHG emissions significantly. Since the high costs of PV in contrast to other electricity generation alternatives, the solar PV energy has not still attained sufficient maturity. In order to bestead the commercialization of solar PV industry, great efforts must be performed for alleviating manufacturing costs and rising the efficiency. In this regard, this paper applies a DEA model to assess different sites for solar plants according to a set of social, geographical and technical criteria. Places that earn higher efficiency scores are more appropriate for establishing solar plants. The proposed DEA model is able to exploit simultaneously information of the efficient and anti-efficient frontiers. The matter contributes to rise the discrimination power in DEA analysis.
The application and usefulness of the proposed approach are studied in a real case study in Iran and some interesting insights are extracted. Specially, we showed (1) strong relationship between the ranks reached by standard DEA model and the proposed approach in this paper exists; (2) the proposed approach increases the difference between DMUs and consequently rankings between them are easily carried out; (3)“natural disasters occurrence” and “population density” are the most influential criteria among the input and output criteria, respectively.
Many extensions on the current paper could be pointed for future research. Proposing a multi-layer projection and applying geographic information system principles to specify the most appropriate areas for solar plants can be suggested as an interesting direction for future research. Likewise, the proposed DEA model can be developed under uncertainty of indicators.
References
Allen, R., Athanassopoulos, A., Dyson, R. G., and Thanassoulis, E. (1997). Weights restrictions and value judgements in data envelopment analysis: evolution, development and future directions. Annals of
Operations Research 73, 13-34.
Andersen, P., and Petersen, N. C. (1993). A procedure for ranking efficient units in data envelopment analysis. Management science 39, 1261-1264.
Beam radiation 8%
Population density
75% Topography
features 17%
178
Azadeh, A., Ghaderi, S., and Maghsoudi, A. (2008). Location optimization of solar plants by an integrated hierarchical DEA PCA approach. Energy Policy 36, 3993-4004.
Azadeh, A., Sheikhalishahi, M., and Asadzadeh, S. (2011). A flexible neural network-fuzzy data
envelopment analysis approach for location optimization of solar plants with uncertainty and complexity.
Renewable energy 36, 3394-3401.
Babazadeh, R., Razmi, J., and Pishvaee, M. S. (2016). Sustainable cultivation location optimization of the Jatropha curcas L. under uncertainty: A unified fuzzy data envelopment analysis approach. Measurement
89, 252-260.
Babazadeh, R., Razmi, J., Rabbani, M., and Pishvaee, M. S. (2015). An integrated data envelopment analysis–mathematical programming approach to strategic biodiesel supply chain network design problem. Journal of Cleaner Production.
Banker, R. D. (1984). Estimating most productive scale size using data envelopment analysis. European Journal of Operational Research 17, 35-44.
Banker, R. D., and Chang, H. (2006). The super-efficiency procedure for outlier identification, not for ranking efficient units. European Journal of Operational Research 175, 1311-1320.
Banker, R. D., and Gifford, J. L. (1988). A relative efficiency model for the evaluation of public health nurse productivity. Mellon University Mimeo, Carnegie
Bazilian, M., Onyeji, I., Liebreich, M., MacGill, I., Chase, J., Shah, J., Gielen, D., Arent, D., Landfear, D., and Zhengrong, S. (2013). Re-considering the economics of photovoltaic power. Renewable Energy
53, 329-338.
Charnes, A., Cooper, W. W., and Rhodes, E. (1978). Measuring the efficiency of decision making units.
European journal of operational research 2, 429-444.
Chen, C.-R., Huang, C.-C., and Tsuei, H.-J. (2014). A hybrid MCDM model for improving GIS-based solar farms site selection. International Journal of Photoenergy 2014.
Desideri, U., Proietti, S., Zepparelli, F., Sdringola, P., and Bini, S. (2012). Life Cycle Assessment of a ground-mounted 1778kW p photovoltaic plant and comparison with traditional energy production systems. Applied Energy 97, 930-943.
Doyle, J., and Green, R. (1994). Efficiency and cross-efficiency in DEA: Derivations, meanings and uses.
Journal of the operational research society 45, 567-578.
Farrell, M. J. (1957). The measurement of productive efficiency. Journal of the Royal Statistical Society. Series A (General) 120, 253-290.
Jun, D., Tian-tian, F., Yi-sheng, Y., and Yu, M. (2014). Macro-site selection of wind/solar hybrid power station based on ELECTRE-II. Renewable and Sustainable Energy Reviews 35, 194-204.
Kengpol, A., Rontlaong, P., and Tuominen, M. (2013). A decision support system for selection of solar power plant locations by applying fuzzy AHP and topsis: An empirical study.
179
Paradi, J. C., Asmild, M., and Simak, P. C. (2004). Using DEA and worst practice DEA in credit risk evaluation. Journal of Productivity Analysis 21, 153-165.
Sabo, M. L., Mariun, N., Hizam, H., Radzi, M. A. M., and Zakaria, A. (2016). Spatial energy predictions from large-scale photovoltaic power plants located in optimal sites and connected to a smart grid in Peninsular Malaysia. Renewable and Sustainable Energy Reviews 66, 79-94.
Sánchez-Lozano, J., García-Cascales, M., and Lamata, M. (2016). Comparative TOPSIS-ELECTRE TRI methods for optimal sites for photovoltaic solar farms. Case study in Spain. Journal of Cleaner
Production 127, 387-398.
Sexton, T. R., Silkman, R. H., and Hogan, A. J. (1986). Data envelopment analysis: Critique and extensions. New Directions for Program Evaluation 1986, 73-105.
Shen, W.-f., Zhang, D.-q., Liu, W.-b., and Yang, G.-l. (2016). Increasing discrimination of DEA evaluation by utilizing distances to anti-efficient DEA frontiers. Computers & Operations Research 75, 163-173.
Sheskin, D. J. (2003). "Handbook of parametric and nonparametric statistical procedures," crc Press. Sueyoshi, T., and Goto, M. (2011). Measurement of Returns to Scale and Damages to Scale for DEA-based operational and environmental assessment: How to manage desirable (good) and undesirable (bad) outputs? European Journal of Operational Research 211, 76-89.
Sueyoshi, T., and Goto, M. (2014). Photovoltaic power stations in Germany and the United States: A comparative study by data envelopment analysis. Energy Economics 42, 271-288.
Thanassoulis, E., Portela, M. C., and Allen, R. (2004). Incorporating value judgments in DEA. In
"Handbook on data envelopment analysis", pp. 99-138. Springer.
Wu, Y., Hu, Y., Xiao, X., and Mao, C. (2016). Efficiency assessment of wind farms in China using two-stage data envelopment analysis. Energy Conversion and Management 123, 46-55.
Yamada, Y., Matsui, T., and Sugiyama, M. (1994). An inefficiency measurement method for management systems. Journal of Operations Research Society of Japan 37, 158-168.
Yokota, S., and Kumano, T. (2013). Mega‐solar optimal allocation using data envelopment analysis.
Electrical Engineering in Japan 183, 24-32.
Zhang, D., Li, X., Meng, W., and Liu, W. (2009). Measuring the performance of nations at the Olympic Games using DEA models with different preferences. Journal of the Operational Research Society 60, 983-990.