Mathematical model for P-hub location problem under
simultaneous disruption
Emad Roghanian
1*, Mohadese Haghdoost
1Iran , Tehran Toosi University of Technology, K.N.
, Engineering Department of Industrial
1
[email protected], [email protected]
Abstract
The optimal locating of facilities has large effects on economic benefits, providing satisfactory service and levels of customer satisfaction. One of the new topics discussed in location problems is hub location and hub facilities are subject to unpredictable disruptions. This paper proposes a nonlinear integer model for reliable single allocation hub location problem that considers backup hub, alternative routes, and also uses fortification approach to improve the network reliability. Due to the NP hard nature of the model, we use genetic algorithm in order to solve the defined problem and the numerical results illustrate the applicability of the proposed model as well as the efficiency of solution procedure.
Keywords: P-median hub, disruption, fortification, backup hub, alternative route, genetic algorithm
1-Introduction
Facility location is a strategic decision that remains without change for a long time and many of the tactical and operational decisions, such as vehicle routing decisions and inventory control, are influenced directly by decisions regarding the location of facilities (Zarandi et al 2012). One of the new issues that has been proposed on location problems is hub location problem. Hub nodes can be named as special facilities designed that act as intermediary stations in the distribution system. In hub nodes flow is collected, classified and distributed, simultaneously. So that the flow/commodity would be collected from all the spokes allocated to the hub and those with the same destination would be sent after combining. In this way, operators can use the advantage of economies of scale. Hub location is widely used in transportation, telecommunications, postal delivery and cargo delivery. Traditionally, hub location problem tries to determine the location of hubs and allocate spokes to the located hubs and it is assumed that hubs are always available. Whereas, they may disrupt and stop operating because of various reasons such as natural disasters, inclement weather, equipment malfunctioning, labor strikes and intentional attacks. Disruption may cause higher transportation cost, delay in delivery, inventory shortages, loss of market shares, and so on (Peng et al 2011). So decision makers have to consider 42Tthe
disruptions42T42Tin network design.
One of the strategies to reduce the risk of disruption is facility fortification. Facility fortification is a particular type of facility protection to protect facilities from failure. The actions needed for facility fortification can be hiring extra workforce, storage of backup inventory and, etc. Another strategy that can reduce the risk of disruption is considering backup hub and alternative routes. In this way, when disruption occurred, the spokes assigned to the disrupted hubs have to reassign to non-disrupted hubs and flow goes from alternative route.
To the best of our knowledge there is no paper considering fortification strategy, backup hub and alternative routes simultaneously in hub location problem.
*Corresponding author
ISSN: 1735-8272, Copyright c 2019 JISE. All rights reserved Journal of Industrial and Systems Engineering
Vol. 12, No. 1, pp. 83-94 Winter (January) 2019
In this paper for the first time fortification strategy, backup hub and alternative routes are considered simultaneously in hub location problem and also repair costs of disrupted hub are considered in the objective function.
The presented mathematical model determines the location of hubs and hubs which must be protected, allocates spokes to the located hubs and also tries to determine backup hub and alternative routes so that both the cost of normal situation and disorder terms are minimized.
The remainder of the paper is organized as follows; in section 2 a literature review of reliable location problem is presented. In section 3, the definition of problem and presenting nonlinear mathematical model are discussed. In Section 4, the solution approach is described. In section 5, computation results are presented. In section 6, sensitivity analysis are performed. Finally, in Section 7 conclusions and future research are presented.
2-Literature review
The first paper that considered disruption in facility location problem, is Drezner's paper (Drezner 1987). He extended median and center location problem by considering the possibility of inactivating one or more facility. He also proposed a heuristic method to solve these two problems. Snyder and Daskin ( 2005) proposed reliable model for p-median and uncapacitated fixed charge problem. They considered r-level backup for facility and provided a Lagrangian relaxation algorithm in order to solve the problem. cui et al (2010) proposed a reliable mixed integer formulation for uncapacitated fixed charge problem so as to minimize fixed initial setup costs and transportation cost in normal and failure situation. Peng et al (2011) provided a mixed integer programming model for designing reliable supply chain. Liberatore et al (2012) studied inventory systems subject to correlated disruption in which disruption may results partial or complete damage of facilities. They examined the problem of optimally protecting of a capacitated median system with a limited amount of protective resource. Losada et al (2012) proposed a bi-level mixed integer linear programming for fortifying facility network. Li et al (2013) proposed nonlinear integer programming model for median and uncapacitated fixed charge location problem under correlated disruption. They considered one backup and limited fortification budget in their model. Medal et al (2014) presented a mathematical model that determines the location of a set of facility and the number of facilities to be protected. They solved the problem by a binary search algorithm and obtained a lower bound. Asl-najafi et al (2015) studied reliable dynamic closed loop location-inventory problem and proposed a hybrid metaheuristic algorithm to solve the problem. Jalali et al (2016) studied reliable bi-objective location problem with multiple capacity. In their defined problem, supply chain has three echelons and there is constraint on coverage level. Zhang et al (2016) presented a mathematical model for a three-tiered supply chain under correlated disruption. In addition, they provided a heuristic solution approach based on Lagrangian relaxation to solve the problem. In area of hub location, Kim and O,Kelly (2009) for the first time studied reliable hub location problem. They presented a bi-objective model considering reliability and dispersion simultaneously. Zarandi et al (2012) examined multiple allocation hub covering problem by considering backup coverage and mandatory dispersion. Parvaresh et al (2013) presented a bi-level game model for p-hub median problem where hub subjected to Intentional disruption. In their model, the leader aims at identifying the location of hubs in order to minimize normal and worst-case transportation cost. Follower’s objective is to identify the hubs that if it is lost, it will mostly increase the transportation cost. Mohammadi et al (2013) presented a multi-objective model for hub covering problem under uncertainty and unreliability. They considered travel time between each pair of nodes as independent normal random variables and disruption leading to increase travel time. Parvaresh et al (2014) discussed multiple allocation hub median location problem under intentional disruption. They suggested two multi-objective metaheuristics based on simulated annealing and tabu search to solve the problem. Eghbali et al (2014) studied single allocation hub covering problem. They considered reliability for hubs and routes in their model and guaranteed the reliability of routes wouldn't be less than a specified value. Sadeghi et al (2015) Examined reliable single allocation hub covering problem. The objective of their model was minimizing establishment costs and transportation cost. In addition, they introduced descent algorithm to produce near optimal solution. An et al (2015) proposed a nonlinear mixed integer model for designing a reliable hub network and developed Lagrangian relaxation and Branch-and-Bound methods to solve the problem. Bashiri and Rezanezhad (2015)
performed a reliable multi -objective model for hub covering problem. They also provided ε-constraint algorithm for small size instances and
NSGA-II to obtain Pareto solutions. Azizi et al (2016) performed a bi-level mixed integer model for single allocation hub median problem. In their model, the probability of failure is heterogeneous and only one hub will disrupt at any given time. They presented an efficient crossover operator to genetic algorithm. Mohammadi et al (2016a) studied single allocation p-median and p-center hub location under uncertainty in flows, costs, times and hub operations. They performed a bi- objective nonlinear mixed integer programming and a fuzzy queuing approach was used to model the uncertainties in the network. Mohammadi et al (2016b) studied reliable logistic networks design through hub location problem and introduced new mathematical model for it. They consider complete and partial disruptions in hubs. In partial disruption, the service rate or the capacity of the hub degraded to a lower level. Mohammadi et al (2017) provided a reliable mathematical model in order to design hazardous materials transportation through hub location problem and introduced efficient lower bound approach to produce near-optimal solutions.
3-Problem description and formulation
In this section, we present the formulation of reliable single allocation hub location problem.
3-1-notifications
In a single allocation problem, each non-hub node is allocated to only one hub and all the inbound and outbound flows of this node are routed through that hub. Let N={1,2, . . N} be a set of nodes and H= {1,2,…,N+1} be a set of candidate hub locations. We assume H set and N set are the same and the only difference between them is the node N + 1 that is a dummy non–failable hub. r= {1,2} is set of allocation level. Node i∈ 𝑁𝑁 has a probability of disruption equal to qiϵ[0,1], the probability of failure is independent and heterogeneous. As pointed by (Peng et al 2011), the probability of more than two unrelated facilities to be disrupted at the same time is very small in reality. Therefore, we assume that one or two facilities may be disrupted at any given time. Fixed cost of locating a hub equal to 𝑓𝑓𝑘𝑘 and each node has capacity constraint equal to 𝐶𝐶𝐶𝐶i. The number of hubs to be opened is p and a path from origin (i) to destination (j) can be represented by a 4- tuple (i, k, m, j) where k represents the first hub and m represents the second hub. Unit transportation cost between a pair of nodes i and j and the traffic volume between them are 𝑐𝑐𝑖𝑖𝑖𝑖 and 𝑤𝑤𝑖𝑖𝑖𝑖, respectively. Discount factor of economy of scale 0 <α< 1 is applied to the inter-hub links and the cost of transporting one unit flow is calculated by below formula:
F
ikmj=c
ik+
𝛼𝛼
Rc
km+c
mj(1)
Decision variables contain, Y hub location and allocation variable, X route variable, U and V backup hub variables and Z hub fortification variable.
if node i is assigned to hub k 𝑌𝑌𝑖𝑖𝑘𝑘 =
⎩ ⎪ ⎨ ⎪ ⎧1
0 Otherwise
if flow from i to j passes through hub k and m 𝑋𝑋𝑖𝑖𝑘𝑘𝑖𝑖𝑖𝑖=
⎩ ⎪ ⎨ ⎪ ⎧1
0 Otherwise
hub n is the backup hub for the first hub in the route of i-j flow in level r
Otherwise
𝑈𝑈𝑖𝑖𝑖𝑖𝑖𝑖𝑖𝑖 = ⎩ ⎪ ⎨ ⎪ ⎧1
0
hub n is the backup hub for the second hub in the route of i-j flow in level r 𝐶𝐶𝑖𝑖𝑖𝑖𝑖𝑖𝑖𝑖 =
⎩ ⎪ ⎨ ⎪ ⎧1
0
Otherwise
If hub k is fortified
𝑍𝑍𝑘𝑘 = ⎩ ⎪ ⎨ ⎪ ⎧1
0
Otherwise
3-2-Mathematical model
In this paper spokes are allocated to hubs in different levels. This means that, each spoke is allocated to a hub, as a primary assignment, then the spoke at the first and second level is allocated to backup hubs. When primary assignment of a spoke is a fortified hub, it doesn't need a backup hub and when first backup of a spoke is a dummy non–failable or a fortified hub, it doesn't need the second backup hub.
As mentioned earlier in our model a limited budget, B, is considered to fortify hubs .This fortification includes the variable cost, eiand setup cost, si.. Setup cost is a fixed cost needed for hub
fortification. Such as the cost of research and development, personnel training and etc. Variable fortification cost varies with the amount of reliability improvements. Examples include the cost of acquiring and installing a unit of protective measures, the cost of storage and backup inventory, the cost of hiring extra workforce (Li et al 2013). We assume that if a facility is fortified, it becomes non-failable.
The proposed model is defined as following.
Objective functions:
Min∑𝑁𝑁𝑘𝑘=1𝑓𝑓𝑘𝑘𝑌𝑌𝑘𝑘𝑘𝑘+∑ ∑ ∑ ∑𝑁𝑁𝑖𝑖=1𝐹𝐹𝑖𝑖𝑘𝑘𝑖𝑖𝑖𝑖𝑤𝑤𝑖𝑖𝑖𝑖𝑋𝑋𝑖𝑖𝑘𝑘𝑖𝑖𝑖𝑖(1− 𝑞𝑞𝑘𝑘(1− 𝑍𝑍𝑘𝑘)
𝑖𝑖≠𝑖𝑖 𝑖𝑖≠𝑖𝑖 𝑁𝑁
𝑖𝑖=1 𝑖𝑖≠𝑘𝑘 𝑁𝑁
𝑘𝑘=1 𝑘𝑘≠𝑖𝑖 𝑁𝑁
𝑖𝑖=1 )(1−
𝑞𝑞𝑖𝑖(1− 𝑍𝑍𝑖𝑖))+∑ ∑ ∑𝑁𝑁𝑖𝑖=1𝐹𝐹𝑖𝑖𝑘𝑘𝑘𝑘𝑖𝑖𝑤𝑤𝑖𝑖𝑖𝑖𝑋𝑋𝑖𝑖𝑘𝑘𝑘𝑘𝑖𝑖(1− 𝑞𝑞𝑘𝑘(1− 𝑍𝑍𝑘𝑘) 𝑖𝑖≠𝑖𝑖
𝑖𝑖≠𝑘𝑘 𝑁𝑁
𝑘𝑘=1 𝑘𝑘≠𝑖𝑖 𝑁𝑁
𝑖𝑖=1 )+
∑ ∑ (∑𝑁𝑁𝑖𝑖=1𝐹𝐹𝑖𝑖𝑖𝑖𝑖𝑖𝑖𝑖𝑋𝑋𝑖𝑖𝑖𝑖𝑖𝑖𝑖𝑖𝑤𝑤𝑖𝑖𝑖𝑖�1− 𝑞𝑞𝑖𝑖(1− 𝑍𝑍𝑖𝑖)� 𝑖𝑖≠𝑖𝑖
𝑖𝑖≠𝑖𝑖 𝑁𝑁
𝑖𝑖=1 𝑖𝑖≠𝑖𝑖 𝑁𝑁
𝑖𝑖=1 +∑𝑁𝑁𝑘𝑘=1𝐹𝐹𝑖𝑖𝑘𝑘𝑖𝑖𝑖𝑖
𝑘𝑘≠𝑖𝑖 𝑘𝑘≠𝑖𝑖
𝑋𝑋𝑖𝑖𝑘𝑘𝑖𝑖𝑖𝑖𝑤𝑤𝑖𝑖𝑖𝑖�1− 𝑞𝑞𝑘𝑘(1− 𝑍𝑍𝑘𝑘)�+𝐹𝐹𝑖𝑖𝑖𝑖𝑖𝑖𝑖𝑖𝑋𝑋𝑖𝑖𝑖𝑖𝑖𝑖𝑖𝑖𝑤𝑤𝑖𝑖𝑖𝑖+𝐹𝐹𝑖𝑖𝑖𝑖𝑖𝑖𝑖𝑖𝑋𝑋𝑖𝑖𝑖𝑖𝑖𝑖𝑖𝑖𝑤𝑤𝑖𝑖𝑖𝑖+𝐹𝐹𝑖𝑖𝑖𝑖𝑖𝑖𝑖𝑖𝑋𝑋𝑖𝑖𝑖𝑖𝑖𝑖𝑖𝑖𝑤𝑤𝑖𝑖𝑖𝑖)
+𝜌𝜌 �∑ ∑ ∑ ∑𝑁𝑁𝑖𝑖=1∑𝑖𝑖=1𝑁𝑁+1∑𝑁𝑁+1𝑖𝑖=1�𝐹𝐹𝑖𝑖𝑖𝑖𝑖𝑖𝑖𝑖𝑤𝑤𝑖𝑖𝑖𝑖𝑋𝑋𝑖𝑖𝑘𝑘𝑖𝑖𝑖𝑖𝑈𝑈𝑖𝑖𝑖𝑖𝑖𝑖1𝑞𝑞𝑘𝑘(1− 𝑞𝑞𝑖𝑖(1− 𝑍𝑍𝑖𝑖))(1−
𝑖𝑖≠𝑖𝑖 𝑁𝑁
𝑖𝑖=1 𝑖𝑖≠𝑘𝑘 𝑁𝑁
𝑘𝑘=1 𝑁𝑁 𝑖𝑖=1
𝑞𝑞𝑖𝑖(1− 𝑍𝑍𝑖𝑖)) +𝐹𝐹𝑖𝑖𝑖𝑖𝑖𝑖𝑖𝑖𝑤𝑤𝑖𝑖𝑖𝑖𝑋𝑋𝑖𝑖𝑘𝑘𝑖𝑖𝑖𝑖𝑈𝑈𝑖𝑖𝑖𝑖𝑖𝑖1𝑈𝑈𝑖𝑖𝑖𝑖𝑖𝑖2𝑞𝑞𝑘𝑘𝑞𝑞𝑖𝑖�+ �𝐹𝐹𝑖𝑖𝑘𝑘𝑖𝑖𝑖𝑖𝑤𝑤𝑖𝑖𝑖𝑖𝑋𝑋𝑖𝑖𝑘𝑘𝑖𝑖𝑖𝑖𝐶𝐶𝑖𝑖𝑖𝑖𝑖𝑖1𝑞𝑞𝑖𝑖(1− 𝑞𝑞𝑘𝑘(1− 𝑍𝑍𝑘𝑘))(1− 𝑞𝑞𝑖𝑖(1− 𝑍𝑍𝑖𝑖)) +𝐹𝐹𝑖𝑖𝑘𝑘𝑖𝑖𝑖𝑖𝑤𝑤𝑖𝑖𝑖𝑖𝑋𝑋𝑖𝑖𝑘𝑘𝑖𝑖𝑖𝑖𝐶𝐶𝑖𝑖𝑖𝑖𝑖𝑖1𝐶𝐶𝑖𝑖𝑖𝑖𝑖𝑖2𝑞𝑞𝑖𝑖𝑞𝑞𝑖𝑖�+
𝐹𝐹𝑖𝑖𝑖𝑖𝑖𝑖𝑖𝑖𝑤𝑤𝑖𝑖𝑖𝑖𝑋𝑋𝑖𝑖𝑘𝑘𝑖𝑖𝑖𝑖𝑈𝑈𝑖𝑖𝑖𝑖𝑖𝑖1𝐶𝐶𝑖𝑖𝑖𝑖𝑖𝑖1𝑞𝑞𝑖𝑖𝑞𝑞𝑘𝑘+∑ ∑ ∑𝑁𝑁𝑖𝑖=1∑𝑁𝑁+1𝑖𝑖=1� 𝐹𝐹𝑖𝑖𝑖𝑖𝑖𝑖𝑖𝑖𝑤𝑤𝑖𝑖𝑖𝑖𝑞𝑞𝑘𝑘𝑋𝑋𝑖𝑖𝑘𝑘𝑘𝑘𝑖𝑖𝑈𝑈𝑖𝑖𝑖𝑖𝑖𝑖1(1− 𝑞𝑞𝑖𝑖(1− 𝑖𝑖≠𝑖𝑖
𝑁𝑁 𝑘𝑘=1 𝑁𝑁 𝑖𝑖=1
𝑍𝑍𝑖𝑖)) + 𝐹𝐹𝑖𝑖𝑖𝑖𝑖𝑖𝑖𝑖𝑤𝑤𝑖𝑖𝑖𝑖𝑞𝑞𝑘𝑘𝑞𝑞𝑖𝑖𝑋𝑋𝑖𝑖𝑘𝑘𝑘𝑘𝑖𝑖𝑈𝑈𝑖𝑖𝑖𝑖𝑖𝑖1𝑈𝑈𝑖𝑖𝑖𝑖𝑖𝑖2� +∑𝑁𝑁𝑘𝑘=1𝜂𝜂𝑘𝑘𝑞𝑞𝑘𝑘(1− 𝑍𝑍𝑘𝑘)𝑌𝑌𝑘𝑘𝑘𝑘 +
∑ ∑ 𝜑𝜑𝑖𝑖𝑖𝑖𝑤𝑤𝑖𝑖𝑖𝑖(𝑌𝑌𝑖𝑖𝑖𝑖𝑞𝑞𝑖𝑖(1− 𝑍𝑍𝑖𝑖) +𝑌𝑌𝑖𝑖𝑖𝑖𝑞𝑞𝑖𝑖�1− 𝑍𝑍𝑖𝑖�) +∑ ∑𝑁𝑁𝑖𝑖=1∑2𝑖𝑖=1(𝑈𝑈𝑖𝑖𝑖𝑖𝑘𝑘+1𝑖𝑖𝑓𝑓𝑘𝑘+1+ 𝑖𝑖≠𝑖𝑖
𝑁𝑁 𝑖𝑖=1 𝑁𝑁
𝑖𝑖=1 𝑖𝑖≠𝑖𝑖 𝑁𝑁 𝑖𝑖=1
𝐶𝐶𝑖𝑖𝑖𝑖𝑘𝑘+1𝑖𝑖𝑓𝑓𝑘𝑘+1)�
(1)
Subject to:
∑𝑁𝑁𝑖𝑖=1𝑋𝑋𝑖𝑖𝑘𝑘𝑖𝑖𝑖𝑖=𝑌𝑌𝑖𝑖𝑘𝑘 ∀𝑖𝑖,𝑗𝑗 ∈ 𝑁𝑁,𝑘𝑘 ∈{1, … ,𝑁𝑁} j≠ 𝑖𝑖 (3) ∑𝑁𝑁𝑘𝑘=1𝑋𝑋𝑖𝑖𝑘𝑘𝑖𝑖𝑖𝑖=𝑌𝑌𝑖𝑖𝑖𝑖 ∀𝑖𝑖,𝑗𝑗 ∈ 𝑁𝑁,𝑚𝑚 ∈{1, … ,𝑁𝑁} j≠ 𝑖𝑖 (4)
∑𝑁𝑁𝑘𝑘=1𝑌𝑌𝑖𝑖𝑘𝑘 = 1 ∀𝑖𝑖 ∈ 𝑁𝑁 (5)
� 𝑌𝑌𝑘𝑘𝑘𝑘 =𝑃𝑃 𝑁𝑁
𝑘𝑘=1
(6)
∑𝑁𝑁𝑖𝑖=1𝑋𝑋𝑖𝑖𝑘𝑘𝑖𝑖𝑖𝑖+𝑈𝑈𝑖𝑖𝑖𝑖𝑘𝑘𝑖𝑖 ≤ 𝑌𝑌𝑘𝑘𝑘𝑘 ∀𝑖𝑖,𝑗𝑗 ∈ 𝑁𝑁, j≠ 𝑖𝑖,𝑘𝑘 ∈{1, … ,𝑁𝑁},𝑟𝑟 ∈{1,2} (7) ∑𝑁𝑁𝑘𝑘=1𝑋𝑋𝑖𝑖𝑘𝑘𝑖𝑖𝑖𝑖+𝐶𝐶𝑖𝑖𝑖𝑖𝑖𝑖𝑖𝑖 ≤ 𝑌𝑌𝑖𝑖𝑖𝑖 ∀𝑖𝑖,𝑗𝑗 ∈ 𝑁𝑁, j≠ 𝑖𝑖,𝑚𝑚 ∈{1, … ,𝑁𝑁},𝑟𝑟 ∈{1,2} (8) ∑ 𝑈𝑈𝑖𝑖𝑖𝑖𝑖𝑖1+∑𝑁𝑁𝑖𝑖=1𝑋𝑋𝑖𝑖𝑖𝑖𝑖𝑖𝑖𝑖+∑𝑁𝑁𝑖𝑖=1𝑋𝑋𝑖𝑖𝑖𝑖𝑖𝑖𝑖𝑖 = 1− ∑𝑁𝑁𝑘𝑘=1𝑌𝑌𝑖𝑖𝑘𝑘𝑍𝑍𝑘𝑘
𝑘𝑘≠𝑖𝑖 𝑘𝑘≠𝑖𝑖 𝑁𝑁+1
𝑖𝑖=1 ∀𝑖𝑖,𝑗𝑗 ∈ 𝑁𝑁 j≠ 𝑖𝑖 (9)
∑ 𝐶𝐶𝑖𝑖𝑖𝑖𝑖𝑖1+∑𝑁𝑁𝑘𝑘=1𝑋𝑋𝑖𝑖𝑘𝑘𝑖𝑖𝑖𝑖+∑𝑁𝑁𝑘𝑘=1𝑋𝑋𝑖𝑖𝑘𝑘𝑖𝑖𝑖𝑖 = 1− ∑𝑁𝑁𝑖𝑖=1𝑌𝑌𝑖𝑖𝑖𝑖𝑍𝑍𝑖𝑖 𝑖𝑖≠𝑖𝑖 𝑖𝑖≠𝑖𝑖 𝑁𝑁+1
𝑖𝑖=1 ∀𝑖𝑖,𝑗𝑗 ∈ 𝑁𝑁 j≠ 𝑖𝑖 (10)
∑𝑁𝑁𝑖𝑖=1𝑈𝑈𝑖𝑖𝑖𝑖𝑖𝑖𝑖𝑖2+𝑈𝑈𝑖𝑖𝑖𝑖𝑘𝑘+11 =∑𝑖𝑖=1𝑁𝑁 𝑈𝑈𝑖𝑖𝑖𝑖𝑖𝑖1(1− 𝑍𝑍𝑖𝑖)∀𝑖𝑖,𝑗𝑗 ∈ 𝑁𝑁, j≠ 𝑖𝑖 (11) � 𝐶𝐶𝑖𝑖𝑖𝑖𝑖𝑖2
𝑁𝑁
𝑖𝑖=1 +𝐶𝐶𝑖𝑖𝑖𝑖𝑘𝑘+11=� 𝐶𝐶𝑖𝑖𝑖𝑖𝑖𝑖1 𝑁𝑁
𝑖𝑖=1 (1− 𝑍𝑍𝑖𝑖) ∀𝑖𝑖,𝑗𝑗 ∈ 𝑁𝑁, j≠ 𝑖𝑖
(12)
� 𝑈𝑈𝑖𝑖𝑖𝑖𝑖𝑖𝑖𝑖 ≤ 𝑌𝑌𝑖𝑖𝑖𝑖 2
𝑖𝑖=1 ∀𝑖𝑖,𝑗𝑗 ∈ 𝑁𝑁, j≠ 𝑖𝑖,𝑙𝑙 ∈{1, … ,𝑁𝑁}
(13)
∑2𝑖𝑖=1𝐶𝐶𝑖𝑖𝑖𝑖𝑖𝑖𝑖𝑖 ≤ 𝑌𝑌𝑖𝑖𝑖𝑖 ∀𝑖𝑖,𝑗𝑗 ∈ 𝑁𝑁, j≠ 𝑖𝑖,𝑛𝑛 ∈{1, … ,𝑁𝑁} (14) ∑𝑁𝑁𝑘𝑘=1𝑌𝑌𝑖𝑖𝑘𝑘
𝑘𝑘≠𝑖𝑖 𝑘𝑘≠𝑖𝑖
𝑍𝑍𝑘𝑘+∑𝑁𝑁𝑖𝑖=1∑2𝑖𝑖=1𝑈𝑈𝑖𝑖𝑖𝑖𝑖𝑖𝑖𝑖𝑍𝑍𝑖𝑖+∑𝑖𝑖=12 𝑈𝑈𝑖𝑖𝑖𝑖𝑘𝑘+1𝑖𝑖+∑𝑁𝑁𝑖𝑖=1𝑋𝑋𝑖𝑖𝑖𝑖𝑖𝑖𝑖𝑖+∑𝑁𝑁𝑖𝑖=1𝑋𝑋𝑖𝑖𝑖𝑖𝑖𝑖𝑖𝑖=1 ∀𝑖𝑖,𝑗𝑗 ∈ 𝑁𝑁, j≠ 𝑖𝑖
(15)
∑𝑁𝑁𝑖𝑖=1𝑌𝑌𝑖𝑖𝑖𝑖 𝑖𝑖≠𝑖𝑖 𝑖𝑖≠𝑖𝑖
𝑍𝑍𝑖𝑖+∑𝑁𝑁𝑖𝑖=1∑2𝑖𝑖=1𝐶𝐶𝑖𝑖𝑖𝑖𝑖𝑖𝑖𝑖𝑍𝑍𝑖𝑖+∑𝑖𝑖=12 𝐶𝐶𝑖𝑖𝑖𝑖𝑘𝑘+1𝑖𝑖 +∑𝑁𝑁𝑘𝑘=1𝑋𝑋𝑖𝑖𝑘𝑘𝑖𝑖𝑖𝑖+∑𝑁𝑁𝑖𝑖=1𝑋𝑋𝑖𝑖𝑘𝑘𝑖𝑖𝑖𝑖=1 ∀𝑖𝑖,𝑗𝑗 ∈ 𝑁𝑁, j≠ 𝑖𝑖
(16)
𝑌𝑌𝑘𝑘+1𝑘𝑘+1= 1 (17)
� [𝑠𝑠𝑘𝑘+𝑒𝑒𝑘𝑘𝑞𝑞𝑘𝑘]𝑍𝑍𝑘𝑘 ≤ 𝐵𝐵 𝑁𝑁
𝑘𝑘=1
(18)
∑𝑖𝑖=1𝑁𝑁 [∑𝑖𝑖=1𝑁𝑁 (𝑤𝑤𝑖𝑖𝑖𝑖+𝑤𝑤𝑖𝑖𝑖𝑖)]𝑌𝑌𝑖𝑖𝑘𝑘+∑𝑁𝑁𝑖𝑖=1∑𝑁𝑁𝑖𝑖=1∑𝑖𝑖=1𝑅𝑅 (𝑈𝑈𝑖𝑖𝑖𝑖𝑘𝑘𝑖𝑖+𝐶𝐶𝑖𝑖𝑖𝑖𝑘𝑘𝑖𝑖)𝑤𝑤𝑖𝑖𝑖𝑖 ≤ 𝐶𝐶𝐶𝐶𝑘𝑘∀𝑘𝑘 ∈{1, … ,𝑁𝑁+ 1} (19) 𝑌𝑌𝑖𝑖𝑘𝑘 ∈{0,1},𝑋𝑋𝑖𝑖𝑘𝑘𝑖𝑖𝑖𝑖∈{0,1},𝑈𝑈𝑖𝑖𝑖𝑖𝑖𝑖𝑖𝑖 ∈{0,1},𝐶𝐶𝑖𝑖𝑖𝑖𝑖𝑖𝑖𝑖 ∈{0,1}
,𝑍𝑍𝑘𝑘 ∈{0,1} ∀𝑖𝑖,𝑗𝑗,𝑘𝑘,𝑚𝑚,𝑛𝑛,𝑙𝑙,𝑟𝑟
(20)
In the objective function (2), the first term represents the fixed cost of locating hub. The second and third term calculate regular transportation cost of flow with both source and destination at spoke nodes. The fourth term calculates the regular transportation cost where the source or destinations or both of them are hub. The fifth and sixth term present the transportation cost of rerouting the flow through the backup hub. Seventh term calculates repair costs of disrupted hub. Eighth term calculates the penalties of losing flow/ commodity in disrupted situations where the source or destination of the flow is hub. Since the hub is disrupted it can't send or receive any flow to or from other nodes in the network. So the penalty cost, 𝜑𝜑𝑖𝑖𝑖𝑖 is considered twice as much as the transportation cost of a unit flow between origin i and destination j. ninth term in the objective function calculates the cost of using a dummy non failable hub.
Constraints 3-6 are classic constraints for the single allocation p-hub median problem. Constraints 3 and 4 guarantee that all flows between an origin– destination pair has been routed via the hub.Constraint 5 enforce single allocation rule in the network.Constraint 6 shows that only P hub can be established in the hub network. Constraints 7 and 8 ensure that the primary hub and backup hubs are different which are nodes selected as hubs. Constraints 9 and 10 ensure that alternative routes have been selected for all flows in level one, except where origin or destination node of a flow is hub or the selective primary hub for that flow is protected.Constraint 11 and 12 ensure that alternative routes are selected for second level, except where in the prior level, backup hub for the flow has been protected or be a dummy non failable hub. Constraints 13 and 14 guarantee that backup hubs don't be same at different levels. Constraints 15 and 16 enforce each non-hub node to be allocated to the dummy non-failable hub or fortified hub at a certain level. Constrain 17 shows that itrequires the dummy non failable hub to be opened. Constraint 18 shows constraint of available budget for fortification. Constraint 19 is related to capacity constraint. Constraint 20 is domain constraint.
4-Solution method
Genetic algorithm unlike some meta-heuristic approaches work with a population of solution (chromosome) on each iteration instead of a single solution. Genetic algorithm has been successfully applied to the hub location problem in many papers. So in order to solve the mathematical model presented in this paper the genetic algorithm is going to be used which has been derived from Azizi et al (2016).
4-1-Solution representation
The number of genes in the answer chromosome is N, equal to number of nodes. This chromosome represents the location of hubs and allocate none hubs to hubs.
Figure 1 illustrates a typical solution to the problem with 10 nodes and 3 hubs. Nodes 1, 5, and 7 are assumed to be hub facilities and the non-hub 3 is allocated to hub 1.
7 7 1 7 5 5 5 1 5 1
Fig. 1. Solution representation scheme
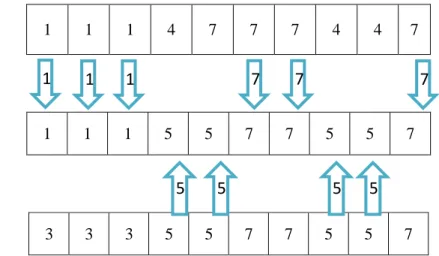
4-2-Crossover operator
Here the crossover operator will be explained by an example. As can be seen in Figure 2, in the parent 1, the nodes 1, 4 and 7 are hubs and in the second parent the hubs are node 3, 5 and 7. Parent1 is selected to donate the offspring chromosome from left to right. All genes that contain value of 1 in the parent 1, give value 1 in offspring chromosome. Then parent2 is selected to donate the offspring chromosome. The first candidate to examine is the hub center 3, since all the genes that contain3 in the parent2 are occupied by hub center 1 in offspring chromosome, the next hub in parent2 is examined. That is hub center 5 and all the genes that contain 5 in the parent2 and are empty in offspring chromosome, give value 5. Similarly continued until all genes of offspring chromosome be occupied. At the end if the offspring chromosome has one or more genes without value, the offspring is unacceptable and the process starts again from the beginning by selecting two parents.
Parent1:
7 4 4 7 7 7 4 1 1 1
Offspring:
7 5 5 7 7 5 5 1 1 1
Parent2:
7 5 5 7 7 5 5 3 3 3
Fig. 2. Example of crossover operation
4-3-Mutation operator
The selected mutation in this paper is different from the Azizi et al (2016). As it has shown in figure 3, a gene has been selected randomly and if that gene is non hub node, another hub is selected randomly between other hub nodes in that chromosome and is replaced by prior hub.
6
2
5
5
6
5
5
2
2
2
6
2
5
5
6
5
6
2
2
2
Fig. 3. Example of mutation operation
The backup hub and alternate routes, as well as fortified hub are generated randomly and penalty strategy is considered for infeasible answers that do not adhere the capacity constraints. Generally speaking, GAs stop when the best fitness of the population converges, or when the algorithm reaches a pre-specified time limit or iteration limit. We terminate the algorithm for small and median problem,
1
1
7
7
7
1
5
5
5
5
when the improvement in the best solution is less than 10-5 for 6 consecutive iterations and for the large
problem when the improvement in the best solution is less than 10-5 for 10 consecutive iterations.
5-Computational results
The computational results of genetic algorithm and GAMS are presented in Table 1. We generate eighteen random test problems with the number of nodes N and number of hubs H. In this table, we report the total cost, hub location, fortified hub and processing time to obtain the optimal/best solutions. Each test problem is run 20 times and the best results are reported.
Table1. Computational results for the GA and GAMS
%gap GA GAMS 𝛂𝛂 Test problem Time (s) Total cost Time (s) Total cost Fortified hub Selected hubs 0 7.27 13320632.05 28.518 13320632.05 2
1 2
. 0 2 4N2H 0 7.31 14098887.25 23.03 14098887.25 2
1 2
. 0 4 0 7.29 15655397.65 4.197 15655397.65 2
1 2
. 0 8 0 14.49 1443321.82 252.33 1443321.82 2
1 2
. 0 2 5N2H 0 11.58 1461993.01 258.37 1461993.01 2
1 2
. 0 4 0 10.39 1499335.39 260.99 1499335.39 2
1 2
. 0 8 -21.95 5322911.12 -- 1
1 2
. 0 2 7N2H -24.80 5444198.47 -- 1
1 2
. 0 4 -23.50 5686773.18 -- 1
1 2
. 0 8 -160.68 6482956.40 -6
6 15
. 0 2 15N2H -158.95 6595562.8 -- 6
6 15
. 0 4 -161.80 6820775.60 -- 6
6 15
. 0 8 -164.44 3051601.72 -- 1 6-4-1 . 0 2 15N3H -228.31 3155955.92 -- 1 6-4-1 . 0 4 -192.188 3364644.32 -- 1 6-4-1 . 0 8 -1216.01 3908675.12 -- 10 1-2-3-4-10 . 0 2 20N5H -1342.05 4005790.32 -- 7 1-2-3-4-7 . 0 4 -1459.48 4353149.92 -- 7 1-2-3-4-7 . 0 8
BARON solver software of GAMS can't solve the problem with size more than 5 nodes so just genetic algorithm is used to solve.
6-Sensitivity analysis
In order to recognize the most important parameters and demonstrate effectiveness of the model several sensitivity analysis are carried out. Figure 4 illustrates the sensitivity analysis of the fortification budget, B=1000 results in lower total cost rather than B=0.
Fig. 4. Fortification impact on the total cost
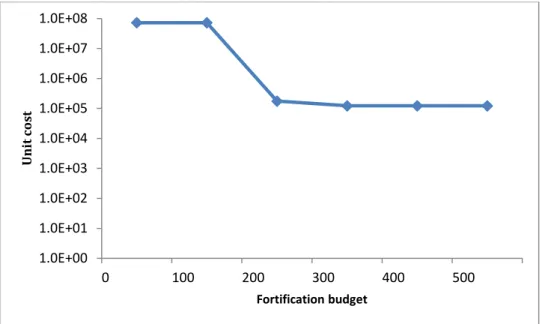
Figure 5 shows the comparison done for the values of B. As expected, the curve illustrate a downward trend as the fortification budget increases. Curve, the attendance of ‘‘flat’’ regions for the values of B between 0 and 100 is due to the fact that no facility can be fortified and the attendance of ‘‘flat’’ regions for the values of B exceeding 300, is attributed to the fact that all facilities have been fortified.
Fig. 5. Values of fortification budget impact on the total cost
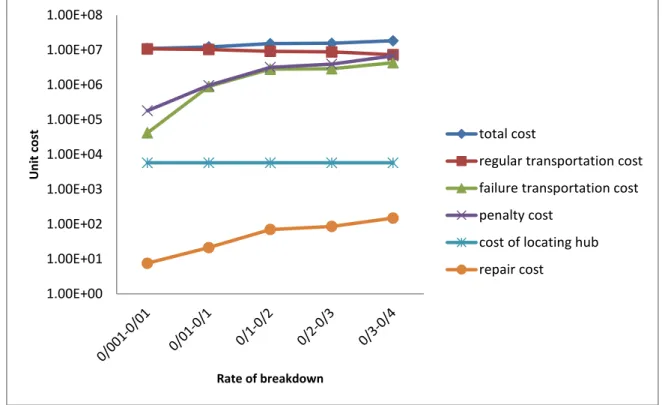
Another input parameter is rate of breakdown. Figure 6 illustrates the sensitivity analysis of the rate of breakdown. By increasing this rate the total cost will increase. In addition, when probability of disruption increase, transportation cost, penalty cost and repair cost increase, too. While, transportation cost in normal situation decreases.
0.00E+00 5.00E+06 1.00E+07 1.50E+07 2.00E+07 2.50E+07 3.00E+07
1 2 3 4 5 6 7 8 9
U
ni
t c
ost
test problem
B=1000 B=0
1.0E+00 1.0E+01 1.0E+02 1.0E+03 1.0E+04 1.0E+05 1.0E+06 1.0E+07 1.0E+08
0 100 200 300 400 500
Un
it
c
os
t
Fortification budget
Fig. 6. Rate of breakdowns impact on the cost
Figure 7 shows the computational time for solving the problem with GAMS and GA. The CPU time of all the GAMS and GA are increased by increasing the size of nodes and hubs.
Fig. 7. CPU time of the GAMS and GA
7-Conclusions and future research
In traditional network design, all facilities are always considered available and there is no disruption for facilities. In practice, after facilities are built and deployed, they face with various disruptions. Therefore, decision makers must design networks and determine the location of facilities so that not only being optimized for the current state but also being efficient in facilities lifetime. This paper proposed new mathematical formulation for designing reliable hub location problems. This model determines the location of hubs, backup hubs, and alternative routes and allocates non hubs to hubs, and also considers a limited budget for hub fortification to cope with disruptions. As further studies, developing efficient exact solution approaches for this problem and considering correlation in the rate
1.00E+00 1.00E+01 1.00E+02 1.00E+03 1.00E+04 1.00E+05 1.00E+06 1.00E+07 1.00E+08
U
ni
t c
ost
Rate of breakdown
total cost
regular transportation cost failure transportation cost penalty cost
cost of locating hub repair cost
1 10 100 1000 10000
N=4
H=2 N=5 H=2 N=7 H=2 N=15 H=2 N=15 H=3 N=20 H=5
CPU
Ti
m
e (
s)
Test Problem
GAMS GA
of breakdown would be of interest. Also in our future research we intend to concentrate on allowing direct connections between non–hub nodes.
References
An, Y., Zhang, Y., & Zeng, B. (2015). The reliable hub-and-spoke design problem: Models and algorithms. Transportation Research Part B: Methodological, 77, 103-122.
Asl-Najafi, J., Zahiri, B., Bozorgi-Amiri, A., & Taheri-Moghaddam, A. (2015). A dynamic closed-loop location-inventory problem under disruption risk. Computers & Industrial Engineering, 90, 414-428.
Azizi, N., Chauhan, S., Salhi, S., & Vidyarthi, N. (2016). The impact of hub failure in hub-and-spoke networks: Mathematical formulations and solution techniques. Computers & Operations
Research, 65, 174-188.
Bashiri, M., & Rezanezhad, M. (2015). A reliable multi-objective p-hub covering location problem considering of hubs capabilities. International Journal of Engineering, Transactions B:
Applications, 28(5), 717-729.
Cui, T., Ouyang, Y., & Shen, Z. J. M. (2010). Reliable facility location design under the risk of disruptions. Operations research, 58(4-part-1), 998-1011.
Drezner, Z. (1987). Heuristic solution methods for two location problems with unreliable facilities. Journal of the Operational Research Society, 38(6), 509-514.
Eghbali, M., Abedzadeh, M., & Setak, M. (2014). Multi-objective reliable hub covering location considering customer convenience using NSGA-II. International Journal of System Assurance
Engineering and Management, 5(3), 450-460.
Jalali, S., Seifbarghy, M., Sadeghi, J., & Ahmadi, S. (2016). Optimizing a bi-objective reliable facility location problem with adapted stochastic measures using tuned-parameter multi-objective algorithms. Knowledge-Based Systems, 95, 45-57.
Kim, H., & O'Kelly, M. E. (2009). Reliable p‐hub location problems in telecommunication networks. Geographical Analysis, 41(3), 283-306.
Li, Q., Zeng, B., & Savachkin, A. (2013). Reliable facility location design under disruptions. Computers & Operations Research, 40(4), 901-909.
Liberatore, F., Scaparra, M. P., & Daskin, M. S. (2012). Hedging against disruptions with ripple effects in location analysis. Omega, 40(1), 21-30.
Losada, C., Scaparra, M. P., & O’Hanley, J. R. (2012). Optimizing system resilience: a facility protection model with recovery time. European Journal of Operational Research, 217(3), 519-530.
Medal, H. R., Pohl, E. A., & Rossetti, M. D. (2014). A multi-objective integrated facility location-hardening model: Analyzing the pre-and post-disruption tradeoff. European Journal of Operational
Research, 237(1), 257-270.
Mohammadi, M., Jolai, F., & Tavakkoli-Moghaddam, R. (2013). Solving a new stochastic multi-mode p-hub covering location problem considering risk by a novel multi-objective algorithm. Applied
Mathematical Modelling, 37(24), 10053-10073.
Mohammadi, M., Tavakkoli-Moghaddam, R., Siadat, A., & Dantan, J. Y. (2016). Design of a reliable logistics network with hub disruption under uncertainty. Applied Mathematical Modelling, 40(9-10), 5621-5642.
Mohammadi, M., Tavakkoli-Moghaddam, R., Siadat, A., & Rahimi, Y. (2016). A game-based meta-heuristic for a fuzzy bi-objective reliable hub location problem. Engineering Applications of Artificial Intelligence, 50, 1-19.
Mohammadi, M., Jula, P., & Tavakkoli-Moghaddam, R. (2017). Design of a reliable modal multi-commodity model for hazardous materials transportation under uncertainty. European Journal of
Operational Research, 257(3), 792-809.
Parvaresh, F., Golpayegany, S. H., Husseini, S. M., & Karimi, B. (2013). Solving the p-hub median problem under intentional disruptions using simulated annealing. Networks and Spatial
Economics, 13(4), 445-470.
Parvaresh, F., Husseini, S. M., Golpayegany, S. H., & Karimi, B. (2014). Hub network design problem in the presence of disruptions. Journal of Intelligent Manufacturing, 25(4), 755-774.
Peng, P., Snyder, L. V., Lim, A., & Liu, Z. (2011). Reliable logistics networks design with facility disruptions. Transportation Research Part B: Methodological, 45(8), 1190-1211.
Sadeghi, M., Jolai, F., Tavakkoli-Moghaddam, R., & Rahimi, Y. (2015). A new stochastic approach for a reliable p-hub covering location problem. Computers & Industrial Engineering, 90, 371-380.
Snyder, L. V., & Daskin, M. S. (2005). Reliability models for facility location: the expected failure cost case. Transportation Science, 39(3), 400-416.
Zarandi, M. F., Davari, S., & Sisakht, S. H. (2012). The Q-coverage multiple allocation hub covering problem with mandatory dispersion. Scientia Iranica, 19(3), 902-911.
Zhang, Y., Snyder, L. V., Qi, M., & Miao, L. (2016). A heterogeneous reliable location model with risk pooling under supply disruptions. Transportation Research Part B: Methodological, 83, 151-178.