Journal of Industrial and Systems Engineering
Vol. 8, No. 3, pp 59-76 Summer 2015
Applying a decision support system for accident
analysis by using data mining approach: A case
study
on
one of the Iranian manufactures
Rouzbeh Ghousi*
Department of Industrial Engineering, Iran University of Science and Technology, Iran
ghousi@iust.ac.ir
Abstract
Uncertain and stochastic states have been always taken into consideration in the fields of accident and risk management, and have made decision making a difficult and complicated job for managers in corrective action selection and control measure approach. In this article, big data sets concerning accidents occurred in a manufacturing unit have been studied by applying data mining tools. First, the data was preprocessed and then, effective features in an accident were selected while consulting with industry experts and considering production process information. By performing clustering methods, data was divided into separate clusters and by using Dunn Index as validator of clustering, optimum number of clusters has been determined. In the next stage, by using the Apriori Algorithm as one of association rule methods, the relations between these fields were identified and the association rules among them were extracted and analyzed. Since managers need precise information for decision making, data mining methods, when to be used properly, may act as a suitable decision supporting system.
Keywords
:
Accident; Data Mining; Association Rules; K-means Algorithm; Apriori Algorithm.*Corresponding author.
1- Introduction
Simply speaking, data mining is knowledge of discovery through huge amount of data. It is an approach that can recognize hidden relations between features by processing data of an organization. This approach is divided into two categories: Descriptive and Predictive. Descriptive data mining’s task is determining data features and attributes in a database. The task of predictive DM is performing inference on existing data for prediction in future (Han, 2006).
The accident is an undesired and unplanned event that interferes with industrial operations. It may have outcomes such as injuries, death as well as destruction of properties (CCOHS, 2006). The International Labor Organization (ILO), announces the statistics of workers died every year from work related injuries and occupational diseases. According to Iran's legal medicine organization report, during ten years from 2004 to 2013, more than twelve thousand workers died because of work accidents. Falling from a height, crash with hard objects, electrical shock, and burning and oxygen deficiency, respectively are the most important causes of work related fatalities (lmo.ir, 2014).
In this part of research the literature review section can be divided in to three main categories: 1) Quantitative and qualitative risk assessment and accident forecasting methods 2) Fuzzy logic or fuzzy rule based application in risk and accident analysis 3) Data mining contribution in risk and accident analysis.
Various quantitative and qualitative methods of risk evaluation enable managers and industrial safety experts to be informed of safety status in production plants and industrial environments before an accident occurrence. According to the first category, Safety audit, fault tree analysis, hazard operability study, what-if analysis and risk matrices can be mentioned as risk evaluation methods (Reniers, et al., 2005). On the other hand, applying accident forecasting methods enable experts to make preventive decisions, before accident related harms occur. Among these methods, scenario analysis, regression based methods, time series, Markov chains, Grey models, neural and Bayesian networks can be mentioned (Zheng and Liu, 2009). For instance, in a broad research in Turkey’s coal mines, time series have been applied for accident and job risk forecasting (Sari et al., 2009).
Some other researchers have applied Bow-Tie model to evaluate job risks’ in chemical and nuclear plants in a project defined by Social Security Ministry of the Netherlands. In their model, probable internal and logical relations between various effective events in industrial accidents and their outcomes have been simulated (Ale et al., 2008). Other researchers have utilized logical models in quantitative evaluation of job risks such as load drops, falling from ladders and crane reversal. Being inspired form Bow-Tie technique and using top-down approach which leads to breaking events into simpler components, task block diagram has been considered as a compatible logical model with rules of probability theory (Aneziris et al.,2008).
Regarding to the second category, some researchers have utilized fuzzy sets’ control rules (if-then) to improve risk chart method (Nait-Said et al., 2009). Whereas others have introduced a new model for evaluating job risks by means of fuzzy control rules. In this type of models, new factors have been introduced so that experts of this field may evaluate human behavior and environmental effects on risk evaluation align (Grassi et al., 2009). Considering non-deterministic situation in risk and accident fields and shortage of historical data, some researchers have provided a new method by means of fuzzy control rules for evaluating job risks of workers who operate in construction projects (Emre gurcanli et al., 2009). In another research, in order to measure risks of work accidents, fuzzy approach with the title of Fuzzy application procedure has been used. This methodology and supporting tool has the capability to evaluate job risks of different industries and determine control approaches and effective interferences in reduction of work risks (Mure, & Demichela., 2009).
Considering the importance of data mining methods in Customer Relation Management, 900 articles of 24 journals from 2000 to 2006 were considered and 87 papers were selected in another research. By studying these papers, various aspects of Customer relation management such as customer identification, customer attraction and customer retention as well as various data mining tasks like association rules, classification, clustering, prediction and regression have been categorized and, by means of a roadmap prospective research fields, have been clarified (Ngai et al., 2009). Regarding rapid development of technology, the amount of data in each field is increasing continuously. By utilizing data mining methods, gained knowledge from these data may be accessible. Association rules are one of the preferred methods among data mining tools. Apriori algorithm is the most common algorithm in association rule method. Researchers have studied and analyzed educational data of a high school in Istanbul by means of this algorithm and by using the outcomes and generated rules. As a result the relation between the courses in which students failed has been discovered (Buldu, & Mucgun, 2010). In another research, about 6500 records of railway accidents from 1996 to 2005 have been analyzed and the patterns among data have been discovered by using CRISP-DM, Clementine software, and association rules (Mirabadi & Sharifian, 2010). Researchers have designed customer’s value analysis model by applying K-Means algorithm and self-Organizing Map (SOM) in another study (Liang, 2010). Since the average of job injury rate in construction industry is higher in comparison to other fields, some researchers have studied reports of Taiwan’s accidents by means of association rules from 1999 to 2004. Results have shown that there are various patterns in job accidents of construction industry (Liao & Perng, 2008). Some other researchers have analyzed 1347 accidents of construction industry of Taiwan from 2000 to 2007 by means of association rules. This study has specified that such accidents occur when a combination of potential dangers exists such as working at high places without protecting equipments, lack of balance at the time of movement, low-quality safety equipments, inadequate work experience and injuries caused by confronting with an
unstable structures (Cheng et al., 2010). Some other researchers have explored in Taiwan construction industry by using classification and regression tree (CART) on 1542 accidents from 2000 to 2009 (Cheng et al., 2011). In another research, universities of Iran have been ranked by means of K-Means and AHP. In this case mining, 8 different criteria have been primarily determined to evaluate 177 important universities in Iran. Using K-Means and considering 8 selected criteria, all universities have been clustered and then important universities have been ranked by means of AHP algorithm (Rad et al., 2011).
Other researchers have studied two companies' accidents in construction sectors for identifying root causes of accidents and developing descriptive model. For developing mentioned model, various data mining methods such as Bayesian networks, decision rules, support vector machine and classification trees have been used (Rivas et al., 2011).
Other researchers, by using four applicable data mining algorithms, such as clustering analysis, association rules, decision tree and time series have analyzed fire accidents (Zhang & Jiang, 2012).
Regularly in chemical plants, same as other manufacturing industries, severe accidents are happening. For forecasting these accidents, event's root causes must be found. In another research, 347 case studies about major accidents in Taiwan petrochemical industry have been collected for analyzing and predicting between 2000 and 2010. In this research, classification and regression tree (CART), as the most common and practical data mining methods, have been used (Cheng et al, 2013).
Neonen (2013), have a study on Finnish national work related accidents and occupational disease statistics database, using data mining methods. In another research, a dataset including of occupational injuries and near accidents in Indian steel industry was analyzed and among 843 incident records, thirty five valuable rules according to three criteria, support, confidence and lift have extracted (Verma et al, 2014).
Cheng et al (2015), introduce a model that includes analytical hierarchy process in Chinese construction branch. In their paper, the Chinese construction defects' dataset from 2000 to 2010 was studied and many rules as worthy knowledge were discovered. In other research, occupational accidents and fatalities reports about Spanish mining sector, from 2003 to 2012 was analyzed by using Bayesian and decision trees algorithms as data mining methods. Many valuable rules as accident scenarios were obtained and the extracted knowledge was used to prevent from the same accidents and to achieve a safer work place (Lluís et al, 2015).
2-1- K-Means Clustering Method
Clustering technique is the method of grouping similar instances among huge amount of data. Data is divided into K different groups in which records are similar to each other and different from the records of other groups. In order to correctly
analyze a dataset, it is necessary to determine the optimum number of clusters. There are several indexes in the related literature for determining the optimum number of clusters such as Sum of Squared Error, Davies Bouldin and Dunn. Error is defined as the distance of all instances from the center of the closest cluster. To evaluate this index, first, the value of all errors should be squared and then all of them are added together. By means of relation (1), SSE can be measured as:
(1) . Once cluster i
is a representative point for C
i
and m cluster
i
C data point in X is
Davies Bouldin index is used to validate clustering, the minimum value of the index is the identifier of the optimum clustering. By means of relations (2) and (3), Davies Bouldin index can be measured as:
(2)
(3)
K is number of clusters, Si is average distance of all existing features in cluster i from
center of cluster and d (ci, cj) is distance between centers of clusters i and j (gurrutxaga
et al, 2011; Gunter, & Bunke, 2003). Unlike Davies Bouldin index, greater value of Dunn index illustrates more optimality of clustering. Using relations (4) to (7), Dunn index can be measured as the following.
) , ( 1 2 x m dist SSE i K
i x ci
∑∑
= ∈
=
)
,
(
i jj i ij
c
c
d
S
S
d
=
+
∆ = ≤ ≤ ≠ ≤ ≤ ≤ ≤ k l l j i i j k j k i c c c DI 1 , 1
1 max ( )
) , (
min
min
δ}
{
i j i j ll d x x x x c
c = ∈
∆( ) max ( , ) ,
}
{
i j i i j j ji c d x x x c x c
c, )=min ( , ) ∈ , ∈
(
δ
max min d d DI = ) ( 11
max
1,..., , 1ij K
i j k j
d
K
∑
= = ≠(4)
(5)
(6)
(7)
d is the distance function and Ci is a set of members which have been assigned to the
i-th cluster. According to equation (7), dmin illustrates minimum distance between
two members of different clusters while dmax is maximum distance between two
features both of which belonging to the same cluster. Thus, it is obvious that di is a
number between zero and infinity. Greater value of Dunn index illustrates higher quality of clustering (Wang & Zhang, 2007; Pakhira et al., 2004; Rizman Zalik & Zalik, 2011).
2-2- Association Rules Method
One of the other data mining operations is extracting association rules which deal with finding relations between features in a dataset. General format of an association rule is like relation (8):
(8)
It is necessary to state that I is defined as an item set while A and B are its subsets. A convincing and considerable rule must have minimum threshold of support and confidence. According to relation (9), support index of A and B implies percentage or amount of transactions which contain both A and B.
(9) Confidence index implies percentage or amount of transactions in which both A and B occur simultaneously. Confidence is measured according to relations (10) and (11):
(10)
Since support and confidence are not sufficient to filter undesired association rules, lift index is defined as relation (12). By measuring correlation between rules, lift covers the mentioned deficiency and reinforces support and confidence framework. (12)
If the value of the above relation is less than 1, transactions A and B will have negative correlation. If it is more than 1, they have positive correlation. This means that the occurrence of one of them implies the occurrence of the other one. However,
φ
=
∩
⊂
⊂
⇒
B
A
I
B
I
A
B
A
&
,
) ( )(A B P A B
Support ⇒ = ∪
) ( )
(A B P BA
Confidence ⇒ =
) ( ) ( ) ( ) ( ) ( ) ( A count Support B A count Support A Support B A Support A B P B A Confidence − ∪ − = ∪ = = ⇒ ) ( ) ( ) ( ) , ( B P A P B A P B A
lift = ∪
if lift exactly equals to 1, no correlation will exist between two considered sets and they are independent (Han, 2006).
3- Research Methodology
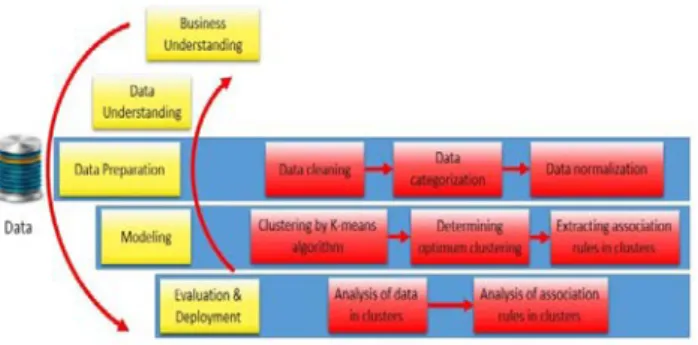
This research uses CRISP-DM method. This methodology consists of several stages including: Business Understanding, Data Understanding, Data Preprocessing, Modeling, Evaluation and Deployment. These stages will be described later. As it can be seen in fig 1, close to CRISP-DM classic model, the research model has been developed by considering the details of each stage and has been represented elaborately.
Fig. 1. Introducing the Model Based on CRISP-DM.
3-1- System Recognition Stage
One of the Iranian industrial enterprises has been selected as the research location in this study. Since the target of the research is analyzing industrial accidents in a manufacturing saloon, accident statistics of color, assemblage, body and press shop saloons have been separated from whole set of accident statistical data and have been studied separately.
3-2- Data Understanding Stage
In this stage, it is necessary to study the firm’s accident dataset. The research dataset has 1954 accident records, occurred from 2003 to 2010. This dataset has several fields including : personnel ID, work experience, education degree, age, season, month, day and hour of occurrence, rest duration (intensity of injury), injured organ, accident location (manufacturing saloons), cause of accident, how the accident is occurred and outcome of accident.
Personnel ID: is a categorical field that represents worker’s ID.
Work Experience: is a numerical field that represents duration of the worker’s presence in the firm.
Education Degree: is a categorical field that represents worker’s level of literacy. Age: is a numerical field.
Season, month, day and hour: are numerical fields that refer to time of accident occurrence.
Rest Duration: is a numerical field that refers to intensity of injury. Organ:is a categorical field that represents the injured organ.
Accident Location: is a categorical field that refers to the location where accident has occurred.
Cause of Accident: is a categorical field which consists of 6 different states including unsafe environmental condition, lack of personnel protection equipment, personal unsafe action, other’s unsafe action, shortage of facilities and technical deficiency. How Accident Occurred: is a categorical field and consists of 17 different states: capsule explosion, hit by equipment, hit by barrier, electrical shock, being cut by sharp objects, being cut by sharp surfaces, disperse of hot materials, disperse of chemicals, flying particles, hit bylift truck, crash with vehicles, falling down, falling from height, drop of objects, being burnt by heat, being stuck between two objects and sliding.
Outcome of accidents: is a categorical field that consists of 7 different states including being twisted, injured, being burnt by electricity, being burnt by chemicals, breaks , strike injury and maim.
After studying accident statistics in manufacturing saloons, visiting production processes, and consulting with the industry experts (especially managers), production experts and industrial safety engineers of the factory, these fields were selected for research: work experience, education degree, age, time of accident
occurrence, body organ involved, location of accident, cause of accident and how accident is occurred.
3-3- Data Preprocessing Stage
Since the data has been entered into the system by an operator, it had errors. Several errors have been detected and eliminated. For instance, some assigned values to the fields such as age or work experience were unidentified and missed. Format of some fields such as time of accident occurrence or age had been registered incorrectly or had not been entered at all. In the next phase, some fields such as age, work experience, education degree and wasted times (rest duration) have been converted to categorical fields. In the last phase, using Min-Max normalization function as a linear convert method, interval fields have been normalized and have been mapped to [0, 1] interval.
3-4- Modeling Stage
In this stage, according to the research model, K-Means algorithm has been primarily used as a surface mining tool to cluster the data. Considering the fields selected in data understanding stage, data has been clustered. By studying the importance of the selected fields, it has been realized that almost all the selected fields have high importance degrees equal to 1, except the time of accident occurrence which has a very low importance degree (0.14) in comparison with other selected fields.
It should be mentioned that this field has not been considered in the next phase due to lack of acceptable importance degree. According to figure 2, the selected fields of the research problem have been clustered and the amounts of eight clusters have been determined as optimum numbers of clusters based on Dunn index’s maximum value.
Fig.2. The Procedure of Dunn Index’s Change Based on Clustering.
All information and existing features in each of the eight clusters have been provided in the Table 1. As shown, the data of each cluster illustrates a high degree of dependency of the assigned records to their own clusters. This dependency has the
11 10 9 8 7 6 5 4 3 2 0.80 0.75 0.70 0.65 0.60
Cluster number
Du
nn
In
de
x MA PEMA D 6.369920.04303 MSD 0.00301 A ccuracy Measures A ctual Fits Variable
Trend Analysis Plot for Dunn Index Linear Trend Model Yt = 0.6786 - 0.002370*t
highest degree in some assigned fields in each cluster. This is described in the next section.
Table1. Information and existing features in each of the eight clusters. How Accident Occurred Outcome of Accident Manufacturing saloon Cause Organ Education level Age Work Experience
Rest Duration Injury Intensity
Fields and Cluster Number
Being Stuck between two Objects 30.19% strike injury 97.06% Body 20.96%
unsafe act (person) 70.86% hand 91.19% diploma 95.6% young 0.19 Low 0.269 Medium Intensity
19.25 1
Sliding 44.15% strike injury 53.96% color 18.49%
unsafe act (person) 87.92% Foot 97.36% diploma 94.34% young 0.19 low 0.281
Medium Intensity
22.03 2
Crash with Barriers 41.2%
Wound 94.85%
Body 37.34%
Unsafe act (person) 62.66% hand 75.11% diploma 85.41% young 0.2 Low 0.29 Low Intensity 11.82 3
Crash with Barriers 20.49%
wound 94.26%
Body 100%
Unsafe act (person) 53.28% hand 79.51% diploma 95.08% young 0.16 low 0.24
Low Intensity
15.83 4
Being Cut with Sharp Surface 100% Wound 99.39% Press shop 42.12%
Unsafe act (person) 92.12% Hand 93.03% diploma 84.24% young 0.21 Low 0.29
Low Intensity
12.34 5 Sliding 22% strike injury 76.5% Body 31.5%
Unsafe act (person) 66% foot 48.5% School education 95.5% Middle age 0.366 Medium 0.46
Low Intensity
21.75 6
Crash with Lift Truck 16.06%
strike injury 95.87%
assembling 25.23%
unsafe act (others) 39.91% foot 68.35% diploma 96.33% young 0.18 low 0.26
Medium Intensity
22.95 7 Flying Particles 77.98% wound 88.07% Body 33.94%
Unsafe act (person) 53.21% abdomen 100% Diploma 74.31% young 0.23 Low 0.32
Very low Intensity
According to the research model, after determining optimum number of clusters and assigning the data of each eight clusters, association rules have been discovered by means of Apriori algorithm on the data of the clusters. First, antecedent and consequent fields have been selected among all fields and then association rules have been discovered which represent relations and interactions between fields. According to Table 2, some association rules extracted from inside the clusters have been mentioned.
Table 2. Some of discovered association rules from inside the eight clusters.
Lift Index Confidence Index Support Index Antecedent Consequent 1.06% 100% 26.23%
Age group 20 to 25 Diploma Low work experience Personal unsafe action
Injury
1.13% 100%
20.18%
Age group 20 to 25 Diploma Low work experience
Flying particles
Injury
1.06% 100%
10.65%
Age group 20 to 25 Diploma Low work experience
Crash with barriers
Injury
1.02% 100%
10.65%
Being stuck between two objects Personal unsafe action
Leg
1.25% 100%
10.65%
Low work experience Diploma Cutting with sharp surfaces
Hand
1.13% 100%
10.09%
Diploma Medium work experience
Flying particles Abdomen 1.13% 100% 10.09% Diploma Low work experience
Flying particles Unsafe environmental condition
Injury
1.06% 100%
18.85%
Age group 20 to 25 Diploma Low work experience
Winter season
Injury
15.5% 100%
0.36%
Medium work experience Falling from height Technical deficiency
paint Saloon
15.5% 100%
0.26%
Lower than diploma education level Falling from height Technical deficiency paint Saloon 10.56% 100% 0.15% Summer season hit by lift truck Other’s unsafe action
Assemblage Saloon 16.28% 100% 1.02% Body saloon Flying particles Personal unsafe action
Abdomen
1.85% 100%
4.15%
Low work experience Diploma Age group 20 to 25
Foot Personal unsafe action
hit by barriers
3-5-Evaluation and deployment
As shown in Table 1, 1954 records of 7 manufacturing saloons have been clustered by means of K-Means algorithm and then eight clusters have been determined as optimum number by evaluating Dunn index. In this section information inside in each cluster has been described:
Cluster 1: 477 records belong to cluster 1. The members of this cluster have little work experience, are young and have diploma as education level. About %91.9 of injured organs are hands and the average of the rest duration is 19.25 days and in fact, accident intensity is medium. About %21 of the accidents have occurred in body saloon 2. Among 6 causes of accidents, %71are personal unsafe actions. %31 is being stuck between equipment among different states of how accident occurred. Finally, %97.6 is hit injuries among 7 states of accidents’ outcome.
Cluster 2: It has 256 records. One of its features is that %97.36 of the”organ” field are legs and %44.15 of the “how accident occurred” field are sliding.
Cluster 3: It has 233 records. %41.2 of the “how accident occurred” field are hit by barrier. %94.85 of the “outcome of the accident” is injury.
Cluster 4: It has 122 records. %100 of accidents belongs to the body saloon 2. %94.26 of the “outcome of accident” is injury.
Cluster 5: It has 330 records. %42.12 of accidents has occurred in the press saloon. %100 of states is “being cut by sharp surfaces” and %99.39 of the “outcome of the accident” is injury.
Cluster 6: 200 records belong to cluster six. Most of injured workers have medium work experience, are middle-aged and have an education level lower than high school diploma. %31.5 of the accidents belongs to the saloon 1 and %76.5 of the outcomes is hit injuries.
Cluster 7: It has 218 records. Unlike all other clusters, the major cause of accident is other’s unsafe actions or in fact, caused by drivers of lift trucks and tugs. The highest degree of accident intensity of all clusters belongs to this cluster with the average of 22.92 days. The common state of “how accident occurred”: is hit by lift truck and tug and common outcome of accident is hit injuries.
Cluster 8: 109 records belong to cluster eight. %100 of organ field is abdomen. %77.98 of the states of: “how accident occurred” field: are flying particles and common outcome of the accident is injury.
In the next phase of the research, information inside each of 8 clusters have been separated from other information, and by means of Apriori algorithm association rules have been discovered and the relations between the fields of the research problem have been studied.
In order to select more useful and efficient rules among large number of discovered association rules, it is necessary to use confidence and lift indexes.
As stated previously, confidence index implies simultaneous occurrence of antecedent and consequent fields, and lift index with values higher than 1 shows positive correlation between antecedent and consequent. We have tried to provide the desired rules in this article considering the mentioned indexes.
According to Table 2, injury is the outcome of accidents among young workers who are from 20 to 25 and with little experience, occurred in states such as flying particles and hit by barriers and caused by unsafe environmental conditions and personal unsafe actions.
Furthermore, accidents among the workers with medium work experience and an education level lower than diploma have totally occurred as falling from height in color saloon 1and have been caused by technical deficiency.
By the way, all the accidents leading to workers’ hit by lift truck, caused by other’s unsafe actions (lift truck drivers), have occurred in summer, and have occurred in assemblage saloon two.
Finally, accidents occurred among workers with diploma as education level and with medium work experience caused by flying particles have led to injuries in the worker’s abdomen.
4. Conclusion
This is a fact that existence of stochastic and non-deterministic states in risk and accident fields has made decision making process so complicated for managers especially for choosing corrective actions and control methods.
In this research, we have tried to introduce the application of data mining so as to design a decision support system (DSS) in the format of a methodology for managers. In this methodology, considering selected features of dataset and using clustering method, similar accidents have been clustered in various clusters, and that has led to identification of frequent accidents. In the next stage, information inside the clusters have been studied more elaborately and the appropriate association rules with %100 confidence as well as lift index higher than 1 have been discovered. As shown in the results, a considerable portion of accidents have occurred among young workers graduated from high school, who have been between 20-25 and with little experience (less than 2 years), as well as workers with medium work experience between 3-8 years and lower education level.
According to the obtained results, major cause of most accidents is personal unsafe actions of workers. Other’s unsafe actions (lift truck drivers), unsafe environmental conditions as well as technical deficiency have been identified as major factors in the hitting of workers by transport equipment such as lift truck.
Major factors in all accidents have been recognized as hitting by barriers, being sucked between machines, being cut by sharp objects, flying particles falling from high surfaces and hit by lift truck.
Major causes of accidents have been are the lack of correct training or undesired quality of personnel training system as well as not paying attention to effects of maintenance and repair process of equipment and machines, lack of continuous check of factory environment and work stations done in order to eliminate risk and accident focuses.
Falling from height can be prevented if ladders and stairs of the factory are continuously checked and if personnel are trained how to use personal protective equipment and how to work correctly.
The major causes of being hit by lift truck in factory workspace are ignoring safety principles, overloading of lift truck leading to lack of vision for driver as well as over-speeding of lift truck in manufacturing saloons. All these are resulted due to inadequate training for personnel, lack of checking and monitoring on industrial operation procedure and workers’ actions in manufacturing saloons.
Being hit by barriers and stuck between equipment and machines, as well as being cut by sharp objects and flying particles represent the lack of using personal protective equipment, ignoring safety principles, insufficient safety training, and ineffectiveness of alert signs in factory workspace.
Frequency of accidents inside each of eight clusters is a source for prediction of future accidents. It seems that if an appropriate label or a proper index is selected for each cluster, identification and prevention of accidents will be much more convenient. This may be considered for future studies. For instance, high frequency of strike injury of legs in cluster 2 caused by sliding in color saloon, strike injury of legs in cluster 7 caused by hit by lift truck, and tug in assemblage saloon, as well as abdomen injury in cluster 8 caused by flying particles in body saloon, help managers to prevent re-occurrence of accidents by considering results of data mining and discovered association rules and assist them to select more suitable control approaches and corrective actions.
References
Ale, B.J.M., Baksteen, H., Bellamy, L.J., Bloemhof, A., Goossens, L.G., Hale, A., Mud, M.L., OH, J.I.H., Papaszoglou, I.A., Rost, J., Whiston, J.Y., 2008, Quantifying occupational risk: The development of an occupational risk model,
Safety Science, 46, 176-185.
Aneziris, O.N., Papazoglou, I.A., Mud, M.L., Damen, M., Kuiper, J., Baksteen, H., Ale, B.J., Bellamy, L.J., Hale, A.R., Bloemhoff, A., Post, J.G., Oh, J. 2008. Towards risk assessment for crane activities, Safety science, 46,872-884. Aneziris, O.N., Papazoglou, I.A., Mud, M.L., Baksteen, M.H., Ale, B.J., Bellamy, L.J., Hale, A.R., Bloemhoff, A., Post, J.G., Oh, J., 2008. Qualified risk assessment for fall from height, Safety science, 46,198-220.
Buldu, A., Mucgun, K., 2010, Data mining application on student's data, Procedia social & Behavioral sciences, 2, 5251-5259.
Canadian center for Occupational Health and Safety (CCOHS,), 2006, Accident Investigation, 1-10.International Labor Organization (ILO), 2005.
Cheng, C.W., Lin, C.C., Leu, S.S., 2010, Use of association rules to explore cause– effect relationship in occupational accidents in the Taiwan construction industry,
Safety Science, 48, 436-444.
Cheng, C.W., Leu, S.S., Cheng, Y.M., Wu, T.C., Lin, C.C., 2012, Applying data mining techniques to explore factors contributing to occupational injuries in Taiwan’s construction industry, Accident analysis and prevention, 48, 214-222.
Cheng, C.W., Yao, H.Q., Wu, T.C., 2013, Applying data mining techniques to analyze the causes of major occupational accidents in the petrochemical industry,
Loss Prevention in the Process Industries, 26, 1269-1278.
Cheng, Y., Yu, W.d., Li, Qiming., 2015, GA‐based multi-level association rule
mining approach for defect analysis in the construction industry, Automation in Construction, 51, 78-91.
Emre gurcanli, G., Mungen, U., 2009. An occupational safety risk analysis method at construction site using fuzzy sets, Industrial Ergonomics, 39, 371-387.
Gunter, S., Bunke, H.T., 2003, Validation indices for graph clustering, Pattern Recognition, 24, 1107-1113.
Grassi,A., Gamberini, R., Mora, C., Rimini, b., 2009. A fuzzy multi-attribute model for risk evaluation in workplaces, safety science, 47, 707-716.
Gurrutxaga, I., Muguerza, J., Arbelaitz, O., Perez, J.M., Martin, J.I., 2011, Towards a standard methodology to evaluate internal cluster validity indices, Pattern Recognition, 32, 505-515.
Han, J., Data Mining: Concept and Techniques, second Edition, 2006.
Liao, C.W., Perng, Y.H., 2008, Data mining for occupational injuries in the Taiwan construction industry, Safety Science, 46, 1091-1102.
Liang, Y.H., 2010, Integration of Data mining techniques to analysis customer value for the automotive maintenance industry, Expert systems with Applications, 37, 7489- 7496.
Lluís, S., Josep M. R., Carla, V., 2015,Study of Spanish mining accidents using data
mining techniques, Safety Science, 75, 49-55.
Mure, S., Demichela, M., 2009, Fuzzy Application procedure (FAP) for the risk assessment of occupational accidents, loss prevention in the process industries, 22, 593-599.
Mirabadi, A., Sharifian, S., 2010, Application of Association rules in Iranian Railways (RAI) accident data analysis, Safety Science, 1427-1435.
Nait-Said, R., Zidani, F., Ouzraoui, N., 2009. Modified risk graph method using fuzzy rule – based approach, Hazardous Materials, 64 651-658.
Ngai, E.W.T., Xiu, L., Chau, D.C., 2009, Application of Data mining techniques in customer relation management: A literature review and classification, Expert systems with applications, 36, 2592-2602.
Nenonen, N., 2013, Analyzing factors related to slipping, stumbling, and falling accidents at work: Application of data mining methods to Finnish occupational accidents and Diseases statistics database, Applied Ergonomics, 44, 215-224.
Pakhira, M.K., Bandyopadhyay, S., Maulik, U., 2004, Validity index for crisp and fuzzy clusters, Pattern Recognition, 37,487-501.
Reniers, G.L.L., Dollaret, D., Ale, B.J.M., Soudan, K., 2005, Developing an external domino accident prevention framework: HAZWIM, Journal of Loss Prevention, Loss Prevention in the process industries, 18, 127-138.
Rad, A., Naderi, B., Soltani,. M., 2011.,Clustering and ranking university majors using data mining and AHP algorithms: A case study in Iran, Expert systems with Application, 38, 755-763.
Rivas, T., Paz, M., Martın, J.E., Matıas, J.M., Garcıa, J.F., Taboada, J., 2011., Explaining and predicting workplace accidents using data-mining techniques,
Rizman Zalik, K., Zalik, B., 2011, Validity index for cluster of different sizes and densities, Pattern Recognition, 32, 221-234.
Sari, M., Sevtap Selcuk, A., Karpuz, C., Sebnem, H., Duzgun, B., 2009,Stochastic modeling of accident risks associated with an underground coal mine in Turkey,
Safety Science, 4, 778 – 87.
The causes and incidence of occupational accidents and ill-health across the globe (BSC) copy right, 1-40, 2009.
Verma,A., Das Khan, S., Maiti, J.,rishna, O.B., Identifying patterns of safety related
incidents in a steel plant using association rule mining of incident investigation reports,Safety Science, 70, 89-98.
Wang, W., Y. Zhang, Y., 2007, On fuzzy cluster validity indices, Fuzzy Sets and Systems, 158, 2095-2117.
Zheng, X., Liu, M., 2009, An overview of accident forecasting methodologies, Loss Prevention in the process Industries, 22,484-491.
Zhang, D., Jiang, K, 2012, Application of Data Mining Techniques in the Analysis of Fire Incidents, , 43,250-256.