Autumn 2014
Balanced clusters and diffusion process in signed networks
Maryam Ehsani, Mohammad Mehdi Sepehri*
1Department of Industrial Engineering, Tarbiat Modares University,Department of Industrial Engineering, Tehran, Iran.
[email protected], [email protected]
Abstract
In this paper we study the topology effects on diffusion process in signed networks. Considering a simple threshold model for diffusion process, it is extended to signed networks and some appropriate definitions are proposed. This model is a basic model that could be extended and applied in analyzing dynamics of many real phenomena such as opinion forming or innovation diffusion in social networks. Studying the model declares that highly balanced dense clusters act as obstacles to diffusion process. This fact is verified by numerical simulations and it is declared that balanced dense clusters limit perturbation diffusion and the rest time. In other words the systems with more compatible communities and balanced clusters act more robust against perturbations. Moreover, the final state majority would be the same of more balanced cluster initially. These structural properties could be useful in analyzing and controlling diffusion process in systems.
Keywords: Social networks, Innovation diffusion, Balanced clusters, Signed network
1- Introduction
There are many systems in various area in which agents update their states based on their interactions with each other. For instance in a distributed decision network, nodes as distinct agents or decision makers, revise their decisions based on interactions with the other agents.
We can also refer to vast issues in opinion dynamics field, such as information cascade, spreading rumors or disease and innovation diffusion in a social network. In general, in these processes every agent updates its state in time due to interactions with the other elements. The node's state may represent positive or negative opinion or decision to an idea, to buy or not to buy a product, to catch or not to catch a disease and so on. According to specific situations, various models are proposed in different subjects, and as an example a brief review can be found in ( Castellano, Fortunata and Lorento, 2009). How network dynamics is affected by topology or network structure is an interesting issue that would be useful in analysis and control of different systems' behavior, for example ((Balakin, Martìnez and Martìnez, 2011), (Zhou and Lipowski, 2008),(Delre,Jager and Janssen,
*
Corresponding Author
2007),(Rahmandad and Sterman,2008),(Lyst, Kacperski and Schweizer, 2002),(Alcàntara and Rey,2012),(Li-sheng etal,2014) and (Sirinvasan and Chakraborty,2014))
Diffusion process in this context refers to a phenomenon like spreading new behaviors, opinions or innovations through a social network due to agents' interactions. Among many models explaining this process, we concentrate on a simple threshold model explained in (Easely and Kleiberg, 2010), which could be extended and applied in many situations. The model assume a network initially with all its nodes in state A and some initial adopters change their state to state B in step 0. A node switches from A to B if at least a specific fraction of its neighbors are in state B. In every time step some nodes change their states until the diffusion process stops or a complete cascade occurs. The conditions for complete cascade or blocking the progress are explained in (Easely and Kleiberg, 2010).
In the above mentioned network model the links represent only positive influence. However there are situations in which the relationships imply positive or negative effects. This concept leads to signed graph model. So the model is extended to signed networks in this paper. Structural balance theory in signed graph sketches graph structure from a different point of view. In this perspective, we examine the effects of communities and balanced clusters on diffusion and perturbation process in networks.
In the following, a brief review on the related theories and the model is given. Then in section 3, the extension of threshold model to signed graph and some definitions are presented. Effects of balanced clusters on diffusion process are investigated in section 4 and simulation scenario and some results are given there.
2- Theoretical background: a brief review
2-1-
Diffusion process and a simple threshold model
As it mentioned, diffusion process in the context of social networks, refers to phenomena like spreading new behaviors, opinions or innovations through a network as people influence each other to adopt new ideas. How the progress is modeled and what factors facilitate or block the progress are the main questions of studies in this research field, for instance ((Valente, 1995), (Peres, Muller and Mahajan,2010), (Nematzadeh et al.(2014), Malandrino et al.,2012) and (
Deroı̈an, 2012))
. Network models emphasize the role of local relations in individuals' choices aligning with their neighbors that leads to global effects. Here we explain briefly a threshold model described in (Easely and Kleiberg, 2010) as a basic model could be extended and applied to many real- world systems.At first let's consider a network, initially all of its nodes are in the state A, say 1. At the first step (time t0) some of nodes, named initial adopters, change their states to B, say -1. If the fraction of neighbors of node i that are in different state is more than a specific threshold, named q, node i changes its state to B. It can be proved that if a node changes its state from A to B at a time step, it is not possible to switch back to A at a later point. So the number of nodes in state B is monotonically increasing. In every time step some nodes change their states until the diffusion process stops or a complete cascade occurs.
Studying necessary and sufficient conditions for a complete cascade, Easley et al (2010) define: Cluster of density p as the set of nodes such that for each node at least a p fraction of its neighbors are member of the set. Based on this definition, the same reference proves a claim that a set of initial adopter result to a complete cascade iff the remaining network contains no cluster of density greater than(1−q). So, dense communities act as only obstacles to the diffusion process.
2-2- Signed graphs and structural balance theory
In many network models, the connections demonstrate positive types of influence, for example friendship or collaboration in a social network can be considered as positive relationships. However a connection between components in many systems implies negative or positive effect, such as friendship or enmity in social networks, activation or inhibition in neural networks or Gene Regulatory Networks and so on. This concept could be represented by signing connections in networks and results signed graphs.
Originated by Hieder works in psychology (Heider,1946), a triad (triple clique) in a signed graph is called balanced, if the product of its three edges' signs is positive, else it is considered an unbalanced triad. If there is no unbalanced triad in a signed graph, it is called a structural balanced graph. Cartwright and Harary (1956) formulated and extended this theory to graphs in their works. They proved a graph is structural balanced if either all the edges' signs are positive, or the set of vertices can be partitioned into two clusters (or plus sets) such that every edge between vertices of the same cluster has positive sign and every edge between two different clusters has negative sign. It is proved also that condition is equal to being no cycle with odd number of negative signed edges in the graph. This is also true for directed signed graph considering cycles disregarding arcs' directions.
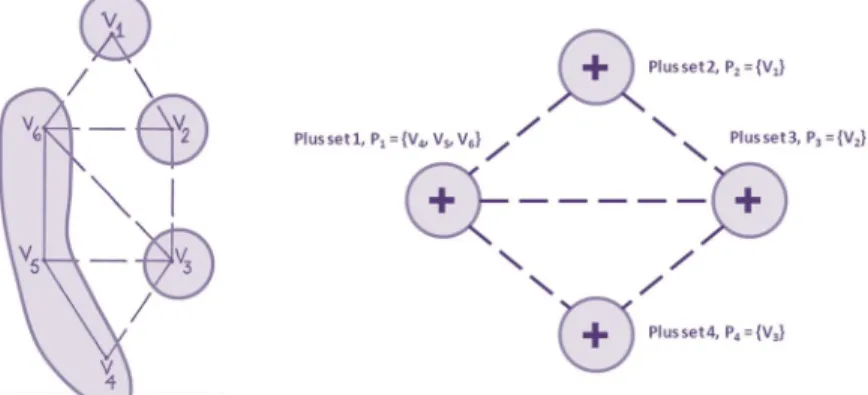
Later Davis generalized the concept of balance by including triads with three negative edges' signs and just excluding triads having exactly one edge of negative sign ( Davis, 1967). In Davis definition, the graphs with no cycle having exactly one edge of negative sign are considered as clusterable and it is proved that in this condition the set of vertices can be divided into some clusters such that every edge between vertices of the same cluster has positive sign and edges between vertices of two different clusters have negative signs (Figure 1).
Figure 1. Weak form of structural balance in Davis definition. A clusterable network can be partitioned into
some clusters with only positive connections inside clusters and only negative connections between clusters. Note: The underlying network on the left side of the figure is taken from (Davis, 1967)
Now considering two possible states for every vertex in the graph, some other concepts and definitions arise. These two alternative states correspond to 1 and -1 are called spin which borrowed from statistical mechanics terminology. A spin assignment ∑ for a graph assigns a spin to each vertex.
Considering an edge between vertices i,j with spins σi and σj and sign aij, the edge is called satisfied or consistent if σi*σj*aij =1 , else it is called frustrated (Sontag,2007). A graph is consistent respect to a spin assignment ∑, if there is no frustrated edge in graph. It can be proved that there is a consistent assignment for a graph iff the graph is balanced, that means there is no cycle with an even number of negative edge in it. On this condition, a graph is either all positive signed or it can be partitioned into two plus sets. In the latter case, there are exactly two consistent spin assignments for the graph, positive spin for the first plus set and negative for the second, or vice versa. There are 2n possible spin assignments and so even in the case of a balanced structure, the other spin assignments cause frustrated edges in the graph.
Every 2n spin assignments possible for a graph that differs from balance, leads to a number of frustrated edges. The minimum number of frustrated edges that is possible for a graph is called frustration index and somehow measures difference between the graph structure and structural balance situation.
3- Diffusion process in signed graphs
Spread, block or cascade in phenomena like opinion forming and innovation diffusion is affected by the type and structure of relations between system's agents. The model mentioned in 2-1 considers only positive type of influence between the nodes. However in many situations we face to either positive or negative relations in networks. For example, the relations between political parties in a society or relations between countries can be modeled by signed networks. Also, we can mention competition or cooperation relationship between companies in a market or economical network. As another example the relationships as foe or friend in some online social networks could be considered. How a new behavior or a new product spreads thorough the network and how the sign pattern affect diffusion process, are the focal questions in this paper. For instance we try to propose a method for analyzing and predicting the final partitioning in a market adopting or rejecting a new product or innovation. based on this model and concepts it would be possible to redesign and manipulate the network or rearrange the initial adopters in order to an innovation or a new idea or a new behavior spreads thorough the network or quarantined in a limited group and vanishes in time. Here we consider the diffusion of a new behavior through a signed network and extend the model mentioned in 2-1 and its definitions. Again let's assume a two – value state possible for each node, named A and B. Every node updates its state based on neighbors' decision, but its neighbors have positive or negative relationships with it and so influence in opposite directions. To formulate this concept let's assume the node i is in state A and:
n1= the number of its neighbor in the state A with positive sign links
n2= the number of its neighbor in the state B with positive sign links
n4= the number of its neighbor in the state B with negative sign links
A node in state A switches to B if (n2 + n3) is at least a q fraction of its neighbors (Figure 2).
(n2 + n3) > q ∗ (n1 + n2 + n3 + n4) (1)
Figure 2. Node i switches to B if (n2 + n3) > q ∗ (n1 + n2 + n3 + n4)
We can represent state A with 1 and state B with -1. Then for any signed link multiplication of states of two corresponding nodes and its sign will be equal to 1 or -1. According to definitions of satisfied and frustrated edge in sec 2-2, this rule of update could be restated: a node in state A changes its state if at least a q fraction of its links are frustrated. In fact a node revises its state to achieve a better consistency with its neighbors. For example in a two- polar system, a country modifies its political decisions in foreign relationships such that it aligns with its political partners against its enemies.
This process goes over time until a complete cascade occurs or the diffusion process stops. This is indicated in the example 1 (Fig. 3).
Figure 3. Starting with the nodes 1 and 2 as the initial adopters, and q=2/3, the new behavior B spreads to
Two situations corresponding to all of nodes in state A or all of nodes in state B are not necessarily equilibrium states. However it could be considered as an initial state that all of nodes are in state A as a unique default behavior and some initial adopters switch to state B in time step 0, as the new behavior or innovation advents. In correspondence with the model explained in sec 2-1 we consider this change in behavior or adoption a new innovation as a non-reversible process. That means if a node adopts B, it would ever switch back to A. In other words, every node can change its state no more than once. This condition is logical for many real cases, in fact an individual may change its decision on a unique subject only one time. However this is not true for all situations and if we omit this extra condition, the process would be similar to Local Majority Rule (LMR). LMR is a basic model for explaining dynamics of such interconnected system, based on a simple interaction rule. It is assumed that every component in the system can have one of the two possible states and update its state according to the majority state of its neighbors. Dynamics of LMR model clarifies how the global behavior of a system can be demonstrated by a simple local interaction rule (Mustafa and Pekeč, 2001)
According to the above assumptions, as time moves forward, the size of B adopters' set increases monotonically. For the sake of simplicity of further discussion, let's define the following notations for vertices of the cluster, considering a specific cluster:
- deg+in for a vertex: refers to the number of its internal positive connections that means the number of its neighbors in the cluster with positive connection.
- deg+out for a vertex: refers to the number of its positive connections with the neighbors aren't members of the cluster
- deg-in for a vertex : refers to the number of its negative internal connections
- deg-out for a vertex: refers to the number of its negative connections with the neighbors aren't members of the cluster
We name the set of all nodes with state B in each step t, Nt, and the complementary set of nodes with the state A in the time step t, N't. Based on the mentioned update rule, a vertex i in N't changes its state if:
deg−in(i) + deg + out(i) > (q/(1−q))∗(deg + in(i) + deg−out(i)) (2)
Corresponding to the model in section 2-1, we define cluster of consistency p as the set of nodes such that for each node the number of positive internal connections plus the number of negative external connections is at least a fraction p of its connections (Figure 3). According to the update rule, when N't has consistency greater than 1-q, the diffusion process would stop, otherwise the diffusion process progresses monotonically. In other words, consistent clusters (the set of nodes with positive relations with each other and negative relations with others) act as obstacle to diffusion process.
Figure 4. Cluster of consistency p: for every node in the cluster; the number of positive internal connections plus the number of negative external connections is at least a fraction p of its connections: deg + in(i) +
deg−out(i) > deg(i)
This fact could be seen in example 1. The spreads in the network until it meets a cluster of consistency equal to 2/3. In fact the obstacle cluster in this example is the nodes set : {5, 6, 7}. In this cluster we have:
deg−in(5) + deg + out(5)/(deg(5)) = 3/3 = 1 (3)
deg−in(6) + deg + out(6)/(deg(6)) = 3/3 = 1 (4)
deg−in(7) + deg + out(7)/(deg(7)) = 2/3 (5)
and so it is a cluster of consistency 2/3 . Thus we have: p = 2/3 and 1−q = 1/3 p > (1− q).we see this cluster blocks diffusion process.
As it will be stated in the next section, a balanced community means a dense community which most of its internal connections are positive, and so it is typically a cluster of high consistency. Therefore the above discussion declares that balanced communities decrease spreading rate of diffusion and act as obstacles to the process. This fact is verified with simulation and the results are given in the next section.
The role of balanced communities in blocking diffusion process in networks could also illustrated by the role of strong ties in networks. As it mentioned, real complex networks have a clusterable structure typically. Granovetter showed in his celebrated work that the connections between the clusters in a social network are weaker than internal connections and these weaker connections are exactly the same that have an important role in spread processes in the network (Granovetter, 1973) From another viewpoint, our discussion in signed networks clarifies that these strong internal connections are typically positive connections and have a worthless role in spreading information or diffusing a perturbation in the network. Results of a recent study (Karsai, Perra and Vespignani, 2014) on some data sets of social networks confirm our conclusion and restate the weakness of strong ties in spreading information.
4- Effects of balance cluster on diffusion process and simulation results
Communities as density based clusters are assumed to be important structure units in systems' function and behavior. Communities simply refer to somewhat cohesive sub graphs based on graph relations, as groups discriminating from each other by dense internal connections and sparse connections together. Considering a structure composed of communities, we notice connections inside communities is denser than connection between different groups. In fact, this type of clustered structure is a typical structure naturally arises in various types of real complex networks such as biological networks or social networks.
However, in systems with signed graph networks, we face to another structural units derived by balanced clustering approach. The latter is based on cluster concept in Davis definition of weak structural balance that mentioned in section 2-2. The objective in balanced partitioning approach, is dividing graph into some clusters such that the connections inside a cluster would be positive and the connections between two different clusters would be negative as much as possible. When a graph is balanced, or clusterable in the sense of Davis definition, it could be partitioned into some clusters such that no error sign there exists (no connection with negative sign inside a cluster and no connection with positive sign between two different clusters). The more the structure is far from balance, the greater the number of error connections would be.
Two mentioned approaches for graph partitioning, cast networks in two patterns: communities and balanced clusters. Effect of compatibility between these two patterns on diffusion process in systems, is the focal question of this paper. As discussed in section 3, balanced dense clusters decrease spreading rate of diffusion and act as obstacles to the process. This clarifies the role of dense communities with mostly positive internal relation in diffusion process. In fact the denser and more balanced the communities are, the lower is the effect of a perturbation in the whole system.
It also should be noticed that vertices with greater fraction of frustrated connections are more exposed to change and the diffusion spreads through these vertices and frustrated connections between adopters' set and remaining network. This leads to important role of positive connections between different clusters as mediators and channels for diffusion process. Considering two balanced partition, since most of vertices in a partition in equilibrium have the same sign, frustrated connections between two partitions are mostly of positive sign. Hence these positive connections imitate bridge role in transmissions in signed graphs.
For studying the effects of balanced communities on perturbation diffusion by simulation, we generated many random small –world network samples with different values of clustering coefficient. Partitioning the networks to communities and signing the graph in different balance levels on average, perturbations applied to a community in the network and the rest time and corresponding diffusion range are traced.
Here we briefly explain some necessary definitions and details about simulation scenario.
Clustering coefficient is a useful graph metrics which measures the nodes tendency to form clusters (communities) and is given for any vertex by:
Ei is the number of connections between neighbors of vertex i and ki is the degree of vertex i and so ∗( −1)/2 is the number of connections could be between the neighbors. So Ci represents the ratio of the number of connections between neighbors of vertex i to the number of connections could be between them. Clustering coefficient of network is the average of Ci.
Small world networks have two basic structural properties: high clustering coefficient and low average shortest path. We chose small world networks in this study because highly clustered structures with small average shortest path arise in many real complex networks. Watts and Strogatz (1998) proposed the first model for generating small world networks by interpolating between random graph and one dimensional regular lattice.
We used Pajek 3.13 for generating numerous random samples of small- world networks of size 1000 vertices with different parameters ( , p)which leads to different clustering coefficient. refers to the number of neighbors for every node in each side in the regular lattice and p refers to the probability of rewiring in the graph. =5 results constant graph density with average degree equal to 10, and with p = 0.05, p = 0.2 and p = 0.5for network samples, the average network clustering coefficients respectively would be equal to: 0.58, 0.34 and 0.09.
For community detection, Louvain method in Pajek was used and the resolution parameter was set such that the number of communities would be about 10. Then every network sample signed such that the fraction of positive connections inside every cluster and negative connections between every two different clusters would be 50%, 80%, 85%, 90%, 95%on average. Initially the state of all nodes was set to A and a perturbation equal to 10% nodes in a community was applied. Running signed threshold model explained in section 3 with different threshold value: q=0.3 to q=0.8, diffusion range of the perturbation (the number of vertices changed to state B finally) and rest time (the number of time steps till the network reaches final state) was determined. Some simulation results are given in table 1.
Table1. the ordered pairs (a,b) in tables refer to (the mean value of the number of B-state nodes finally, mean value of the number of time steps till equilibrium): the rest time in the specified threshold(q) and the fraction of positive internal connections(balance level in clusters). (corresponding to rewiring parameter: 0.5 and 0.05 in small -world network generation).
Table 1.a. Simuation results (mean value of clustering coefficient=0.09)
50% 80% 85% 90%
q=0.3 (1000,4) (1000,5) (1000,5) (1000,5) q=0.4 (1000,9) (1000,13) (980,11) (950,12) q=0.5 (550,9) (475,9) (450,9) (440,9) q=0.6 (300,6) (230,7) (225,7) (200,7) q=0.7 (120,5) (70,5) (70,5) (58,5) q=0.8 (30,4) (20,3) (20,3) (20,3)
Table 1.b. Simuation results (mean value of clustering coefficient=0.58)
50% 80% 85% 90%
q=0.3 (1000,5) (1000,10) (1000,20) (1000,5) q=0.4 (975,9) (350,20) (185,15) (130,20) q=0.5 (530,6) (60,7) (35,5) (25,6) q=0.6 (260,5) (25,5) (22,4) (21,4) q=0.7 (100,4) (20,4) (20,3) (22,3) q=0.8 (70,4) (20,4) (20,3) (21,3)
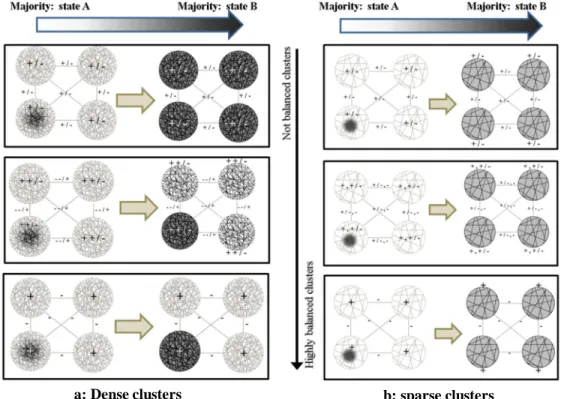
As simulation results show, in the networks with a random signing pattern (50% of connections are signed positive and the others are signed negative at random), a perturbation diffuse thorough the whole network but when communities are biased to balanced clusters, the range of perturbation diffusion reduces significantly for the same threshold value. In the networks with higher clustering coefficients, perturbations diffuse in a more limited range. This fact is schematically shown in Fig. 4.
Figure 5. The effect of balance level on diffusion range. Initial and final states of diffusion of a perturbation
applied in one cluster.
a :high clustering coefficient, b:low clustering coefficient.
Balance level in clusters increases from up to down: a greater fraction of positive internal connections and negative inter connections.
Darker color represent to greater number of nodes in state B and lighter color refers to greater number of nodes in state A.
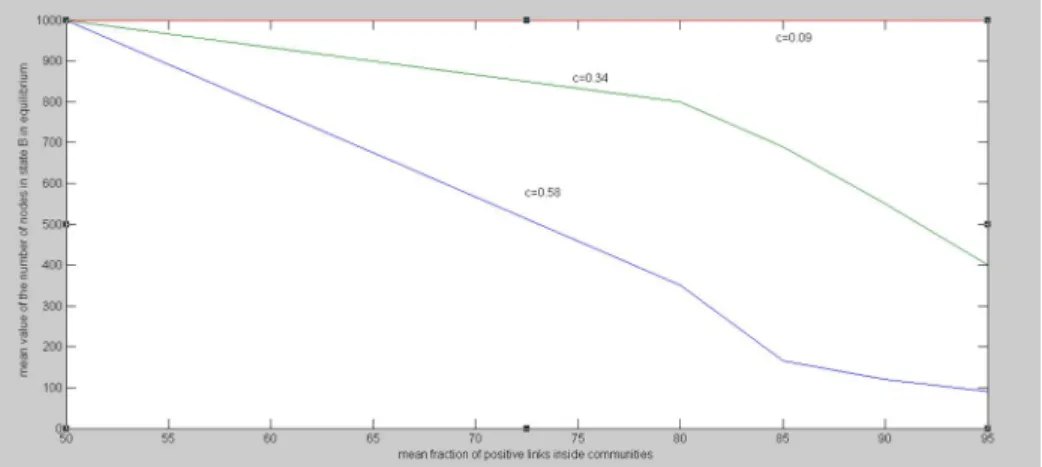
Some simulation results are summarized in Fig.6 and Figure 7. for threshold value =0.4 and 0.5 respectively. As Figure 6 shows, for q=0.4 perturbing 10% of a community results to a complete cascade (all nodes switch to state B finally) when the network signed randomly. Biasing the communities to positive internal connections and negative connections with the other communities causes limitation to progress of perturbation (decreasing the number of B-state nodes finally). This effect depends on the clustering coefficient value. In lower values of clustering coefficient, there aren’t dense communities and so consistent clusters. Increasing the value of clustering coefficient results to denser communities and so biasing these communities to balance situation results to more consistent clusters that block the progress of perturbation. For example in c= 0.58, when communities are signed based on a balanced pattern (95% internal connection signed positive and interface connections signed negative), perturbation in a community diffuse in the range of the same community only and doesn’t progress farther.
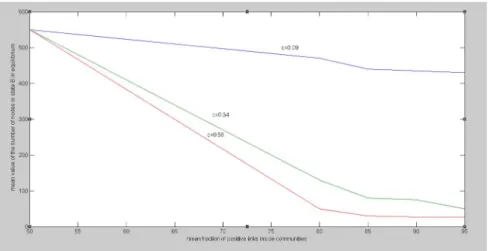
Increasing the threshold causes switching to be harder and more limited. In q=0.5 (Fig.2) the perturbation doesn’t diffuse thorough the entire network and only lower than half of nodes switch to B state finally when the edges are signed randomly. Again it can be noticed that the clustering coefficient value isn’t an effective variable in this situation. But biasing the communities to the balanced situation, the range of perturbation diffusion decreases and this effect is larger in higher values of clustering coefficient. That means diffusion process is limited in a balanced pattern with dense clusters.
Figure 6. Effect of balance level on diffusion range in different clustering coefficients (c). A perturbation equal
to 10% of nodes in community 1 applied in step 0, the plot shows the mean value of nodes in state B finally versus different balance level of communities. Network clustering coefficient (c), represents mean value of network clustering coefficients of 10 small world network with specified (p,k0). Every network signed many times randomly such that mean fraction of positive connections inside communities was tuned on 50%, 80%,
Figure 7. Effect of balance level on diffusion range in different clustering coefficients (c). a perturbation equal to 10% of nodes in community 1 applied in step 0, the plot shows the mean value of nodes in state B finally versus different balance level of communities. Network clustering coefficient (c), represents mean value of network clustering coefficients of 10 small world network with specified (p,k0). Every network signed many times randomly such that mean fraction of positive connections inside communities was tuned on 50%, 80%,
85%, 90% and 95%. (q=0.5)
4-1- Final state and balance level in initial same spin groups
Consider two groups of different states A and B in the initial condition. How balance level of a group in initial condition effects on the state of majority in the final state? In this study we relax the restriction that a node can switch only once. So the rule of update could be stated: a node changes its state if the fraction of its frustrated neighbors is at least equal to a specified threshold. It was clarified by extensive numeric simulations that the final majority of state is likely the same state of more balanced group initially. In these simulations, numerous random Poisson networks were generated and then state and sign assignments were accomplished randomly and so two groups of opposite states were similar together from the point of size and structure. Then edge signs in one group are shifted to a more balanced situation and vice versa for the edge signs in the other group. The results show a little difference (about 5%) between balance levels of two groups in initial conditions, causes the state of more balanced initial group would be most likely the majority state finally. this fact could be very useful in analysis and improvement different systems such that a specified behavior or innovation becomes widespread or out of mode.
5- Summary and conclusion
In this paper we discussed effects of some structural properties on diffusion process in signed networks. We extended a simple threshold model in diffusion process to signed networks and studied how compatibility between density based communities and balanced clusters influence diffusion process. This model could be extended and applied in many real phenomena in various systems such
as spreading new behaviors, opinions or innovations through a network. As simulation results verified too, balanced dense clusters act as obstacles to diffusion process and limit range of its progress in system. In other words these structures cause systems act more robust against perturbations. Moreover, the final state majority would be the same of more balanced cluster initially. So compatibility between communities and balanced partitions in signed networks influences diffusion processes in systems and can be introduced as a useful index in categorizing systems and assessing some properties like transmission capacity and system's robustness.
These findings could be useful in analyzing, designing and control of systems to block or improve progress of new behaviors or opinions through networks. It is also be used in analyzing and ranking the role and importance of different groups and individuals in global behavior.
References
Alcántara, J. M., & Rey, P. J. (2012). Linking topological structure and dynamics in ecological networks. The American Naturalist, 180(2), 186-199.
Balankin, A. S., Martínez Cruz, M. Á., & Martínez, A. T. (2011). Effect of initial concentration and spatial heterogeneity of active agent distribution on opinion dynamics. Physica A: Statistical Mechanics and its Applications, 390(21), 3876-3887.
Cartwright, D., & Harary, F. (1956). Structural balance: a generalization of Heider's theory.
Psychological review, 63(5), 277.
Delre, S. A., Jager, W., & Janssen, M. A. (2007). Diffusion dynamics in small-world networks with heterogeneous consumers. Computational and Mathematical Organization Theory, 13(2), 185-202. Castellano, C., Fortunato, S., & Loreto, V. (2009). Statistical physics of social dynamics. Reviews of modern physics, 81(2), 591.
Deroı̈an, F. (2002). Formation of social networks and diffusion of innovations. Research policy,
31(5), 835-846.
Easley, D., & Kleinberg, J. (2010). Networks, crowds, and markets: Reasoning about a highly connected world. Cambridge University Press.
Granovetter, M. S. (1973). The strength of weak ties. American journal of sociology, 1360-1380. Heider, F. (1946). Attitudes and cognitive organization. The Journal of psychology, 21(1), 107-112. J.A. Davis, Clustering and structural balance in graphs, Human Relations 20 (1967) 181–187.
Karsai, M., Perra, N., & Vespignani, A. (2014). Time varying networks and the weakness of strong ties. Scientific reports, 4.
Li-Sheng, Z., Wei-Feng, G., Gang, H., & Yuan-Yuan, M. (2014). Network dynamics and its relationships to topology and coupling structure in excitable complex networks. Chinese Physics B,
Lyst, J. A. H. O., Kacperski, K., & Schweitzer, F. (2002). Social impact models of opinion dynamics.
Annual reviews of computational physics, 9, 253-273.
Malandrino, F., Kurant, M., Markopoulou, A., Westphal, C., & Kozat, U. C. (2012, March). Proactive seeding for information cascades in cellular networks. In INFOCOM, 2012 Proceedings IEEE (pp. 1719-1727). IEEE.
Mustafa, N. H., & Pekeč, A. (2001). Majority consensus and the local majority rule. In Automata, Languages and Programming (pp. 530-542). Springer Berlin Heidelberg.
Nematzadeh, A., Ferrara, E., Flammini, A., & Ahn, Y. Y. (2014). Optimal Network Modularity for Information Diffusion. Physical review letters, 113(8), 088701.
Peres, R., Muller, E., & Mahajan, V. (2010). Innovation diffusion and new product growth models: A critical review and research directions. International Journal of Research in Marketing, 27(2), 91-106.
Rahmandad, H., & Sterman, J. (2008). Heterogeneity and network structure in the dynamics of diffusion: Comparing agent-based and differential equation models. Management Science, 54(5), 998-1014.
Sontag, E. D. (2007). Monotone and near-monotone biochemical networks. Systems and Synthetic Biology, 1(2), 59-87.
Srinivasan, A. R., & Chakraborty, S. (2014, June). Effect of network topology on the controllability of voter model dynamics using biased nodes. In American Control Conference (ACC), 2014 (pp. 2096-2101). IEEE.
Valente, T. W. (1995). Network models of the diffusion of innovations (Vol. 2, No. 2). Cresskill, NJ: Hampton Press.
Watts, D. J., & Strogatz, S. H. (1998). Collective dynamics of ‘small-world’networks. nature,
393(6684), 440-442.
Zhou, H., & Lipowsky, R. (2007). Activity patterns on random scale-free networks: Global dynamics arising from local majority rules. Journal of Statistical Mechanics: Theory and Experiment, 2007(01), P01009.