OIL EXTRACTION AND INDIGENOUS LIVELIHOODS IN THE NORTHERN ECUADORIAN AMAZON
Matthew Bozigar
A master’s thesis submitted to the faculty at the University of North Carolina at Chapel Hill in partial fulfillment of the requirements for the degree of Master of Arts in the
Department of Geography.
Chapel Hill 2014
Approved by:
Clark Gray
Xiaodong Chen
Richard Bilsborrow
© 2014 Matthew Bozigar ALL RIGHTS RESERVED
ABSTRACT
Matthew Bozigar: Oil Extraction and Indigenous Livelihoods in the Northern Ecuadorian Amazon
(Under the direction of Clark Gray)
Since oil was discovered in 1967 under present-‐day Lago Agrio in the indigenous Northern Ecuadorian Amazon, oil extraction has induced many changes. This research uses a large sample of household and community survey data through descriptive and multilevel regression analyses across ethnic groups and over time, constituting a novel, large-‐scale, comparative approach for analyzing the regional relationship between
extractive industries and livelihoods. Five livelihood outcomes were analyzed, in relation to two key oil extraction predictors. Results showed that when oil companies were present at the community level, indigenous households had more off-‐farm employment and earned more annually from it, hunting yields increased, assets increased, marginally more land was cleared, and fishing yields decreased. In the short-‐term, oil companies may indeed have somewhat positive effects on indigenous communities. However, in the long-‐term, indigenous livelihoods may be vulnerable due to finite oil resources, contamination, cultural erosion, and regional market integration.
To all who strive for knowledge and understanding in this increasingly complex world, and to my amazing fiancé Christine, my wonderful family, and my supportive friends.
ACKNOWLEDGEMENTS
have greatly appreciated the support and collaboration with students Mark Janko and Maia Call who helped me answer some of my most pressing academic and non-‐academic
questions. Thank you to the 2012 Geography Cohort for solidarity, friendship, support, and guidance. Last, but certainly not least, thank you to Christine for her love, support, and motivation.
TABLE OF CONTENTS
List of Tables ... viii
List of Figures ... ix
Chapter 1: Introduction ... 1
Chapter 2: Literature and Theory ... 4
Chapter 3: Study Area ... 7
Chapter 4: Data ... 14
Chapter 5: Methods ... 16
Chapter 6: Results ... 24
Chapter 7: Discussion and Conclusion ... 39
References ... 45
LIST OF TABLES
Table 1: Community descriptive variables ... 26
Table 2: Community and household predictor variables ... 27
Table 3: Household descriptive variables ... 29
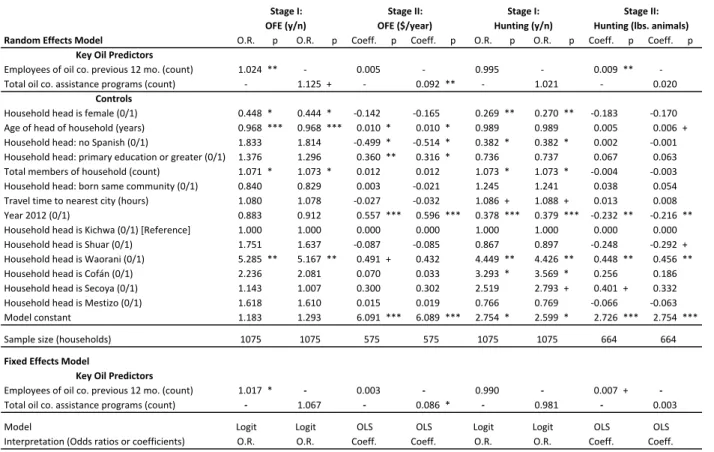
Table 4: Dual stage multilevel regression model results ... 34
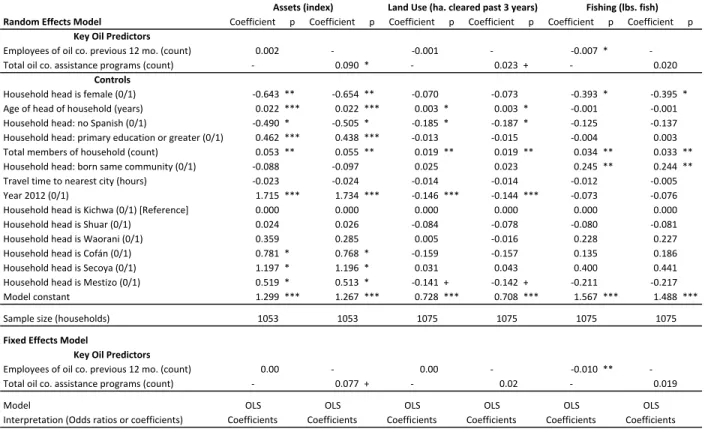
Table 5: Single stage multilevel regression model results ... 36
LIST OF FIGURES
Figure 1: Ecuador’s regions and the study site ... 2 Figure 2: Indigenous communities of the Northern Ecuadorian Amazon
included in the study ... 9 Figure 3: Indigenous communities, oil extraction infrastructure, and
CHAPTER 1: INTRODUCTION
Large-‐scale commercial resource extraction activities that encroach into territories of indigenous peoples is an issue of great importance, especially in an increasingly
globalized and developed world. How indigenous peoples react to and cope with these external pressures is a pressing topic because they tend to occupy relatively isolated territories, are often consequently marginalized from modern societies, commonly lag in development indicators, and have unique livelihoods, languages, and cultures. Large-‐scale resource extraction is influenced by global market demands; and though these influences are non-‐local, searches for minerals and resources often lead extractive operations to remote areas, such as those inhabited by indigenous peoples. Just such a situation has been unfolding in Ecuador due to the discovery of vast oil reserves in 1967.
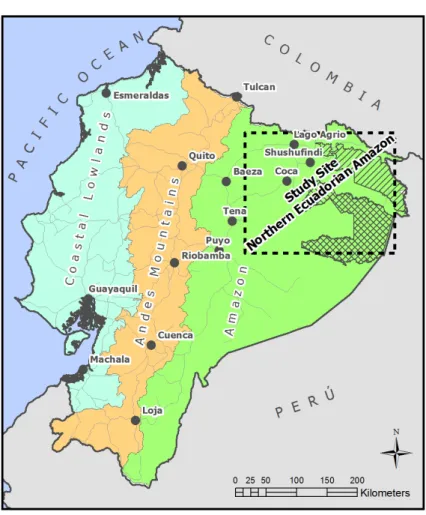
Since the 1960s, the Northern Ecuadorian Amazon (NEA) has been affected by large-‐ scale oil extraction activities. See Figure 1 for a map of Ecuador, its regions, and the NEA study area. Rather suddenly, indigenous ethnic groups, including the Kichwa, Shuar, Waorani, Cofán, and Secoya, were faced with pressures on their traditionally subsistence-‐ based livelihoods as their territories were “opened up” to external influences, including external market forces. Oil companies operating in the NEA built networks of
Figure 1: Ecuador's regions and the study site.
the intensity of oil company involvement in communities through employment with oil companies and community technical assistance programs instituted by oil companies, respectively. We analyzed five livelihood outcomes, which included off-‐farm employment, land use, household assets, hunting, and fishing activities, in order to disaggregate the multidimensionality of livelihoods.
Few studies of the effects of extractive industries (e.g., oil extraction, mining, natural gas “fracking”) have been conducted on a regional scale in the greater Amazon, as most have used small-‐scale case study, ethnographic, summary/review, or other methods (Basu et al., 2010; Finer, Jenkins, Pimm, Keane, & Ross, 2008; Kimberling, 2005; Larrea, 2013; Sabin, 1998; Sawyer, 2004; Suárez et al., 2009; Valdivia & Benavides, 2012; Wunder, 2003). This study is novel for its employment of a regional comparative approach to analyze
multi-‐ethnic, multilevel, and longitudinal relationships between oil extraction and
livelihoods in the indigenous NEA. To the researchers’ knowledge, few (if any) past studies have implemented such an approach for explicitly examining relationships between
extractive industries and livelihoods on a regional scale in the Amazon, much less between oil extraction and indigenous livelihoods in the Amazon.
This study is organized in the following manner. First, a focused section on pertinent literature and theory is provided. Then follows a detailed description of the study area, including a brief history and sketches of its indigenous inhabitants. A section describing the data of the study follows, along with a methods section. Next, the results of both the descriptive and multilevel regression analyses are detailed. Finally, a discussion of the results and conclusion is provided.
CHAPTER 2: LITERATURE AND THEORY
This research is motivated by the rural livelihoods framework in which rural households are the focal point for livelihood strategies, capital endowments of various forms, and multi-‐scale contextual factors (Ellis, 2000; Gray, Bilsborrow, Bremner, & Lu, 2008; Scoones, 1998). Under this framework, the household is the primary unit of analysis. Households pursue livelihood strategies within a context of capital endowments to which they have access, including natural, social, human, physical, and financial capitals
(Sherbinin et al., 2008), though other researchers have classified these differently
(Bebbington, 1999; Ellis, 2000). Rural households are able to diversify their livelihoods by accruing and converting stocks of capital. Rural livelihoods are multi-‐dimensional,
exhibiting an array of both subsistence and market-‐oriented components that are adopted as a form of diversification for risk mitigation (Ellis, 2000; Lu, 2007; Newton, Endo, & Peres, 2012; S. G. Perz et al., 2013). The rural livelihood framework inspired and informed the outcomes used this study.
2010; S. Perz et al., 2008; Pfaff et al., 2007; Southworth et al., 2011; Suárez et al., 2009). It has also resulted in widespread environmental contamination that has affected the
atmosphere, lithosphere, and hydrosphere (Kimberling, 2005; Larrea, 2013; Sabin, 1998; Sawyer, 2004; Wunder, 2003); direct and indirect changes to land use and tenure regimes (Bilsborrow et al., 2004; Bilsborrow, 1987; Rudel, Bates, & Machinguiashi, 2002), market integration (Godoy & Cárdenas, 2000; Godoy et al., 2005; Gray et al., 2008; Lu, 2007; S. G. Perz et al., 2013); and direct involvement in indigenous communities through employment, construction of community infrastructure, and institution of technical assistance programs (Holt, Bilsborrow, & Ona, 2004; Lu, 2007). One study did find positive affects on nutrition for indigenous employees of a nearby mining company in Guatemala due to the better diet offered by the company, indicative of the “healthy worker effect” (Basu et al., 2010), though other studies documented multiple adverse effects of commercial extractive operations in rural or indigenous areas beyond contamination and habitat degradation and
fragmentation, including unbalanced power dynamics, threats to identity and social
dynamics, and other effects (Bebbington et al., 2008; Perreault, 2005; Valdivia & Benavides, 2012). However, in sum, relatively few studies have investigated large-‐scale commercial extractive industry operations in the Amazon.
for other factors that influenced livelihoods, derived from the rural livelihoods framework. Other theories that informed our selection of controls include: the Chayanovian household lifecycle theory, which postulates that livelihood activities are mediated by household demographics and the household ratio of consumers (dependents) to producers (Barbieri, Bilsborrow, & Pan, 2005; Caldas et al., 2007; Chayanov, Kerblay, Smith, & Thorner, 1986; Sherbinin et al., 2008; Walker, Perz, Caldas, & Silva, 2002); the farm lifecycle theory
whereby the age of the rural farm affects livelihood practices (Barbieri et al., 2005; López & Sierra, 2011; Mena et al., 2006); and the theory of multiphasic response that posits
responses to pressures being multiple and simultaneous (Barbieri et al., 2005; Bilsborrow, 1987; Davis, 1963).
CHAPTER 3: STUDY AREA
The Northern Ecuadorian Amazon (NEA)
The NEA is a dynamic region. With extraordinary biodiversity, a sizeable
indigenous population, and oil underfoot, the NEA continues to experience swift change. Some of the highest species counts per unit area in the world have been recorded in the western Amazon, which encompasses the NEA (Finer et al., 2008; Finer, Moncel, & Jenkins, 2010). Formerly, the largest city of the region was Lago Agrio (also known as Nueva Loja), in Sucumbíos province, though Coca (Orellana province) has recently overtaken it as the most populous city of the region. However, prior to the 1960s, the city of Lago Agrio didn’t exist. The primary inhabitants of the region were the various indigenous ethnic groups. When oil was discovered in 1967, Lago Agrio was founded as a small town to facilitate oil extraction and to house oil workers. Since then, many other small cities have been founded and continue to grow, such as Shushufindi, Lumbaqui, and Joya de los Sachas. In 1972, Texaco completed the Trans-‐Ecuadorian Pipeline and began transporting crude from the Amazon west across the Andes (Kimberling, 2005). Road networks were built (over 600km of unpaved roads by Texaco, initially) to access both the new pipeline and the oil-‐ related extraction infrastructure that included wells, pumping stations, intermediate
production increased, Lago Agrio became more and more relevant as an important regional city in Ecuador.
The road networks had a secondary effect beyond providing oil companies access to their infrastructure. The NEA was effectively “opened-‐up” for migrants (largely mestizos from the rural Andes mountains and some Kichwa and Shuar) to claim lands along or near the new roads during a time period when Ecuador permitted or even promoted
agricultural colonization of the region (Rudel et al., 2002). Land was distributed in 50 hectare allotments within specified sectors (sectores) parallel to the major roads in a systematic manner by the IERAC (Instituto Ecuatoriano de Reforma Agraria y Colonización) land management agency prior to its closing in 1993 as a consequence of the national neo-‐ liberal shift (Bilsborrow et al., 2004; Rudel et al., 2002). Those who could not attain legal titles still claimed lands, as land tenure enforcement in the Ecuadorian Amazon was either nonexistent or minimally effective (Pichón, 1997). Thus, since the 1960s, the NEA has seen a rapid influx of migrants in search of better economic opportunities.
Indigenous Ethnic Groups
control, and deliberately dumped tons of toxic drilling and maintenance wastes, in addition to an estimated 19.3 billion gallons of oil field brine, into the environment without
treatment or monitoring – contaminating countless rivers and streams that served as rich fisheries and water sources for local communities” (Kimberling, 2005). A class action lawsuit was brought against Texaco (which was sold to Chevron) in 1992 due to its unchecked and widespread pollution.
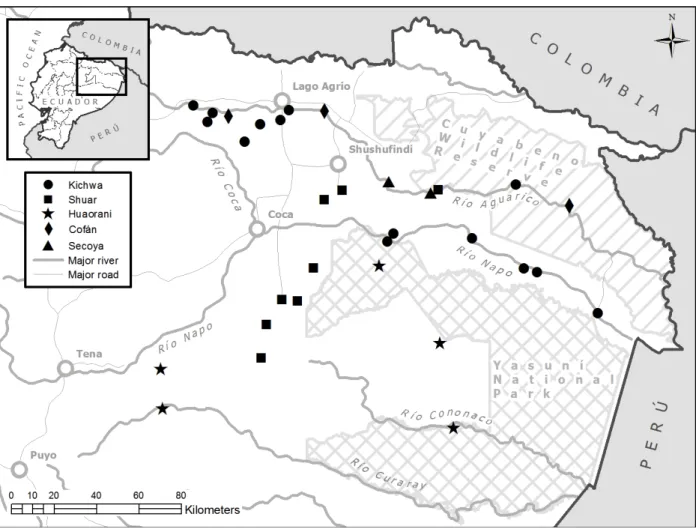
Figure 2: Indigenous communities of the Northern Ecuadorian Amazon included in the study.
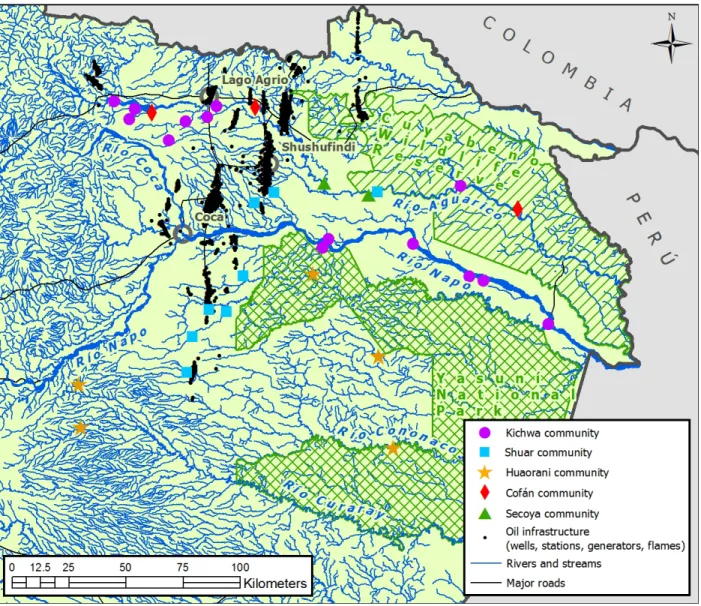
positions, that are higher than most other employers (if these other opportunities even exist). Figure 3 shows the indigenous communities in reference to known oil infrastructure locations in 2012.
Figure 3: Indigenous communities, oil extraction, and rivers of the Northern Ecuadorian Amazon.
(e.g., fertilizer, pesticides), more cattle, and less crop variety, or agrobiodiversity (Lu et al., 2010; Perreault, 2005; Rudel et al., 2002). The indigenous ethnic groups are not self-‐ sufficient, but they participate in market activities at various levels of involvement in addition to subsistence activities (e.g., subsistence hunting, fishing, farming, etc.) (Godoy et al., 2005; Lu & Bilsborrow, 2011; Lu, 2007).
Each indigenous group is unique in its characteristics and history. The largest indigenous ethnic group in the NEA is the Kichwa with a population numbering
approximately 60,000 people; they speak Kichwa and Spanish (Lu & Bilsborrow, 2011). They have a relatively long history of contact with outsiders, and participate in market-‐ oriented activities at an intermediate level.
The second-‐largest indigenous ethnic group of the NEA, the Shuar, have a
population of about 40,000 people, and speak a language of the Jivaroan language group and Spanish (Lu & Bilsborrow, 2011). The Shuar in the NEA are these who migrated from the southern Ecuadorian Amazon to the NEA while reorganizing themselves from
dispersed homesteads into clusters of households in villages during the period of
colonization (Gray et al., 2008; Holt et al., 2004; Lu & Bilsborrow, 2011). They cleared large tracts of land primarily as a means to secure their claims and initiated market-‐oriented cattle ranching (Holt et al., 2004; Lu & Bilsborrow, 2011). Of all five ethnic groups, the Shuar in the NEA are the most market-‐oriented, which is characterized by their relatively high intensity of selling crops, larger areas cultivated, use of external agricultural inputs, cattle, high agrobiodiversity (Perreault, 2005; Rudel et al., 2002), less reliance on
The Waorani were still un-‐contacted as of 1958, and they currently occupy the remote tracts of the rainforest in and around Yasuní National Park, though this is beginning to change. In terms of population, they rank third among the five ethnic groups of the NEA, numbering approximately 2000 people (Lu & Bilsborrow, 2011). Before being contacted, they lived in 30-‐50 kin longhouses, though they are now largely organized in smaller
houses clustered in villages (Holt et al., 2004). They speak Huao Tededo and some Spanish. Their relatively remote territories provide them access to many wild resources, so they consequently hunt, fish, and gather forest products at relatively high frequencies. They exhibit a low tendency towards market activities (and are relatively far from markets) but tend to have high proportions of members in OFE, especially with oil companies. They still rely heavily on subsistence activities. Waorani society also exhibits more individualism than the societies of other ethnic groups in the NEA (Holt et al., 2004).
The Cofán of the NEA were displaced from their traditional territory in and around Lago Agrio during the oil boom to locations further east into the deeper forest. They are fourth in population relative to the other indigenous groups, having about 500 people in Ecuador (Lu & Bilsborrow, 2011). They speak A’i and some Spanish. Like the Waorani, they are largely subsistence-‐oriented, though they participate in some market activities and tourism. They are generally not involved with oil companies but are greatly involved with ecotourism companies. They also create and sell handicrafts. Also like the Waorani, they frequently hunt, fish, gather forest products, and participate in subsistence farming activities.
primarily inhabit tracts along the Aguarico River and its tributaries. The Secoya exhibit “mixed” market/subsistence activities, as they have had a working relationship with the Occidental oil company while participating in subsistence activities at varying levels (Holt et al., 2004; Lu et al., 2010).
CHAPTER 4: DATA
In 2001, Bilsborrow and Lu designed a comprehensive household survey covering demographic information, health, land use, wild resource use, labor and employment, economic information, and perceptions and attitudes. Two different household-‐level questionnaires were constructed: one for the male head of the household, and one for the female head of the household, respectively. 36 communities in the NEA were originally included in the survey. For communities having 22 or less households, all households were listed and surveyed (Gray et al., 2008). In the few communities that had more than 22 households, 22 of them were randomly selected and surveyed.
Ecuadorian Spanish-‐speaking staff conducted the surveys orally. When present in a household, both male and female household head questionnaires were given. In some cases there was no female head of household, and in other cases the female was the only head of the household. In either of these cases, both surveys were administered to the available head of the household. In total, 484 households provided complete responses to the male head of household questionnaire in 2001. 476 households in 2001 provided both a complete male head of household questionnaire and a complete female head of household questionnaire.
In addition, in an effort to study contextual effects, a community-‐level survey was designed. This survey was administered to multiple leaders in each community. It
other community attributes. Additionally, all pertinent locations including households, important community features, and agricultural plots were geo-‐referenced using Global Positioning System (GPS) points.
In 2012 a follow-‐up (longitudinal) survey was administered. The majority of the same 476 households from the same communities in the 2001 survey were re-‐located and re-‐administered the 2012 version of the survey under the direction of Bilsborrow and Gray. By that time, many of the households had been subdivided through either inheritance, marriage of children (now adults) of the household heads, divorce, or through other circumstances. The 2012 fieldworkers interviewed both the original households and the split-‐off households, which resulted in a larger sample size of 599 households (completing both male and female head of household respective surveys). For logistical reasons, 4 communities were not interviewed in 2012, which brought the sample size of communities down from 36 to 32.
CHAPTER 5: METHODS
This study employs a large-‐sample, comparative approach using data from
household and community surveys in the indigenous NEA to investigate the effects of oil company presence at the community level on indigenous livelihood practices. Two
analyses are presented here. First, is a descriptive analysis comprised of comparing mean variable values across ethnic groups and through time. Descriptive analyses involved computation of p-‐values that were based on two-‐sided t-‐tests at a significance level of α = 0.05. Relationships were deemed significant for those having a p-‐value less than 0.05. Marginally significant relationships were denoted as having p-‐values between 0.05 and 0.10. Each relevant table includes a legend to interpret p-‐value symbology. Second, we estimate multilevel statistical regression models of our livelihood outcomes that control for several factors.
Multilevel Regression Models
1075 household-‐years.
We construct the following general two-‐level random-‐intercept model for random community effects:
𝑦!"# =𝑦!!!+𝛽𝑥!"#+𝛿𝑤!"+𝛼!+𝑢!" +𝑒!"#
where 𝑦!"# is the outcome for household i in community j in year t, 𝑦!!! is the common
intercept, 𝛽 is a vector of household-‐level coefficients, 𝑥!"# is a vector of household-‐level
predictors, 𝛿 is a vector of community-‐level coefficients, 𝑤!" is a vector of community-‐level
predictors, 𝛼! is the community-‐level random effect, 𝑢!" is the household-‐level random
effect, and 𝑒!"# is the residual error term. For our fixed effects model, the general model is
identical with the exception that 𝑢!", the random community-‐level error term, is replaced
with fixed community effects.
Random effects models in the context of this study posit random variation both
within communities and between communities. Fixed effects models in the context of this study focus only on within community variation, in order to account for the potential non-‐ random placement of oil companies in regards to communities and their consequent effects on livelihoods. Gray et al. employed a similar random effects multilevel statistical approach in a study that utilized the cross-‐sectional data from the 2001 survey (Gray et al., 2008). However, Godoy et al. used fixed effects models for a study of comparable size having 36 communities (Godoy et al., 2005). Thus, large-‐sample survey studies have used both random and fixed effects approaches with success.
Multilevel Regression Outcomes
censored at zero those that did not hunt in the past year, weight of fish caught on the previous fishing trip (fishing) censored at zero those that did not fish in the past year, physical household assets index score (assets), and hectares of land cleared during the previous three years (land use). These outcomes were selected to elucidate the variation in both traditionally subsistence-‐oriented activities and in livelihood activities commonly associated with market orientation, in order to capture shifts in livelihoods. The fishing outcome represents a traditional subsistence-‐oriented activity. The OFE, assets, and land use outcomes generally quantify changes to market-‐oriented activities. The OFE outcome measures the diversification of livelihoods from primarily subsistence activities to some market-‐oriented activities.
Much the same, the assets outcome is a measure of market consumption. The assets outcome was defined as an index variable, in which households were assigned a value along a continuous range from 0-‐10 based on the existence of a number of physical assets within the household. It was generated using polychoric principle components analysis on asset and housing variables on 2001 and 2012 data together; the first principle component was standardized on a ten-‐point scale and then used (Kolenikov & Angeles, 2009). The higher the value, the more assets a household had.
The land use outcome, which measured recently cleared land for agriculture, is indicative of increased market-‐oriented agricultural activities that may include farming of perennials and/or cattle ranching. However, regular crop clearing is expected for
indigenous groups of the NEA, as they cyclically clear and fallow plots, given their household food demands and increases or decreases in plot soil fertility. Larger
groups in the NEA (Lu et al., 2010). The hunting outcome1 can be considered both a subsistence and market-‐oriented activity. Away from markets, hunting is primarily for subsistence. Nearer markets, households with diversified livelihoods may hunt to sell wild meat to markets (Espinosa, 2008; Suárez et al., 2009).
Multilevel Regression Approach
In regards to the five outcomes modeled via multilevel regressions here, either a single stage or dual stage approach was implemented. A single stage approach was employed for outcomes in which nearly all households participated in the livelihood activity; this applied to the assets, land use, and fishing outcomes. These were modeled with continuous outcomes mentioned above, where the continuous outcomes measured intensity of the livelihood activity.
We used a dual stage approach when a substantial fraction of households did not participate in the livelihood activity, and this was therefore relevant for the OFE and hunting outcomes. This allowed us to deal with the many “zero cases” in our models that did not provide adequate variation in the data. For the dual stage approach, in stage I the whole sample was modeled using a dichotomous outcome of whether or not they
participated in the activity (e.g., did a household have OFE in the previous year: yes or no). This allowed us to analyze which factors were associated with households participating in the livelihood activity. In stage II of the dual stage approach, only households participating in the livelihood activity (e.g., only households that had OFE) were modeled with a
continuous outcome indicating the intensity of the outcome. The non-‐participants (e.g., the
1 A few other outcomes were initially contemplated for inclusion as additional models. These
“no” or zero outcomes of the stage I model) were censored. The stage II model allowed for an analysis of the factors associated with the intensity of the livelihood activity for
participating households. Noted above, these five outcomes (single stage and dual stage, collectively) were modeled using both random and fixed effects multilevel models. Additionally, livelihood outcomes that exhibited a right-‐skewed distribution were log-‐ transformed and then modeled; this applied to all outcomes with the exception of assets.
Key Multilevel Regression Predictors
Two key predictors were examined for the five outcomes, which resulted in two specifications for each random and fixed effects multilevel model, respectively. Thus, for each single stage livelihood outcome, four models were run; and for each dual stage
outcome, eight models were run. Several household-‐level and community-‐level predictors of oil company influence/impact on indigenous communities and households were initially considered. We decided that the number of community members employed by oil
Households then make decisions within that framework. Therefore, key community-‐level oil predictors2 were preferred.
Our final two key predictors were the number of indigenous employees hired from a community by oil companies in the previous 12 months (oil employees) and the total number of technical assistance programs instituted in a community by oil companies (from 1990 for the 2001 survey, and from 2000 for the 2001 survey) (oil programs). This latter measure encompasses several different types of programs, which range from health, growing perennial crops, growing coffee, growing cacao, reforestation, native plant
cultivation, pisciculture, environmental education, food for children, to animal husbandry. But, our interest is primarily in the intensity of oil company involvement in communities in regards to the livelihoods of households. We predicted that communities with more oil employees and more oil programs would both be associated with more market-‐oriented activities (OFE, assets, cleared land, and hunting for market) and less subsistence-‐oriented activities (subsistence hunting and fishing, in addition to less land-‐intense annual crops), given that oil companies can facilitate market integration both directly in communities and indirectly through larger-‐scale processes.
Multilevel Regression Controls
We included a number of control variables in our regression models. These covariates were included to control for various other factors affecting rural livelihoods, including household demographics, stage in the household and farm lifecycles, cultural
characteristics, various forms of capital, distance to market, and the survey year. Household size and the age of the household head were included as controls for
demographics, and for household lifecycle factors. Smaller and older households are likely further along in the lifecycle, and may be more inclined towards less labor-‐intensive
subsistence activities, having more cattle and lands in pasture, and hiring more laborers among other things (for rural colonists, though a similar logic can be applied to indigenous households) (Bilsborrow et al., 2004).
Culturally, evidence has shown that indigenous groups are heterogeneous, having specific livelihood tendencies given their unique cultural identities (Holt et al., 2004; Lu & Bilsborrow, 2011; Rudel et al., 2002). Therefore, it is important in our statistical models to control for ethnicity. We included a categorical variable that designated each household head as being either Shuar, Waorani, Cofán, Secoya, or mestizo (who become part of indigenous communities through marriage to an indigenous person) in reference to the largest indigenous group, the Kichwa.
Natural capital is not explicitly controlled for in our model, as we did not feel our measures were satisfactory. But, the indigenous communities are rural and generally have similar access to wild resources (i.e., natural capital), though it should be noted that the Waorani and Cofán tend to live in deeper forest locations with greater abundance of floral and faunal resources (Lu & Bilsborrow, 2011), and other minor differences exist. Both human and social capitals were controlled for in various ways. Controls for the household head having a primary education, the household head not being able to speak Spanish, and the household head being female are each forms of human capital. More educated
reverse is the case for household heads that can’t speak Spanish; they are less able to access and undertake market-‐oriented activities because they cannot speak the regional language of business. And as both indigenous and colonist societies are patriarchal and male-‐dominated, having a female household head is similarly a factor that can impede market-‐oriented activities. Social capital is partially acknowledged through a variable designating whether or not a household head was born in the community. When the household head is born in the same community, there are more options for a larger and richer social network, and that household head can have greater knowledge (or access to knowledge) of agriculture and beneficial hunting/fishing locations in the community and region. We chose not to control for physical (i.e., assets) and financial capital (i.e., OFE earnings) because we explored these as livelihood outcomes in our models.
CHAPTER 6: RESULTS
Two analyses were conducted on the livelihood effects of oil extraction operations in the NEA. These were a descriptive analysis and a multilevel regression analysis. We sought first to explore general relationships in the data via a descriptive analysis. This involved examining differences in community and household-‐level variables between ethnicities and over time.
Descriptive Analysis
Table 1 shows community-‐level descriptive results. The NEA has experienced oil-‐ related development and employment as long ago as the late 1960s. Thus, while oil company involvement in indigenous communities has been lengthy in some cases, we did not expect drastic changes between survey years regarding overall oil company operations. It must be noted that oil companies explore for oil deposits, locate them, often enter the nearby indigenous communities and offer gifts (e.g., cattle, infrastructure, etc.),
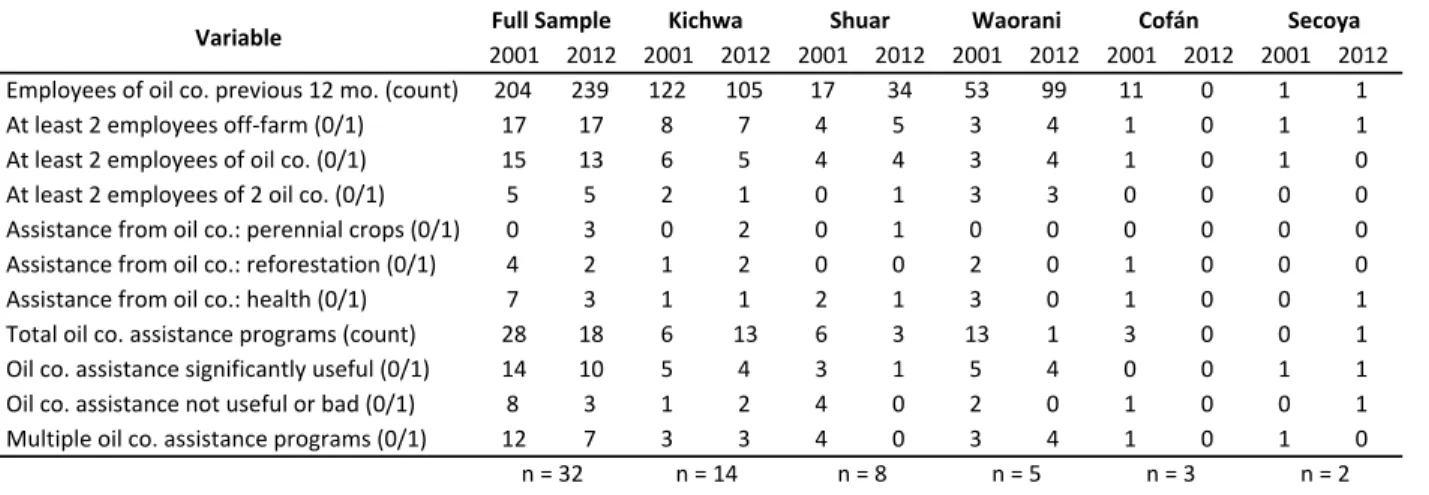
sample had the least employment with oil companies in 20013, and in 2012 both the Secoya and Cofán had no employment with oil companies. The Shuar, Waorani, and Kichwa had the greatest proportion of communities with at least two oil employees in the year previous to each of the survey years in both 2001 and 2012. Despite the Waorani traditionally occupying territories deeper into remote primary forest, they showed high levels of employment with oil companies. Because oil company operations follow the oil deposits, which can lead them to similarly remote tracts of forest, the fact that remote Waorani communities are employed at high levels for oil companies isn’t surprising. Studies have also shown that Waorani have moved households and communities closer to newly-‐ constructed roads, allowing them better access to markets and to employment (Suárez et al., 2009).
In terms of technical assistance programs instituted by oil companies, there has been an overall decrease from 28 total programs in all communities in 2001 to 18 in 2012. The biggest drop happened for the Waorani from 13 in 2001 to one in 2012, who, in
contrast, jumped from 53 oil company employees in 2001 to 99 in 2012. The Cofán, relative to their total number of three communities in our sample, had a large number of assistance programs (three) in 2001, but dropped to zero in 2012, while the Secoya gained one program in 2012 up from zero in 2001. The Kichwa increased to nearly one program per community (from six to 13 programs in 14 total communities) in 2012, the only increase in technical assistance programs for any of the ethnicities with the exception of
3 However, an oil company was directly involved in a Secoya community prior to the 2001
survey. That company gave the community cattle as compensation for being allowed to drill into the nearby land. They also employed several members of the community during the oil
the Secoya. Overall, the community variables show oil company employment maintaining a stable count, while total assistance programs decreased for all ethnicities except for the Kichwa.
Table 1: Community descriptive variables.
Table 2 gives changes in mean values between survey years for the household and community-‐level predictor variables used in the subsequent multilevel models.
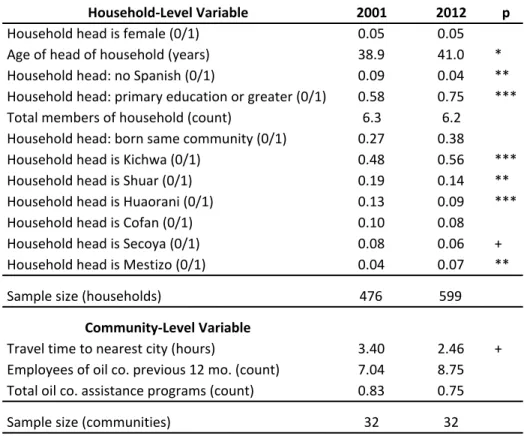
Households were rarely headed by women (~5% of households), which continued to be characteristic of the patriarchal indigenous societies of the NEA. The average age of the household head significantly increased from 38.9 to 41.0 years. This may be explained by aging of the household heads of the sample. Household heads were significantly more likely to speak Spanish (from 91% to 96%). A significantly larger percentage of household heads had attained at minimum a primary education (from 58% to 75%) between the survey years. These latter two relationships are consistent with continued market
integration, and government promotion and popular interest in increasing education. The average total members of a household remained steady just above 6 persons, and
household heads that reported being born in the same community increased, but not significantly. In regards to community-‐level predictors, we expected to see travel time in
2001 2012 2001 2012 2001 2012 2001 2012 2001 2012 2001 2012 Employees,of,oil,co.,previous,12,mo.,(count) 204 239 122 105 17 34 53 99 11 0 1 1 At,least,2,employees,off?farm,(0/1) 17 17 8 7 4 5 3 4 1 0 1 1 At,least,2,employees,of,oil,co.,(0/1) 15 13 6 5 4 4 3 4 1 0 1 0 At,least,2,employees,of,2,oil,co.,(0/1) 5 5 2 1 0 1 3 3 0 0 0 0 Assistance,from,oil,co.:,perennial,crops,(0/1) 0 3 0 2 0 1 0 0 0 0 0 0 Assistance,from,oil,co.:,reforestation,(0/1) 4 2 1 2 0 0 2 0 1 0 0 0 Assistance,from,oil,co.:,health,(0/1) 7 3 1 1 2 1 3 0 1 0 0 1 Total,oil,co.,assistance,programs,(count) 28 18 6 13 6 3 13 1 3 0 0 1 Oil,co.,assistance,significantly,useful,(0/1) 14 10 5 4 3 1 5 4 0 0 1 1 Oil,co.,assistance,not,useful,or,bad,(0/1) 8 3 1 2 4 0 2 0 1 0 0 1 Multiple,oil,co.,assistance,programs,(0/1) 12 7 3 3 4 0 3 4 1 0 1 0
Variable
n,=,2 Full*Sample Kichwa Shuar Waorani Cofán Secoya
hours to the nearest city to decrease between survey years resulting from ongoing
processes of development and market integration. It indeed decreased from 3.40 hours to 2.46 hours between 2001 and 2012. The oil-‐related community variables (average number of oil employees and average number of technical assistance programs) were not
significantly different between the survey years, per our expectations.
Table 2: Community and household predictor variables.
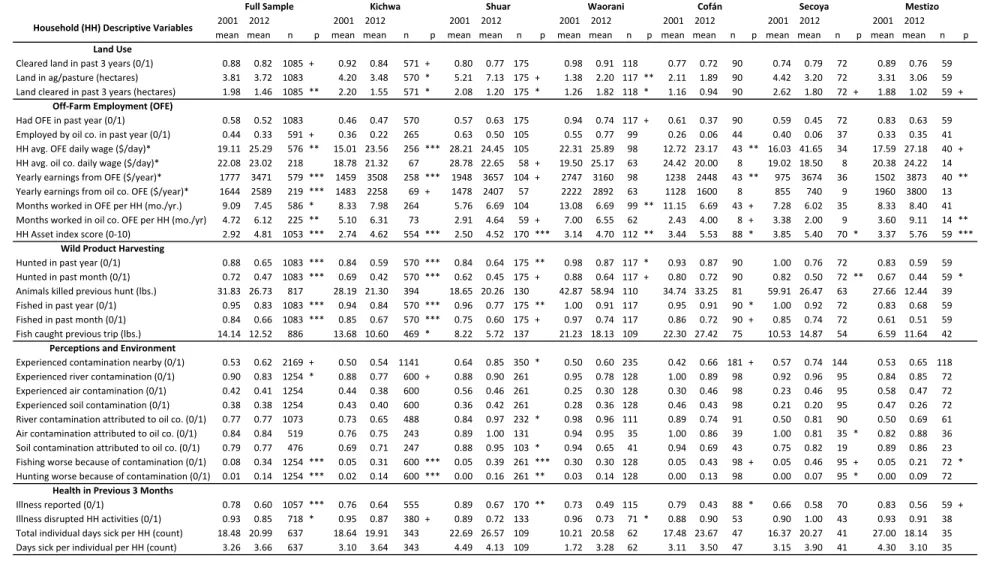
Numerous descriptive variables are presented in Table 3. This table includes our five regression model outcomes. We expected that cleared land in the three years previous to each respective survey year would increase between 2001 and 2012 due to continued market integration. Yet, the percentage of households that cleared land decreased (88% to 82%), marginally. This occurrence may be due to the fact that households in the sample aged, and worked less land in 2012 relative to 2001. Quite significantly, the hectares of
Household)Level,Variable 2001 2012 p
Household)head)is)female)(0/1) 0.05 0.05
Age)of)head)of)household)(years) 38.9 41.0 *
Household)head:)no)Spanish)(0/1) 0.09 0.04 **
Household)head:)primary)education)or)greater)(0/1) 0.58 0.75 ***
Total)members)of)household)(count) 6.3 6.2
Household)head:)born)same)community)(0/1) 0.27 0.38
Household)head)is)Kichwa)(0/1) 0.48 0.56 ***
Household)head)is)Shuar)(0/1) 0.19 0.14 **
Household)head)is)Huaorani)(0/1) 0.13 0.09 ***
Household)head)is)Cofan)(0/1) 0.10 0.08
Household)head)is)Secoya)(0/1) 0.08 0.06 +
Household)head)is)Mestizo)(0/1) 0.04 0.07 **
Sample)size)(households) 476 599
Community)Level,Variable
Travel)time)to)nearest)city)(hours) 3.40 2.46 +
Employees)of)oil)co.)previous)12)mo.)(count) 7.04 8.75 Total)oil)co.)assistance)programs)(count) 0.83 0.75
Sample)size)(communities) 32 32
land cleared per household dropped from 1.98 to 1.46 hectares between survey years. Households of all ethnicities cleared less land in 2012 than 2001 except the Waorani, who significantly increased cleared land from 1.26 to 1.82 hectares. For the Waorani, this is consistent with their increasing market integration. We expected that the more market-‐ oriented ethnic groups of the NEA would clear more land and have bigger plots. Consistent with theory, the Shuar had the most overall land in agriculture and pasture (5.21 hectares). Close behind in terms of average plot size were the Secoya and Kichwa, having 4.42 and 4.20 hectares, respectively.
Proportions of households having OFE and oil OFE slightly decreased, while household wages significantly increased for all OFE ($19.11 to $25.29 per day) between survey years, adjusted for inflation. Daily wages were not significantly different for oil company employees during the same period. Annual earnings per household from both OFE and oil OFE increased dramatically between survey years from $1,777 to $3,471 and from $1,644 to $2,589, respectively, in 2012 US Dollars per year. Interestingly, annual earnings in OFE rose for all ethnic groups except the Waorani, though it must be noted that they started with the highest annual cash earnings in 2001 relative to the other groups. Waorani, Shuar, and Kichwa households on average were the top three annual OFE income earners, in descending order. Months worked in OFE per household significantly dropped from 9.09 to 7.45 months, while months worked in oil company OFE significantly increased from 4.72 to 6.12 months per year. This indicates that there was a decreasing variety of types of jobs attained, and an increasing propensity to have employment with an oil company, overall. Waorani and Cofán household months worked in OFE decreased, while
Table 3: Household descriptive variables
2001 2012 2001 2012 2001 2012 2001 2012 2001 2012 2001 2012 2001 2012 mean mean n p mean mean n p mean mean n p mean mean n p mean mean n p mean mean n p mean mean n p Land%Use
Cleared-land-in-past-3-years-(0/1) 0.88 0.82 1085 + 0.92 0.84 571 + 0.80 0.77 175 0.98 0.91 118 0.77 0.72 90 0.74 0.79 72 0.89 0.76 59 Land-in-ag/pasture-(hectares) 3.81 3.72 1083 4.20 3.48 570 * 5.21 7.13 175 + 1.38 2.20 117 ** 2.11 1.89 90 4.42 3.20 72 3.31 3.06 59 Land-cleared-in-past-3-years-(hectares) 1.98 1.46 1085 ** 2.20 1.55 571 * 2.08 1.20 175 * 1.26 1.82 118 * 1.16 0.94 90 2.62 1.80 72 + 1.88 1.02 59 +
Off+Farm%Employment%(OFE)
Had-OFE-in-past-year-(0/1) 0.58 0.52 1083 0.46 0.47 570 0.57 0.63 175 0.94 0.74 117 + 0.61 0.37 90 0.59 0.45 72 0.83 0.63 59 Employed-by-oil-co.-in-past-year-(0/1) 0.44 0.33 591 + 0.36 0.22 265 0.63 0.50 105 0.55 0.77 99 0.26 0.06 44 0.40 0.06 37 0.33 0.35 41 HH-avg.-OFE-daily-wage-($/day)* 19.11 25.29 576 ** 15.01 23.56 256 *** 28.21 24.45 105 22.31 25.89 98 12.72 23.17 43 ** 16.03 41.65 34 17.59 27.18 40 + HH-avg.-oil-co.-daily-wage-($/day)* 22.08 23.02 218 18.78 21.32 67 28.78 22.65 58 + 19.50 25.17 63 24.42 20.00 8 19.02 18.50 8 20.38 24.22 14 Yearly-earnings-from-OFE-($/year)* 1777 3471 579 *** 1459 3508 258 *** 1948 3657 104 + 2747 3160 98 1238 2448 43 ** 975 3674 36 1502 3873 40 ** Yearly-earnings-from-oil-co.-OFE-($/year)* 1644 2589 219 *** 1483 2258 69 + 1478 2407 57 2222 2892 63 1128 1600 8 855 740 9 1960 3800 13 Months-worked-in-OFE-per-HH-(mo./yr.) 9.09 7.45 586 * 8.33 7.98 264 5.76 6.69 104 13.08 6.69 99 ** 11.15 6.69 43 + 7.28 6.02 35 8.33 8.40 41 Months-worked-in-oil-co.-OFE-per-HH-(mo./yr) 4.72 6.12 225 ** 5.10 6.31 73 2.91 4.64 59 + 7.00 6.55 62 2.43 4.00 8 + 3.38 2.00 9 3.60 9.11 14 ** HH-Asset-index-score-(0S10) 2.92 4.81 1053 *** 2.74 4.62 554 *** 2.50 4.52 170 *** 3.14 4.70 112 ** 3.44 5.53 88 * 3.85 5.40 70 * 3.37 5.76 59 ***
Wild%Product%Harvesting
Hunted-in-past-year-(0/1) 0.88 0.65 1083 *** 0.84 0.59 570 *** 0.84 0.64 175 ** 0.98 0.87 117 * 0.93 0.87 90 1.00 0.76 72 0.83 0.59 59 Hunted-in-past-month-(0/1) 0.72 0.47 1083 *** 0.69 0.42 570 *** 0.62 0.45 175 + 0.88 0.64 117 + 0.80 0.72 90 0.82 0.50 72 ** 0.67 0.44 59 * Animals-killed-previous-hunt-(lbs.) 31.83 26.73 817 28.19 21.30 394 18.65 20.26 130 42.87 58.94 110 34.74 33.25 81 59.91 26.47 63 27.66 12.44 39 Fished-in-past-year-(0/1) 0.95 0.83 1083 *** 0.94 0.84 570 *** 0.96 0.77 175 ** 1.00 0.91 117 0.95 0.91 90 * 1.00 0.92 72 0.83 0.68 59 Fished-in-past-month-(0/1) 0.84 0.66 1083 *** 0.85 0.67 570 *** 0.75 0.60 175 + 0.97 0.74 117 0.86 0.72 90 + 0.85 0.74 72 0.61 0.51 59 Fish-caught-previous-trip-(lbs.) 14.14 12.52 886 13.68 10.60 469 * 8.22 5.72 137 21.23 18.13 109 22.30 27.42 75 10.53 14.87 54 6.59 11.64 42
Perceptions%and%Environment
Experienced-contamination-nearby-(0/1) 0.53 0.62 2169 + 0.50 0.54 1141 0.64 0.85 350 * 0.50 0.60 235 0.42 0.66 181 + 0.57 0.74 144 0.53 0.65 118 Experienced-river-contamination-(0/1) 0.90 0.83 1254 * 0.88 0.77 600 + 0.88 0.90 261 0.95 0.78 128 1.00 0.89 98 0.92 0.96 95 0.84 0.85 72 Experienced-air-contamination-(0/1) 0.42 0.41 1254 0.44 0.38 600 0.56 0.46 261 0.25 0.30 128 0.30 0.46 98 0.23 0.46 95 0.58 0.47 72 Experienced-soil-contamination-(0/1) 0.38 0.38 1254 0.43 0.40 600 0.36 0.42 261 0.28 0.36 128 0.46 0.43 98 0.21 0.20 95 0.47 0.26 72 River-contamination-attributed-to-oil-co.-(0/1) 0.77 0.77 1073 0.73 0.65 488 0.84 0.97 232 * 0.98 0.96 111 0.89 0.74 91 0.50 0.81 90 0.50 0.69 61 Air-contamination-attributed-to-oil-co.-(0/1) 0.84 0.84 519 0.76 0.75 243 0.89 1.00 131 0.94 0.95 35 1.00 0.86 39 1.00 0.81 35 * 0.82 0.88 36 Soil-contamination-attributed-to-oil-co.-(0/1) 0.79 0.77 476 0.69 0.71 247 0.88 0.95 103 * 0.94 0.65 41 0.94 0.69 43 0.75 0.82 19 0.89 0.86 23 Fishing-worse-because-of-contamination-(0/1) 0.08 0.34 1254 *** 0.05 0.31 600 *** 0.05 0.39 261 *** 0.30 0.30 128 0.05 0.43 98 + 0.05 0.46 95 + 0.05 0.21 72 * Hunting-worse-because-of-contamination-(0/1) 0.01 0.14 1254 *** 0.02 0.14 600 *** 0.00 0.16 261 ** 0.03 0.14 128 0.00 0.13 98 0.00 0.07 95 * 0.00 0.09 72
Health%in%Previous%3%Months
Illness-reported-(0/1) 0.78 0.60 1057 *** 0.76 0.64 555 0.89 0.67 170 ** 0.73 0.49 115 0.79 0.43 88 * 0.66 0.58 70 0.83 0.56 59 + Illness-disrupted-HH-activities-(0/1) 0.93 0.85 718 * 0.95 0.87 380 + 0.89 0.72 133 0.96 0.73 71 * 0.88 0.90 53 0.90 1.00 43 0.93 0.91 38 Total-individual-days-sick-per-HH-(count) 18.48 20.99 637 18.64 19.91 343 22.69 26.57 109 10.21 20.58 62 17.48 23.67 47 16.37 20.27 41 27.00 18.14 35 Days-sick-per-individual-per-HH-(count) 3.26 3.66 637 3.10 3.64 343 4.49 4.13 109 1.72 3.28 62 3.11 3.50 47 3.15 3.90 41 4.30 3.10 35 +-p<0.10,-*-p<0.05,-**-p<0.01,-***-p<0.001
*Units-are-2012-US-dollars,-corrected-for-inflation.
Secoya Household%(HH)%Descriptive%Variables
Mestizo Full%Sample Kichwa Shuar Waorani Cofán
months worked in oil company OFE increased for the Shuar, Cofán, and Kichwa. Household
assets increased dramatically between survey years, per the physical household asset index
scores. The Cofán and Secoya had the most household assets in 2012 by our measure.
Together with Table 1, results in Table 3 show that there were more indigenous people
working for oil companies, earning more annually, working more months, and attaining
greater numbers of household assets in 2012 relative to 2001.
Regarding perceptions and environmental topics4, marginally more households
experienced contamination, and significantly less reported river contamination in 2012
than in 2001, though it must be noted that overall, 53% of households in 2001 and 62% of
households in 2012 reported nearby contamination, and the vast majority of this sample
subset attributed river, air, and soil pollution in both of the survey years to oil companies.
Overall, some 90% of households that reported contamination in 2001 and 83% in 2012
indicated that it took the form of river contamination, and this was consistently high across
all ethnic groups. Collectively the indigenous groups reported that both fishing and
hunting were significantly worse due to contamination in 2012 compared to 2001. Thus,
there is an important environmental component here not addressed by our methods, and
which we hope is addressed by researchers in the future.
In terms of traditional subsistence activities, we expected to see a decrease in
overall hunting and fishing frequencies as communities became more integrated with
market activities, though with caveats. We expected to see fishing catches maintain or
decrease, but studies have shown increased hunting with better access to markets
4 These data came from both the male head of the household and female head surveys,
(Espinosa, 2008; Suárez et al., 2009). In addition, we expected to see more market-‐
oriented groups such as the Shuar to hunt and fish relatively less than other groups.
Results showed that both hunting frequency and fishing frequency dramatically and
significantly decreased, especially for hunting. Both the Cofán and Waorani hunted the
most in both survey years, consistent with our expectations that these groups were the
least market-‐oriented and most subsistence-‐oriented. The Kichwa and Secoya household
hunting frequencies dropped the most between survey years, from 69% to 42% and from
82% to 50% in the previous month, respectively. Shuar and Kichwa households hunted the
least frequently by both the monthly and yearly measures. In contrast, hunting and fishing
yields decreased, but not significantly. Additionally, the Shuar fished the least frequently
by both the monthly and yearly measures, consistent with theory and our hypothesized
relationships.
For health-‐related survey questions, we expected mixed findings. On the one hand,
the indigenous groups report high levels of contamination, which we hypothesize has
potentially negative health effects. On the other hand, we know that access to modern
forms of health care is increasing. In some cases, oil companies have also instituted health
assistance programs, or even built health facilities for communities where there were none
previously. Results show that reported illnesses in the three months previous to each of
the survey years decreased both overall (78% to 60% of households reporting illness) and
for every indigenous group. The case was the same for households reporting illnesses that
disrupted normal activities (93% to 85% overall), with the exception that this figure for the
Cofán slightly increased (88% to 90%). Overall, individual days sick per household
sick days more than doubled between survey years from 10.21 to 20.58 days sick per
household, though, they did report the fewest days sick in 2001 and also tend to have
larger households, relative to the other groups. However, it is important to reiterate that
they also have a relatively high level of direct involvement with oil companies operating
nearby.
Multilevel Regression Analysis
As indicated earlier, for each of the five livelihood outcomes modeled, either a single
or dual stage approach was implemented. A dual stage model was employed for the OFE
and hunting outcomes, respectively (Table 4). A single stage approach was applicable for
the assets, land use, and fishing outcomes, respectively (Table 5). For both single stage and
dual stage models a full random effects model is shown, and only key predictors are shown
for the fixed effects model specification, respectively. While the controls, are not shown for
the fixed effects models, these were run with an identical set of controls with the exception
that 31 dichotomous dummy variables, one for each of the communities (i.e., the fixed
community effects), were included in place of the categorical community variable.
Shown in Table 4, the results of stage I of the OFE model (logit) indicated whether or
not a household had OFE in the previous year to the survey5. For households that had OFE
(stage I), stage II then predicted the income (2012 US Dollars, adjusted for inflation) earned
in OFE during the year previous to the survey year (OLS)6. We expected that both the stage
5 Logit output is in the form of odds ratios, whereby a value above 1.00 indicates a positive
effect, and a value below this threshold indicates a negative effect. The difference in the odds ratio from 1 corresponds to the percentage increase (or decrease) in odds that a 1-unit increase in the predictor will result in the outcome. For example, an odds ratio of 1.15 is interpreted as an increase in odds by 15% of a 1-unit increase in the predictor on the outcome.