EVOLUTION OF THE HOST RANGE OF THE BACTERIOPHAGE φ6
MARTIN THOMAS FERRIS
A dissertation submitted to the faculty of the University of North Carolina at Chapel Hill in partial fulfillment of the requirements for the degree of Doctor of Philosophy in the
Department of Biology.
Chapel Hill 2007
Approved by:
Christina Burch, PhD Ralph Baric, PhD
Robert Peet, PhD
© 2007
ABSTRACT
MARTIN THOMAS FERRIS: Evolution of the Host Range of the Bacteriophage φ6 (Under the direction of Christina L. Burch)
The emergence of novel viral disease into naïve host populations is a specific case of biological invasion. One critical component of viral disease emergence is the evolution of a virus’ host range – the ability of a virus to utilize different hosts. In this dissertation I use the bacteriophage φ6 as a model system to investigate the evolution of virus host range.
The expansion of a virus’ host range is often the first step in emergence. I found that φ6 expands its host range by acquiring mutations that allow viral attachment to a novel host,
that many mutations can expand host range, and that the majority of these mutations cause a decrease in the fitness of φ6 on its original host. I also examined whether the genetic
similarity between the original host of φ6 and a novel host was predictive of characteristics of host range mutations that are important to emergence. I found that as host genetic similarity decreases, fewer mutations are capable of expanding φ6’s host range, the fitness costs these mutations cause φ6 on its original host decrease, and the fitness of these host range mutants on a novel host decreases. Taken together, these results suggest that as host genetic
similarity decreases, viruses should be less successful in colonizing and persisting on a novel host.
Once a virus can grow on a novel host, viral adaptation is often necessary for
φ6 to a novel host until each population acquired a single adaptive mutation. I found that all of these mutations greatly increased the fitness of φ6 on this novel host, that they occur in many genes in the φ6 genome, and that most of these mutations do not reduce the fitness of φ6 on its original host. In conjunction with the data I collected on host range expansion,
these results suggest that the expansion of a virus’ host range will often be the limiting step in successful emergence.
DEDICATION
ACKNOWLEDGEMENTS
This work would not have been possible without the assistance of a large number of individuals. Christina Burch has been a wonderful advisor and provided excellent training,
mentoring, and collaborations throughout my graduate career. Members of the Burch lab, especially Siobain Duffy, Sarah Joseph, and Jennifer Knies have provided valuable
conversations, as well as experimental and writing assistance. A number of other individuals, notably Sarah Diamond, Amanda Ferris, Cris Ledon-Rettig, Ryan Martin, and
Amber Rice all provided comments on various portions of this document. Finally, my committee has provided much-appreciated guidance and training throughout my graduate
TABLE OF CONTENTS
List of Tables ... viii List of Figures ... ix Chapter
1. Introduction and background ...1 2. High frequency of mutations that expand the host range of an RNA virus...21 3. Genetic divergence between a virus’ original and novel host type predicts the characteristics of mutations which expand host range...51 4. Differing genetic basis and fitness effects of expansion and
niche-adaptive mutations ...82
LIST OF TABLES
Table
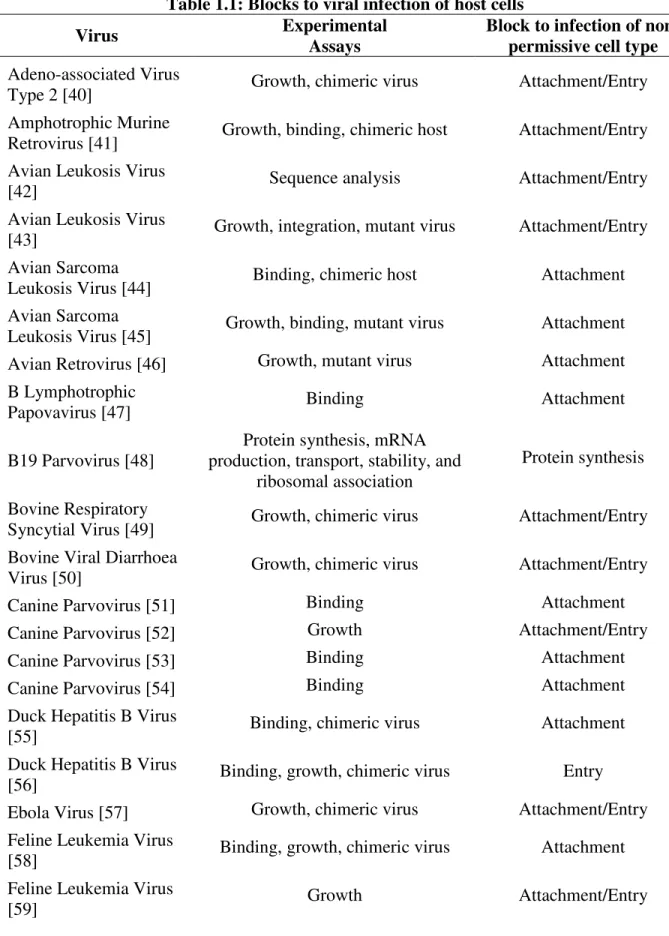
1.1 Blocks to viral infection of host cells ...13
1.2 Pleiotropic fitness effects of mutations...17
1.3 Pleiotropic fitness effects of adapted virus lineages ...19
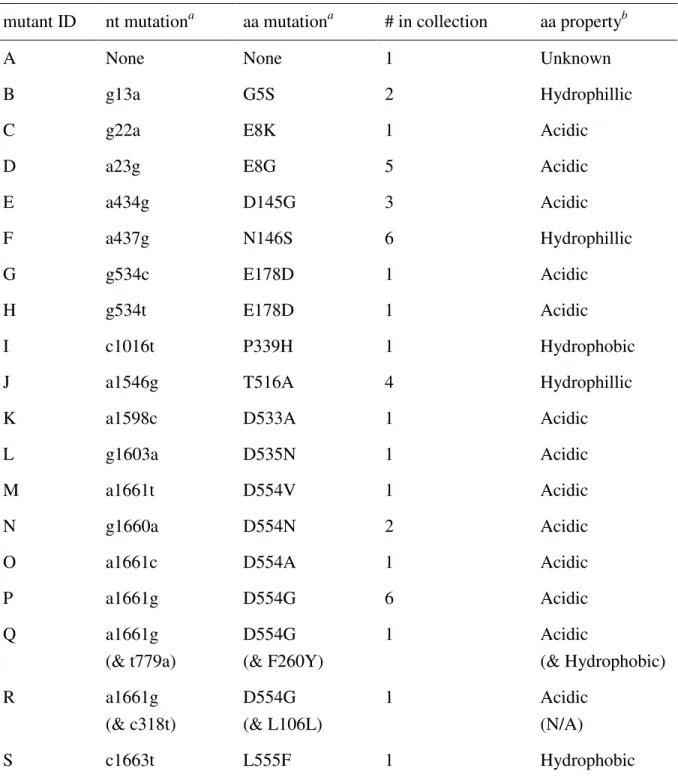
2.1 Sequence changes in the attachment gene P3 of host range mutants ...46
3.1 Per-nucleotide genetic divergence from original host phaseolicola...74
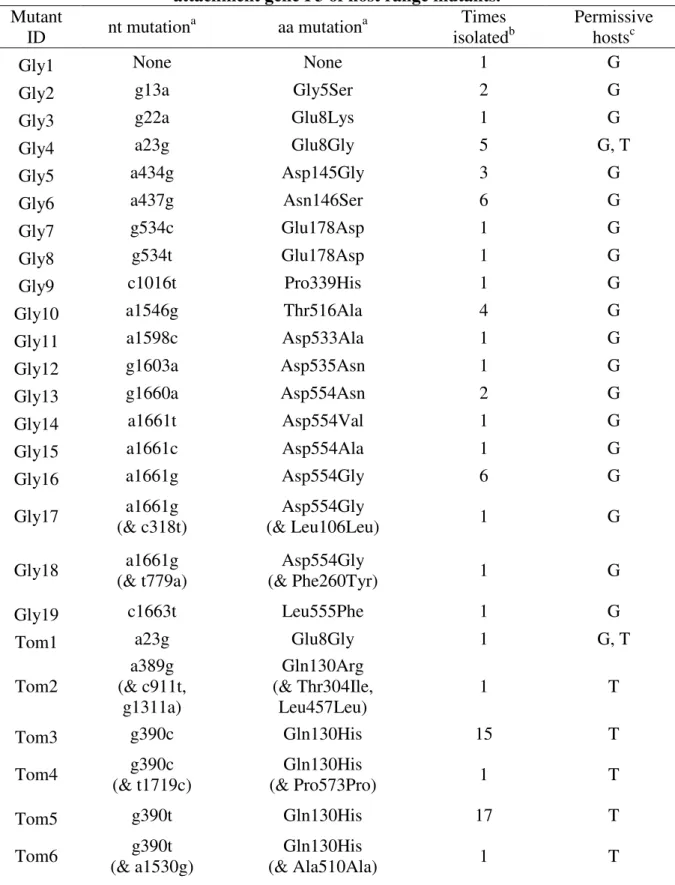
3.2 Host range and sequence changes in the attachment gene P3 of host range mutants...75
LIST OF FIGURES
Figure
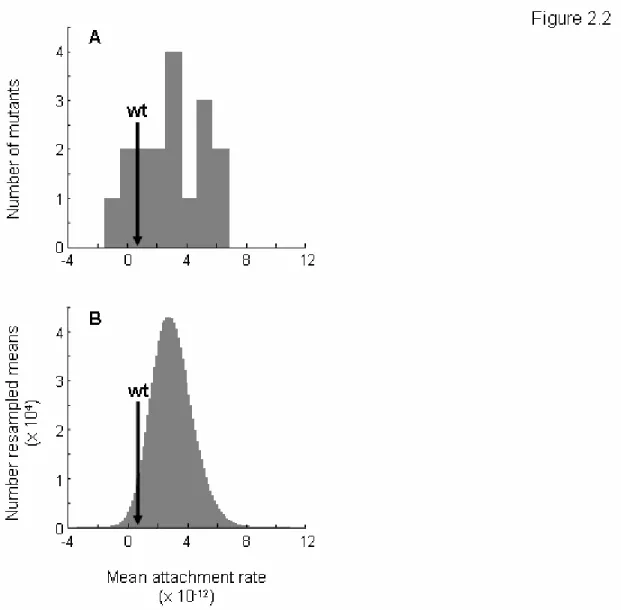
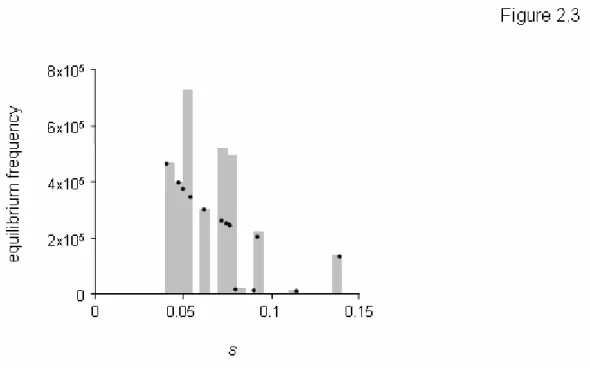
2.1 Correlations between the effects of mutations on different hosts...47 2.2 Attachment to glycinea...49 2.3 Predicted equilibrium frequencies of host range mutations before an
encounter with the novel host ...50 3.1 Characteristics of host range mutations depend on their novel host of
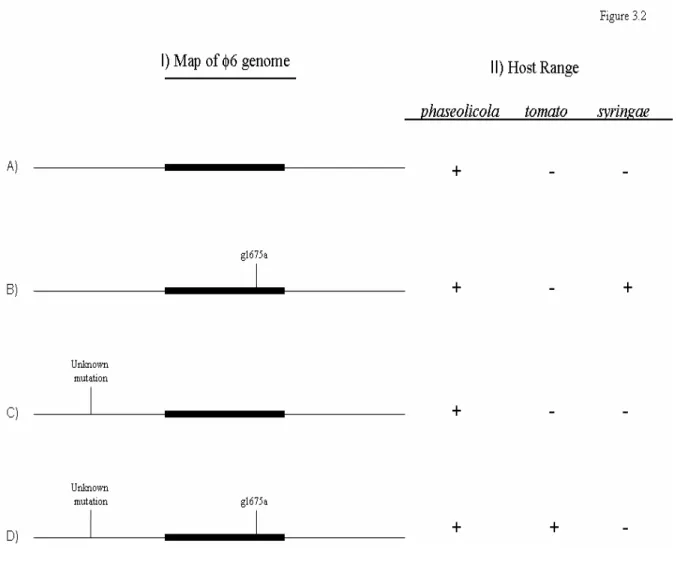
isolation...77 3.2 Epistatic basis of host range expansion ...79 3.3 Predicted equilibrium frequency of host range mutants in a population on
phaseolicola...81 4.1 Adaptive trajectory of a population to glycinea...101 4.2 Pleiotropic fitness effects of glycinea-adaptive and glycinea-expansion
Chapter 1: Background and Introduction
The emergence of disease causing organisms into naïve host populations is a major public health concern[1, 2]. Viral diseases accounted for 44% of recently emergent diseases in the human population [3, 4], including such noteworthy examples as HIV [5] and
Influenza A Virus [6]. In addition, viruses are likely to continue to be an emergence threat, in large part because of the high mutation rates of RNA viruses [7]. Despite concerns over the impact of future emergent viral disease, difficulty in empirically studying the emergence process means that few studies have been able to examine factors associated with emergence (but see [3, 4, 8, 9]).
In this introductory chapter, I attempt to apply the findings of theoretical studies of emergence to empirical results from studies of virus host range. In order to do so, I first summarize the key predictions of emergence success from niche expansion theory. I then examine the literature on the genetic basis and evolution of viral host range to determine whether these studies can address predictions of niche expansion theory. I conclude by describing how my dissertation work attempts to further unify these two bodies.
Evolutionary Ecological theory of disease emergence
Emerging viruses can be defined as viruses which are increasing in frequency on a particular host [4]. Thus emergence includes both the scenario in which a virus first begins to infect a novel host, and the scenario in which the frequency of infection increases from an initial low level on a previously permissive host. Successful emergence can be further defined as occurring when a virus utilizes a host resource so that the virus’ intrinsic rate of increase,R0, on that host exceeds one (i.e. each successful infection produces more than one
The evolutionary-ecology theory of niche expansion [16] simplifies much of the complex nature of emergence by utilizing a classical ecology modeling approach: source-sink models [18]. Under this framework, the environments (hereafter hosts) to which a virus is well adapted (i.e.R0≥1) are source hosts, whereas hosts to which a virus is poorly adapted (i.e.R0<1) are sink hosts. These models have been used to investigate simple scenarios under which transmission of viruses from source to sink hosts occurs, but not vice-versa. Virus populations on a sink host will be exposed to two types of extinction risks- stochastic risks (due to small population sizes) and deterministic risks (due toR0<1). By using this framework, source-sink studies are able to examine the factors that favor the persistence of virus populations on a sink host, as well as the factors that determine whether a virus population can evolve so that a sink host becomes a source host.
Emergence requires the transmission of viral colonists from a source to a sink host. Both the number of individuals transmitted per transmission event and the frequency of transmission events are important to emergence, as these two factors buffer colonizing viruses from extinction on a sink host [12, 16]. Specifically, it has been shown that large numbers of colonists increase a virus’ ability to successfully emerge on any sink host and are required for successful emergence on harsh sink hosts (i.e.R0<<1) [12].
Theory also suggests that adaptation to a sink host will play a large role in the probability of emergence, with several factors having been shown to influence the likelihood of this adaptation. First, the absolute fitness of viruses on a sink host influences the
adaptive mutations appearing in this population [10]. Second, the rate of transmission of sink-adaptive mutations from source populations influences the likelihood of adaptation because continual migration to the sink host can provide more adaptive variation than mutations arising de novo on the sink host [13, 14, 16, 19]. Finally, the degree to which adaptive mutations improve fitness on the sink host will be important in determining emergence success because adaptive mutations of small effect are at an increased risk of elimination due to genetic drift and ecological effects (e.g. Allee effects) on the sink host [13, 14].
In sum, this collection of theoretical studies has highlighted several factors that can influence the emergence success of viruses in novel host populations. These factors include:
- The number of viruses transmitted to a sink host per transmission event - The frequency of these transmission events
- The fitness of a virus on a sink host
- The ability of a virus to adapt to a sink host.
I now review empirical studies of virus host range to determine whether the abundant molecular genetic data sufficiently address the genetic basis of factors important to emergence.
Viral genetics literature review
added relevant studies cited by these papers to this collection. An examination of these studies revealed three types of data relevant to virus emergence. The majority of these studies identified the genetic basis of virus host range. Other studies measured the change in a virus’ fitness on a number of hosts following many generations of adaptation. Finally, other studies identified mutations which increased viral fitness on one host, and measured the effects of this mutation on the virus’ fitness on a number of hosts. In total, I identified 72 studies of the genetic basis of host range, 25 studies of evolutionary patterns of host usage, and 15 studies which identified the effects of single mutations on host usage.
These studies include a range of viral species, experimental designs, and
methodologies. Therefore it is important to determine how the results of these studies differ from theoretical expectations. While theoretical studies base their predictions on an explicit 2 host, source-sink framework, molecular genetic studies diverge from this framework. Due to a number of constraints, empirical studies of virus host range substitute the cellular tropism of viruses (the ability of a virus to bind, enter, replicate in, and escape from a host cell in tissue culture) for the more inclusive definition of host range (transmission between host organisms, avoidance of the immune system, and successful replication within a
To reconcile these differences between theoretical assumptions and empirical designs, I adjusted my analyses in two ways. First, although the studies I identified investigated the cellular tropisms of viruses, I consider (and refer to) the cell types used in these studies as hosts. Second, as source hosts were not explicitly defined in these empirical studies, when I examine the results of studies where virus fitness was measured on a number of non-selective hosts, I analyze the fitness effects on all non-selective hosts (pleiotropic fitness effects) used in the study. Although such an approach is not optimal for applying these empirical data to theoretical predictions, it does allow me to draw some conclusions regarding the theoretical framework of emergence because the fitness effects that sink-adaptive mutations have on a source host are one specific case of pleiotropic fitness effects. I now review the studies I collected to investigate: 1) the genetic basis of viral host range, 2) the pleiotropic fitness effects of host range evolution, and 3) predictors of these pleiotropic fitness effects.
Genetic basis of host range
occurred at attachment and entry [20, 21], while blocks to Measles infection only occurred at attachment and entry [22, 23]), and also within a virus species, but between novel hosts (e.g. Foot and Mouth Disease Virus shows blocks at both attachment [24] and RNA synthesis [25] in different cell types).
Pleiotropic fitness effects of host range evolution
Studies of the evolution of virus host range have identified the pleiotropic fitness effects of mutations that adapt a virus to a host. In particular, we want to know whether mutations that are adaptive on a novel (sink) host are costly on a standard (source) host. The fitness effect that a sink-adaptive mutation has on a virus growing on a source host will determine this mutation’s frequency in a source population. In turn, this frequency will determine how often such a mutation is likely to be transmitted from a source host to a sink host. In particular, if a sink-adaptive mutation is costly on a source host, it will be at a very low frequency in a source population and therefore unlikely to be transmitted.
studies containing 46 individual lineages that were adapted to a host and had their patterns of pleiotropic fitness change measured across a number of hosts (Table 1.3). These lineages showed a variety of pleiotropic fitness changes on alternate hosts, with 19 lines showing adaptation to an alternate host, 8 lines showing no change in fitness on an alternate host, and 40 lines losing fitness on an alternate host.
Although these data sets do not allow determination of whether viral species exhibit different pleiotropic effects, there is abundant variation within a virus species, depending on the alternate hosts fitness was measured on. In addition, studies that identified multiple mutations showed that there was variation in pleiotropic fitness effects depending on the identity of the mutation (e.g., Murine Leukemia Virus mutations beneficial on one host were deleterious on different numbers of alternate hosts [26]). From an emergence standpoint, the variation in these data suggests that the frequency of a sink-adaptive mutation in a source population will depend on the identities of the source and sink hosts, as well as the mutation in question.
Predictors of pleiotropic fitness effects
use. I determined whether either of these categories is associated with deleterious pleiotropic fitness effects.
The viral genes in which the sink-adaptive mutations occur might cause differences in the pleiotropic fitness effects of these mutations. Specifically, extracellular host components (those involved in virus attachment and entry) are expected to be more divergent between species than intracellular host components. As a result, mutations that adapt a virus to a sink host’s extracellular components might be expected to cause more deleterious pleiotropic fitness effects than mutations that adapt a virus to a sink host’s intracellular components. I determined whether the mutations identified in Table 1.2 occurred in viral structural genes (those likely to interact with extracellular components), or non-structural genes (those likely to interact with intracellular components). 13 out of 19 structural mutations and 4 out of 6 non-structural mutations showed a deleterious pleiotropic fitness effect. A χ2
test failed to show that structural and non-structural mutations did not have different chances of exhibiting a deleterious pleiotropic fitness effect (χ2
1=0.006, P=0.94).
The transmission of sink-adaptive mutations from a source to a sink host is important both for mutations that expand a virus’ host range (expansion mutations), and also for
mutations that adapt a virus to a sink host (adaptive mutations). A study of emergence into human populations observed that zoonotic viruses (those already able to infect humans) are more likely to be emerging than viruses newly infecting humans [4]. One possible
effects between expansion and adaptive mutations, I classified the mutations identified in Table 1.2 as either expanding a virus’ host range, or further adapting a virus to a host. 4 out of 7 adaptive mutations and 13 of 18 adaptive mutations showed a deleterious pleiotropic effect. A χ2
test failed to show significant differences between expansion and adaptive mutations in the likelihood of showing a deleterious pleiotropic fitness effect (χ2
1=0.527, P=0.47).
Conclusions
In this chapter, I have summarized a theoretical framework of niche expansion which can be used to address questions of disease emergence. I also reviewed results from studies of the genetic basis and evolution of virus host range. Taken as a whole, these empirical studies show that there is considerable variation between virus species, as well as within a virus species across hosts, in both the genetic basis of host range and the pleiotropic fitness effects of viral adaptation to a host. However, it is not obvious which viral or host characters are predictive of this variability. Furthermore, despite this variation, it is difficult to directly apply these empirical data to the theoretical framework of niche evolution.
The difficulty I found in reconciling empirical and theoretical literature is not
just the source hosts relevant to emergence theory. Second, although I could classify the general nature of the pleiotropic fitness effects of sink-adaptive mutations, I could not compare the magnitude of these mutations effects. Finally, given the extensive variation observed in the pleiotropic fitness effects of sink-adaptive mutations, the fact that only one or a few mutations were identified in most of these studies makes it difficult to generalize from these results.
Despite drawbacks in the design of previous studies, designing empirical experiments with niche expansion theory in mind should allow empirical studies to precisely examine the genetic basis of factors important to emergence. Specifically, an ideal study would identify a large collection of sink-expansion or sink-adaptive mutations and characterize the magnitude of these mutations’ fitness effects, both in the sink host and in a more reasonable
approximation of the source host. Such a study would be able to address both the frequency of these mutations in the source population (a major component of transmission rate) and the fitness of these viruses on the sink host, both critical predictors of emergence success. In the chapters that follow, I investigate these genetic determinants of virus disease emergence using the bacteriophage φ6. Due to its long history as a molecular [27-31] and evolutionary [32-39] model system, φ6 is an ideal system with which to investigate genetic determinants of virus disease emergence.
In chapter 2, I investigate the genetic basis, phenotypic basis, and fitness
sink-expansion mutations and characterize the fitness effects of these mutations on both the sink host and the source host of φ6. The resulting data enable me to estimate the frequency that these sink-expansion mutations will have in a φ6 population on the source host.
Having shown the suitability of φ6 for investigating the genetic basis of host
expansion, in chapter 3 I investigate characteristics of mutations that expanded φ6 host range to include one of three novel host types. I identify collections of sink-expansion mutations that allow growth on one of three novel (sink) hosts, and characterize the fitness effects of these mutations on the sink hosts and the source host of φ6. Based on these data, I show that the genetic distance between φ6’s source and sink hosts is predictive of both the frequency of sink-expansion mutations in a φ6 population on the source host and the fitness of these mutations on the sink host.
Finally, in chapter 4, I compare the characteristics of mutations that expand φ6 host range to include the novel host P. syringae pv. glycinea to those mutations that adapt φ6 to P. syringae pv. glycinea. I identify a collection of sink-adaptive mutations and characterize the
fitness effects of these mutations on both the sink host and source host of φ6. I then
Table 1.1: Blocks to viral infection of host cells
Virus Experimental
Assays
Block to infection of non-permissive cell type Adeno-associated Virus
Type 2 [40] Growth, chimeric virus Attachment/Entry
Amphotrophic Murine
Retrovirus [41] Growth, binding, chimeric host Attachment/Entry Avian Leukosis Virus
[42] Sequence analysis Attachment/Entry
Avian Leukosis Virus
[43] Growth, integration, mutant virus Attachment/Entry Avian Sarcoma
Leukosis Virus [44] Binding, chimeric host Attachment Avian Sarcoma
Leukosis Virus [45] Growth, binding, mutant virus Attachment Avian Retrovirus [46] Growth, mutant virus Attachment B Lymphotrophic
Papovavirus [47] Binding Attachment
B19 Parvovirus [48]
Protein synthesis, mRNA production, transport, stability, and
ribosomal association
Protein synthesis Bovine Respiratory
Syncytial Virus [49] Growth, chimeric virus Attachment/Entry Bovine Viral Diarrhoea
Virus [50] Growth, chimeric virus Attachment/Entry
Canine Parvovirus [51] Binding Attachment
Canine Parvovirus [52] Growth Attachment/Entry
Canine Parvovirus [53] Binding Attachment
Canine Parvovirus [54] Binding Attachment
Duck Hepatitis B Virus
[55] Binding, chimeric virus Attachment
Duck Hepatitis B Virus
[56] Binding, growth, chimeric virus Entry
Ebola Virus [57] Growth, chimeric virus Attachment/Entry Feline Leukemia Virus
[58] Binding, growth, chimeric virus Attachment
Feline Leukemia Virus
Feline Leukemia Virus
[60] Binding, growth, chimeric virus Attachment
Feline Leukemia Virus
A [61] Binding Attachment
Foot and Mouth Disease Virus [24]
Binding, growth, chimeric virus,
mutant virus Attachment
Foot and Mouth Disease Virus [25]
Growth, RNA synthesis, mutant
virus RNA synthesis
Hepatitis B Virus [62] Growth, chimeric virus Attachment/Entry Hepatitis B Virus [63] Growth, transfection, chimeric vurs Attachment/Entry
HIV [64] Growth, mutant virus Attachment/Entry
HIV [65] Growth, mutant virus Attachment/Entry
HIV[66] Entry, transcription, genome
integration Genome preparation
Human Adenovirus 2
[67] mRNA production and processing mRNA processing
Human
Cytomegalovirus [68]
DNA replication, viral promoter
function, protein production DNA replication Human Rotavirus RV-3
[69] Binding, growth, chimeric virus Attachment
Influenza A Virus [70] Growth Attachment/Entry
Influenza A Virus [71] Binding Attachment
Influenza A Virus [72] Binding Attachment
Influenza A Virus [73] Binding, growth, chimeric virus, mutant virus Attachment/Entry
JC Virus [74] Growth, mutant virus Attachment/Entry
Measles [75] Binding, growth Attachment/Entry
Measles [22] Growth, chimeric virus Attachment/Entry
Measles [23] Binding Attachment
Minute Virus of Mice
[76] Growth, DNA virus, chimeric virus Attachment/Entry Minute Virus of Mice
[77] Binding, entry, DNA replication Uncoating
Moloney Murine Leukemia Virus [78]
Binding, gene expression, chimeric
virus Attachment/Entry
Moloney Murine Leukemia Virus [79]
Growth, DNA production, chimeric
virus Genome replication
Murine Hepatitis Virus
[81] Growth Attachment/Entry
Murine Hepatitis Virus
[82] Growth, chimeric virus Attachment/Entry
Murine Hepatitis Virus
[83] Binding, growth, chimeric virus Attachment
Murine Leukemia Virus
[84] Growth, chimeric virus Attachment/Entry
Murine Leukemia Virus
[85] Growth, chimeric virus Attachment/Entry
Murine Leukemia Virus
[86] Growth, chimeric virus Attachment/Entry
Murine Parvovirus [87] Growth, transfection, protein production, chimeric virus DNA replication
Norwalk Virus [88] Binding Attachment/Entry
Parainfluenza Virus [89] replication, virion assembly Protein synthesis, genome Genome replication/Virion assembly Polio Virus [90] Binding, uncoating, RNA release Uncoating
Polio Virus [91] mRNA synthesis, protein synthesis, mutant virus Protein synthesis
Polyomavirus [92] DNA replication DNA replication
Procine Endogenous
Retrovirus [93] DNA replication, RNA synthesis DNA replication RD114 virus [94] Growth, RNA synthesis, protein synthesis Attachment/Entry Rhinovirus type 16 [95] Growth, chimeric host Attachment/Entry
Ross River virus [96] Binding, growth Attachment/Entry
Rous Sarcoma Virus
[97] Growth, chimeric virus Attachment/Entry
Ruminant Lentivirus
[98] Binding, cell fusion, chimeric host Attachment/Entry SARS Coronavirus [99] Growth, RNA synthesis, chimeric virus Attachment/Entry Simian
Sarcoma-Associated Virus [100] Growth, chimeric virus Attachment/Entry Sindbis Virus [101] Growth, protein synthesis, virion assembly and exit, mutant virus Virion assembly/exit Sindbis Virus [102] Growth, mutant virus, mutant host Virion assembly SIV [103] Binding, cell fusion, chimeric virus,
SIV [104]
Vaccinia virus [105] Protein synthesis mRNA synthesis
Vaccinia virus [20]
Cell entry, genome replication, RNA synthesis, protein synthesis,
chimeric virus
Protein synthesis
Table 1.2: Pleiotropic fitness effects of mutations Fitness effect of mutation
on alternate hosts Virus Mutation
Type
Gene occurring
in Beneficial
Deleterious Neutral Selective Environment Avian Sarcoma Leukosis Virus[45]
Expansion Structural 6 0 1
Passaged simultaneously
on two host types Dengue
Virus [106]
Adaptive
Non-structural 2 1 0 Mutant Screen
Hepatitis A Virus [107]
Adaptive
Non-structural 0 0 1
Passaged on one host type Hepatitis A
Virus [108]
Adaptive
Non-structural 0 1 1
Passaged on one host type Adaptive
Non-structural 0 1 1
HIV [65] Expansion Structural 0 1 0 Natural Isolate
HIV [109] Expansion Structural 0 0 1 Passaged on
one host type Influenza
A Virus [72]
Adaptive Structural 0 0 1 Natural Isolate
Influenza A Virus [110]
Expansion
Non-structural 0 0 1
Passaged on one host type Moloney
Murine Leukemia Virus [79]
Expansion
Non-structural 0 1 0
Passaged on one host type Moloney
Murine Leukemia Virus [111]
Adaptive Structural 1 0 1 Passaged on
one host typea
Murine Leukemia Virus [112]
Expansion Structural 0 1 0 Mutant Screen
Murine Leukemia Virus [26]
Expansion Structural 1 7 0 Mutant Screen
Expansion Structural 1 7 0
Expansion Structural 2 5 1
Expansion Structural 3 4 1
Poliovirus Type 1 [90]
Expansion Structural 0 1 0 Natural Isolate
Expansion Structural 0 1 0
Poliovirus Type 1 [113]
Expansion Structural 2 0 1 Passaged on
one host type
Expansion Structural 2 0 1
Expansion Structural 2 1 0
Expansion Structural 2 1 0
Ross River
Virus [96] Expansion Structural 1 1 0
Passaged on one host type
Expansion Structural 2 1 0
a
Table 1.3: Pleiotropic fitness effects of adapted virus lineages Number of alternate hosts on which
Virus fitness increased fitness decreased fitness did not change Selective Environment
African Swine Fever
Virus [114] 0 1 0
Passaged on one host type
0 1 0
0 1 0
Avian Sarcoma
Leukosis Virus [45] 6 0 1
Co-passaged on two host types Hepatitis A Virus
[115] 1 1 0
Passaged on one host type Hepatitis A Virus
[107] 0 0 1
Passaged on one host type Hepatitis A Virus
[108] 0 1
a
1 Passaged on one host type
0 1a 1
HIV [65] 0 1 0 Natural Isolate
HIV [109] 0 1 0 Passaged on one
host type Influenza A Virus
[72] 0 1 0 Natural Isolate
Measles Virus [116] 0 1 0 Passaged on one
host type Moloney Murine
Leukemia Virus [111] 0 1 0
Passaged on one host typeb Moloney Murine
Leukemia Virus [79] 0 0 1
Passaged on one host type Mouse Hepatitis
Virus [117] 4 1 0
Co-passaged on two host types Mouse Hepatitis
Virus [118] 6 1 0
Passaged on one host type Murine Leukemia
Virus [85] 0 1 0 Natural Isolate
Poliovirus [90] 0 1 0 Natural Isolate
Polyoma Virus [119] 1 1 0 Passaged on one
host type
Ross River Virus [96] 1 1 0 Passaged on one
host type
Sendai Virus [120] 0 1 0 Passaged on one host type
Sindbis Virus [121] 0 1 0 Passaged on one
host type
SIV [122] 0 1 0 Passaged on one
host type
Vaccinia Virus [123] 2 10 3 Passaged on one
host type Vesicular Stomatitis
Virus [124] 0 1 0
Passaged on one host type Vesicular Stomatitis
Virus [125] 0 2 0
Passaged on one host type
0 2 0
0 2 0
0 2 0
0 2 0
0 2 0
0 2 0
0 2 0
1 1 0 Passaged on two
host types
1 1 0
1 1 0
1 1 0
1 1 0
1 1 0
1 1 0
1 1 0
Vesicular Stomatitis
Virus [126] 2 0 0
Passaged on one host type
1 0 1
1 0 1
Yellow Fever Virus
[127] 0 1 0
Passaged on one host typeb a
Fitness measured on animal host b
Chapter 2: High frequency of mutations that expand the host range of an RNA virus
Abstract
The ability of a virus population to colonize a novel host is predicted to depend on the equilibrium frequency of potential colonists (i.e. genotypes capable of infecting the novel host) in the source population. In this study, we investigated the determinants of the equilibrium frequency of potential colonists in the RNA bacteriophage φ6. We isolated 40 spontaneous mutants capable of infecting a novel Pseudomonas syringae host and sequenced their host attachment genes to identify the responsible mutations. We observed 16 different mutations in the host attachment gene and used a new statistical approach to estimate that 39 additional mutations were missed by our screen. Phenotypic and fitness assays confirmed that the proximate mechanism underlying host range expansion was an increase in the ability to attach to the novel host, and that acquisition of this ability most often imposed a cost for growth rate on two standard hosts. Considered in a population genetic framework, our data suggest that host range mutations should exist in phage populations at an equilibrium frequency (3×10⁻⁴
) that exceeds the phage mutation rate by more than two orders of magnitude. Thus, colonization of novel hosts is unlikely to be limited by an inability to produce appropriate mutations.
Introduction
will likely come from the application of ecological models that describe the colonization of sink habitats to the study of emerging pathogens [129]. In this study, we focus on one of the primary predictors of colonization success in these models [13-15, 19]: the rate of migration into the novel habitat.
In particular, we consider the scenario in which the ability to infect a novel host requires a mutation. In this case, the migration rate will depend jointly on the rate at which viruses are transmitted to the novel host and on the equilibrium frequency of potential colonists (i.e. genotypes capable of infecting the novel host) in the source population. Although transmission rate is determined by ecological factors that must be measured in the field, the equilibrium frequency of potential colonists is determined by two evolutionary factors that can be investigated in the laboratory: mutation and selection. Mutation will act to increase the frequency of potential colonists. In contrast, if the ability to infect a novel host imposes a pleiotropic fitness cost on the standard host, selection will act to reduce the frequency of potential colonists. An equilibrium will be achieved when the effects of mutation are exactly balanced by the effects of selection. Therefore, the equilibrium
frequency of potential colonists in a population growing on its standard host will depend on the mutation rate, the number of different mutations that confer the ability to infect the novel host, and on the abundance and magnitude of pleiotropic fitness costs among these
mutations.
of these investigations make them unsuitable for predicting equilibrium frequencies of potential colonists in natural populations. First, investigations of mutations that expand host range have tended to examine only one or a few mutations, making it difficult to infer whether other mutations are possible. Second, the mutations examined in these studies were usually the result of long term adaptation in a laboratory or natural setting (i.e. fixed
mutations). Fixed mutations have been sieved by natural selection acting on one or both of the standard and novel hosts, and therefore, it is likely that the distribution of pleiotropic fitness costs among fixed mutations will differ from the distribution among new spontaneous mutations. Finally, in most of these investigations fitness was assayed in tissue culture, which likely mimics the natural environment to only a limited extent.
Materials and Methods
Strain and Culture Conditions
The double-stranded RNA bacteriophage φ6 (Cystoviridae) used in this study is a laboratory genotypedescended from the original isolate [131]. The standard laboratory host of φ6, Pseudomonassyringae pathovar phaseolicola strain HB10Y, was obtained from the American Type Culture Collection (ATCC; no. 21781); an alternate permissive host, P. syringae pathovar japonica strain M301072, was obtained from D. Guttman (University of
Toronto, Toronto, CA); and the novel host P. syringae pathovar glycinea strain R4a was obtained from J. Dangl (University of North Carolina, Chapel Hill, NC). Hereafter, hosts will be referred to by their pathovar designations. Details of diluting, filtering, culture, and storage of phageand bacteria are published [27, 33]. Phage and bacteria were cultured in LC media (5 g yeast extract, 5 g NaCl, and 10 g Bacto-tryptone per L of H2O), and stored in 4:6 glycerol:LC media (v/v) at -80oC and -20oC, respectively. For growth on plates, phage were mixed with the appropriate host bacteria in top agar (0.7% agar) and plated on LC plates (1.5% agar).
Mutant Isolation
φ6 clones were plated onto a lawn of the standard (permissive) host phaseolicola,
from this plaque were plated on a fresh lawn of glycinea to purify the mutant phages of wild type φ6. A single plaque was harvested and stored for later use in 4:6 glycerol:LC media (v/v) at -20° C. This process was repeated 40 times to obtain 40 independent host range mutants.
Sequencing
Genome amplification and sequencing were performed as previously described [130]. Briefly, phage were grown to a high titer and viral RNA was extracted using a QIAamp Viral RNA Mini Kit (QIAGEN Inc., Valencia, CA). Viral RNA was reverse transcribed using random hexamer primers and Superscript II RNase H- RT (Invitrogen, Carlsbad, CA), and the resulting cDNA was used as template for PCR with Taq Polymerase (Invitrogen,
Carlsbad, CA). We amplified three sections of the medium genome segment, corresponding to bases 1298-2142, 2042-3052, and 2877-3873, which encompassed the host attachment gene, P3. PCR products were purified using EXO-SapIT (US Biological, Swampscott, MA) and sequenced in both directions using PCR primers and primers internal to each amplicon. Sequencing was performed using BigDye v3.1 (Applied Biosystems, Foster City, CA) either locally with an Avant-3100 Genetic Analyzer Sequencer (Applied Biosystems, Foster City, CA) or at the UNC Automated Sequencing Facility (University of North Carolina, Chapel Hill, NC).
Examining the characteristics of host range mutations
codons with particular chemical properties: acidic (D,E), basic (K, R, H), hydrophilic (N, Q, S, T, Y), or hydrophobic (A, C, F, G, I, L, M, P, V, W).
Paired growth fitness assay
Paired growth assays are a standard method for assaying fitness in φ6 [32], and were used to assay fitness on the permissive host japonica. Each host range mutant was mixed with the wild type φ6 at a 1:1 ratio. This mixture was plated on a bacterial lawn and incubated for 24 hours. The ratio of phage genotypes before and after the incubation was determined by plating on a mixed lawn of 200 µL of a 1:1 mixture of phaseolicola and glycinea, on which the wild type φ6 forms turbid plaques and mutant φ6 form clear plaques.
The relative fitness of mutant genotypes were then determined as W = R1/R0, where R0 and R1 are the ratio of mutant to wild type phage before and after the 24 hour incubation, respectively. Replicate assays (N=4) were collected in blocks on different days.
Plaque size fitness assay
phaseolicola, there is a linear relationship between log(fitness) and plaque area (
log(phage/plaque) = 0.71498 × (plaque size) + 4.34418; R2
= 0.7721, F1,6 = 24.71, p = 0.0025). Plaque sizes were determinedby plating phages onto a lawn of the appropriate host at a low density(<50 phage per plate) to ensure non-overlapping plaques, incubating at 25oC for 24 hours, and taking digital pictures for analysis using ImageJ (NIH, Bethesda, MD,
http://rsb.info.nih.gov/ij/). Each plaque size measure is a mean area of plaques on an
individual plate. For each genotype, six replicate assays were collected in blocks on different days.
Attachment assays
Attachment assays were performed following the method of [132]. An exponentially growing culture of glycinea was incubated shaking at 25oC until it achieved an OD of 0.8 (~5x10⁸ CFU/ml), at which point the bacteria were pelleted and resuspended in ½ the total volume of LC media. 103 phage were added to 1 mL of the concentrated bacterial culture and this mixture was incubated at 25°C with shaking. Immediately and after 40 minutes a 500 µL aliquot of this culture was centrifuged at 5000 rpm, 5°C for 1 minute, and 200 µL of the supernatant was plated on a lawn of phaseolicola cells to obtain a count of the unbound phage remaining in the supernatant. The attachment rate constant was then calculated as
) / ln( ) 40 /(
1 N P40 P0
k =− × , where N is the concentration of bacteria (determined by plating), and P0 and P40 are the number of unbound phage at 0 and 40 minutes, respectively.
Statistical analyses
Fitness data were analyzed in Microsoft Excel 2003 (Redmond, WA) and SASv9.1 (SAS Institute, Cary, NC) using Proc GLM and Proc Corr. All models in SAS included block effects, but none of these block effects were significant. To determine which mutations caused a significant reduction in fitness on permissive host types, relative to the wild type φ6, we calculated least significant differences (LSD). The LSD is the smallest difference between any two means that is statistically significant, and is used for pre-planned comparisons in ANOVA [133]. The t-statistic used to calculate the LSD is determined in the same manner as the t-statistic used in a two sample t-test, except that the Mean Square Error (MSE) is used in place of the sample variance and the degrees of freedom is based on the MSE.
We used Proc GLM (SASv9.1) to conduct a one-way ANOVA to test for an effect of genotype on attachment rate among the phage examined in this study, including the host range mutants and the wild type φ6. In addition, we implemented a bootstrap procedure in Matlab v6.5 (Mathworks, Natick, Massachusetts) to more directly compare the mean
of 8 measures). This p-value is equivalent to the probability that the wild type φ6 attachment rate measures were drawn from the same distribution as the mutant measures.
Estimating the total number of mutations that allow growth on glycinea
Our experiment ran n = 39 independent trials in which one of an unknown number of possible P3 mutations that enable infection of a novel host was sampled randomly. We know that the observed number of mutations is a lower bound on the total number of possible adaptive mutants, and use the pattern of variability in the data to estimate how many such mutants may have been missed.
This statistical problem is analogous to the well known coupon collecting problem [134] in which we have collected a sample of n coupons and observed Kdistinct coupons, with some coupons appearing multiple times in our sample. We now want to estimate the total number of distinct coupons N from which our sample has been drawn. This estimation procedure has been used by wildlife biologists since the 70’s [135] to estimate population sizes of wild populations from samples of trapped animals.
The standard coupon collecting problem makes several simplifying assumptions that must be adjusted to adapt the methodology for the problem at hand. In particular, the
standard problem assumes that every coupon was equally likely to be sampled. However, we know that transition mutations are more likely than transversion mutations and so we expect to sample adaptive transversions less often. Wildlife biologists have made similar
`trap shy’ animals [136]. Below we develop likelihood and method of moments frameworks for estimating the number of mutants that enable infection of a novel host.
Maximimum likelihood (ML). The probability of obtaining any particular collection
of mutations is described by a multinomial distribution governed by the following two rules: 1) each trial can result in one of t + r possible outcomes, where t and r are, respectively, the total number of transition and transversion mutations that enable infection of the novel host; and 2) defining α as the ratio of transitions to transversions, the probabilities of sampling particular transitions and transversions are α/(αt + r) and 1/(αt + r), respectively. If we now let the random variables J= (J1, J2, … JT, ) represent the number of times the T observed
transitions occurred in our data set, and the variables K= (K1, K2, … KR ) represent the
number of times the R observed transversions occurred, then the likelihood of obtaining these observations is:
1 2 1
! 1 ( , , , ) ! ! ! ! ! i i J K T R t r n
L T R
T R
J J J K K t r t r
α α α ∑ ∑ = + + J K
L L (1)
Since α can be estimated from an external data set, we estimated the total number of
mutations that enable infection of the novel host using observed values for α, T, R, J1, J2, …
JT, and K1, K2, … KR, and then determining the values of t and r that maximize this likelihood
(using the R statistical package; http://www.r-project.org/).
based on the sufficient statistics T, R, and N1 will give the same quality of inference. Therefore, we developed a method of moments estimate based on T, R, and N1 which is simpler to calculate and should give the same quality of inference as maximum likelihood. Using the method of moments estimator, the expectations for T, R, and N1 are as follows:
1 ˆ ˆ 1 ˆ ˆ N r t t t T + − − = α α (2) 2 ˆ ˆ 1 1 ˆ ˆ N r t r r R + − − = α (3) 1 ˆ ˆ ˆ t N n t r α α = +
(4)
The formulas are not too difficult to interpret. The number of transitions that you observe (T) approximates the average number of observed transitions E T( ), where E T( ) is total number of transitions that exist (t) minus the expected number of transitions that were missed due to sampling error. The probability of missing a particular transition in each of the N1 trials is (1 − α/( αt + r))N1, so the mean number missed is t(1 − α/( αt + r))N1.
Rearranging equation (3) gives N1/ntˆ=α/(αtˆ+rˆ), and substituting this into equation (1) gives
(
)
11/ ˆ
1 ˆ
ˆ T t N nt N
t = + − (5)
This equation was solved iteratively by starting with tˆ0 =T and defining
(
)
11
1 ˆ 1 / ˆ
ˆ N
k k
k T t N nt
t + = + − (6)
and tˆ=limk→∞tˆk. Because α was obtained from external data, rˆwas determined by ˆ
=
1
2ˆ
ˆ N
t N
r=α . (7)
We used a parametric bootstrap to determine a 95% confidence interval for these estimates. The bootstrap assumes that the estimates of tˆ and rˆ are the true values and generates simulated datasets based on tˆ, rˆ, and the known α. We generated 1000 simulated datasets of 39 sampled mutations, and estimated tˆ and rˆ for each dataset using equations 4 – 6. Upper and lower 95% confidence limits were calculated, respectively, as the 26th lowest and 975th highest bootstrapped estimates.
Results
Mutant Identification
Number of mutations capable of expanding host range
Because several mutations were represented more than once in our collection, we could use the sampling distribution of particular mutations to estimate the total number of ways that the φ6 P3 gene can be mutated to allow infection of the novel host glycinea. This estimation problem is analogous to the ‘coupon collecting problem’ that is well known in probability and statistics, except that we divided the mutations into two rate classes: transitions and transversions. From an external data set we know that the relative rate of transitions per transition site to transversions per transversion site (α) is 24.5 [39]. We used the method of moments (MM) to estimate the total number of transitions (tˆ) and
transversions (rˆ) that allow infection of glycinea from the sampling distribution and α (we report maximum likelihood (ML) estimates for comparison). Recall that we observed eleven transitions and 5 transversions in our mutation sample. The MM estimate of tˆ was 11.9, with a 95% confidence interval of 11.0 ≤ t ≤ 14.0 (using ML, tˆ = 11.0). The similarity between our estimate of tˆ and the observed number of transitions (11) is consistent with the observation that particular transition mutations were represented as many as eight times in our collection. The MM estimate of rˆ was 42.9, with a 95% confidence interval of 7.8 ≤ r ≤ 103.5 (using ML, rˆ = 41.9). Our estimate of rˆ was much higher than the observed number of transversions (5), an observation that is not surprising since no transversions were
gene. This means that 55/4380, or 1.3% of non-synonymous mutations in P3 are predicted to confer the ability to grow on the novel host glycinea.
Note that the value of α used here is itself an estimate, and there is some degree of uncertainty associated with this estimate. However, since α was estimated from external data that will be published later, to incorporate the uncertainty in our estimate of α would require an extra layer of mathematical modeling and a complete discussion of the external data set. To stay on point and because it makes no difference to the interpretation of our results, we chose not to incorporate this uncertainty in our calculations of the confidence intervals surroundingtˆand rˆ . The estimates tˆ = 11.9 and rˆ = 42.9 would remain the same, the confidence intervals surrounding tˆ would be affected only slightly, and the confidence intervals surrounding rˆ were already sufficiently wide to indicate a low confidence in the exact estimate of r. In sum, we take our analysis to provide qualitative support for the intuition that many transversions were missed by our screen; our analysis does not indicate conclusively that exactly tˆ + rˆ = 54.8 mutations confer the ability to infect the novel host glycinea.
Mutation Characteristics
We investigated whether the observed mutations in P3 occurred in amino acid residues with specific chemical characteristics. We used a χ2
test to compare the observed numbers of mutated residues which were acidic (6), basic (0), hydrophilic (2), or
amino acids that mutated differed significantly from the random expectation (χ2
= 34.76, df = 3, p < 0.0001), and resulted from the disproportionately high number of mutations that occurred in acidic residues.
Mutational effects
We measured the fitness of the 18 host range genotypes that resulted in different amino acid sequences (all genotypes except H) on the standard hosts phaseolicola and japonica, and the novel host glycinea. To narrow our focus to only the mutations that
affected host range, we first compared the fitness of the genotypes with two mutations in P3 (Q and R) to that of the genotype with one of the two mutations (P). The fitness of these phages did not differ on any of the hosts (p > 0.2 by a t-test for all 6 comparisons), so we excluded mutants Q and R from all subsequent fitness analyses.
We also examined whether the pleiotropic effects of mutations on phaseolicola and japonica were correlated with the direct effect of mutations on glycinea. The direct effects of
mutations were not significantly correlated with pleiotropic effects on either phaseolicola (Pearson’s r = 0.2245, df = 14, p = 0.3704) or japonica (Pearson’s r = 0.0466, df = 14, p = 0.8543). However , there was a significant positive correlation between the pleiotropic effects on phaseolicola and the pleiotropic effects on japonica (Pearson’s r = 0.7452, df = 14, p = 0.0004).
Phenotypic basis of host range expansion
The fact that most of the mutations responsible for growth on the novel host glycinea were found in the candidate gene P3 suggested host attachment as a candidate mechanistic basis of host range expansion. Measures of the attachment rate constants to glycinea for the wild type φ6 and the 16 focal mutants (genotypes H, Q and R were again excluded) are shown in Figure 2.2A. The mean attachment rate constant of the wild type φ6 was 7.35 x 10 -13
(s.e.m. = 1.24 x 10⁻¹²), a value that fell within the mutant genotype range of -1.53 x 10⁻¹² to 6.77 x 10⁻¹². (Note that the lower bound is mechanically 0, but that negative values can result from error variance).
failed to find a significant difference (F16,54 = 1.75, p = 0.0638). This result suggests that there are few or no differences in attachment rate among these 17 genotypes, however, the ANOVA analysis was not designed to test specifically for a difference between the mutant phage and the wild type φ6.
Therefore, we performed a second analysis to more directly test the hypothesis that the attachment rates of mutant phage were higher than that of the wild type φ6. In this test, we resampled the mutant data to determine how often sampling effects, alone, could produce a mean attachment rate as low or lower than the attachment rate measured for φ6. The distribution of 106 resampled means is compared to the actual wild type φ6 mean in figure 2.2B. The proportion of resampled means that were lower than the actual mean was p = 0.034, confirming that the higher attachment rates observed in mutant phage relative to φ6 did not result by chance, but from a real increase in attachment rates in the mutant phage.
Discussion
In this study we investigated the frequency and nature of mutations that expand the host range of the bacteriophage φ6. Our results corroborate the finding of a recent study in φ6 [130], that host range expansion is usually, but not always, accompanied by a cost on the
adapted. And third, we identified the phenotypic basis of host range expansion, and therefore the proximate cause of the fitness costs, as an increase in attachment rate to the novel host.
These data are particularly relevant to one of the central questions in ecology – understanding the factors that limit the ability of populations to colonize new environments. The answer to this question depends on the abundance of potential colonists, and the extent to which potential colonists are maladapted to novel hosts [19]. Although our results may address the extent of maladaptation on novel hosts, (absolute growth rate on glycinea was 104-fold lower than on phaseolicola over 24 hours, data not shown), we focus on the
implications of our results for the abundance of potential colonists in natural populations. In particular, with an understanding of the mutation rate and number of mutations that expand host range, and of the abundance and magnitude of pleiotropic fitness costs, we make a population genetics prediction for the equilibrium frequency of potential colonists in natural φ6 populations.
Abundance of mutations that expand host range
Although one out of 40 mutants did not have a mutation in the host attachment gene P3, the presence of P3 mutations in the other 39 mutants in our collection provides strong evidence that the P3 mutations were responsible for the host range expansion. Indeed, 7 of the 18 observed P3 mutations were present in multiple mutants, ruling out any other
sequenced a total of 101,610 nucleotides in the mutant genomes and found only 2 second site mutations (one each in mutants Q and R). Assuming that the φ6 mutation rate is consistent across genes, we can infer that there were only 10 second site mutations spread among all 40 mutant genomes (2 second site mutations/101,610 sequenced bases*13,385 bases/genome*40 mutants). Thus, second site mutations appeared in a minority of genomes and do not make a likely alternative to our conclusion that the P3 mutations caused the host range expansions.
We estimated that 55 different nucleotide substitutions in P3 confer the ability to grow on the novel host glycinea. This number represents 1.3% of the possible
non-synonymous mutations in P3. To our minds this estimate is surprisingly high. Imagine that 55 different mutations enabled avian influenza to infect and transmit between humans. It seems likely that the ease with which φ6 mutates to infect glycinea is particular to this virus-host pair, and we can think of two possible reasons why so many mutations confer the ability to grow on the novel host glycinea. First, the ability to grow on glycinea may be acquired through ‘loss of character’ mutations rather than ‘gain of character’ mutations. Second, the close relatedness of glycinea pathovars to our standard phaseolicola host [138] might mean that only slight modifications to P3 are required for growth on glycinea.
enabled attachment. Consistent with this idea, charge loss contributed disproportionately to the observed amino acid substitutions. In addition, if the ability to grow on the novel host was acquired through loss of character mutations, it might explain why the effects of mutations on the standard hosts phaseolicola and japonica were correlated with each other, but uncorrelated with their effects on the novel host glycinea.
An alternative explanation for the large number of mutations that enable growth on glycinea is a close relatedness of the novel host, glycinea, and the standard host,
phaseolicola. A recent 16s rRNA phylogeny [138] of P. syringae pathovars suggests that
glycinea pathovars are closely related to our standard host phaseolicola (note that the
glycinea pathovar used here was not examined in [138], but the 2 glycinea pathovars that
were examined were both closely related to the phaseolicola host used here). φ6 infects its host through the type IV pilus [139] which is chromosomally encoded. Assuming that divergence in the pilus genes reflects divergence in 16s rRNA, the type IV pilus structures of glycinea and phaseolicola should be similar. In this case, only slight modifications to P3
may be required to bind to the similar type IV pilus of the novel host glycinea. If we had used a more distantly related novel host, we suspect that we would have observed fewer mutations capable of allowing growth on that host.
Abundance and Nature of pleiotropic fitness costs
Our results indicate that mutations that enable growth on a novel host are generally characterized by negative (antagonistic) pleiotropic effects for growth on standard
slightly between the two permissive hosts we examined, the general form of pleiotropic effects did not differ. Negative pleiotropy predominated on both phaseolicola and japonica despite a 107-fold difference in absolute fitness of the wild type φ6 on these two standard hosts (data not shown). The high frequency of negative pleiotropy among ours and a previous collection of mutations that expand host range in φ6 [130], provide consistent support for the expectation that adaptation to one host should generally be accompanied by loss of fitness on alternative hosts.
The consistency of negative pleiotropy among the mutations in our collection contrasts with the mixed results of previous studies of host range expansion in which individual mutations were approximately equally likely to exhibit positive and negative pleiotropy [52, 65, 71, 72, 90, 106, 110]. We suspect that the high frequency of AP among mutations that expanded host range in φ6 resulted in part because the proximate mechanism underlying host range expansion was an increase in the rate of attachment to the novel host. Acquiring the ability to attach to a novel host (a new function) is a common mechanism of host range expansion in viruses [140], probably because the host surface is more divergent than components of the host cytoplasm. Further adaptation to a novel host would likely involve adapting to less divergent host cell components and be less characterized by negative pleiotropy. A similar investigation of beneficial mutations in E. coli also indicated that the abundance and form of pleiotropic effects are highly dependent on the proximate mechanism of adaptation [141].
In this study, we investigated the genetic determinants of a major predictor of disease emergence in models of population ecology [129], the rate of transmission into the novel host. We focused on the scenario in which the ability to infect a novel host requires a mutation. In this case, transmission rate depends on the equilibrium frequency in a source population of genotypes capable of infecting the novel host (potential colonists).
By considering our data in a population genetics context, we can predict the
equilibrium frequency of potential colonists in a source population growing on the standard host phaseolicola. Two forces act to determine the equilibrium frequency of potential colonists. Mutation will act to increase the frequency of potential colonists and, if the ability to infect the novel host imposes a pleiotropic fitness cost, selection will act to decrease the frequency of potential colonists. For individual mutations, the equilibrium frequency, qˆ, at which the two forces are exactly balanced is known from population genetics [142] to be
s
strength of selection acting against such mutations is expected to keep them at a relatively low frequency in natural populations.
In addition to predicting the equilibrium frequencies of individual mutations, we used our data to predict the total equilibrium frequency of host range mutations in a source
population growing on the standard host phaseolicola, fˆHR, by summing the equilibrium frequencies over all the mutations in figure 2.3. In this manner, we estimated an equilibrium frequency of mutations that enable infection of the novel host to be fˆHR = 3x10⁻⁴. Note that this equilibrium frequency is slightly underestimated because it does not include the (~39) mutations missed by our screen, but it is only slightly underestimated because most of the missed mutations were transversions. Notice that the estimate of fˆHR = 3x10⁻⁴ is well above the phage mutation rate (µ ≈ 2x10⁻⁶ [35]) because several of the mutations in our collection exhibit very small costs. 38% of the host range mutations present in equilibrium populations are expected to exhibit fitness costs on the standard host phaseolicola of less than 5% (e.g. s < 0.05).
If there is variation in pleiotropic fitness costs, then novel mutations will be characterized by larger pleiotropic costs on average than the standing genetic variation, and laboratory
populations would be expected to exhibit larger fitness tradeoffs among hosts than natural populations. In other words, if pleiotropic fitness costs are not universal among the
mutations that expand host range, we should not expect to observe large fitness tradeoffs in nature. Adaptation to a novel host need not impose fitness costs on the standard host, at least in the short term.
Table 2.1. Sequence changes in the attachment gene P3 of host range mutants. mutant ID nt mutationa aa mutationa # in collection aa propertyb
A None None 1 Unknown
B g13a G5S 2 Hydrophillic
C g22a E8K 1 Acidic
D a23g E8G 5 Acidic
E a434g D145G 3 Acidic
F a437g N146S 6 Hydrophillic
G g534c E178D 1 Acidic
H g534t E178D 1 Acidic
I c1016t P339H 1 Hydrophobic
J a1546g T516A 4 Hydrophillic
K a1598c D533A 1 Acidic
L g1603a D535N 1 Acidic
M a1661t D554V 1 Acidic
N g1660a D554N 2 Acidic
O a1661c D554A 1 Acidic
P a1661g D554G 6 Acidic
Q a1661g
(& t779a)
D554G (& F260Y)
1 Acidic
(& Hydrophobic)
R a1661g
(& c318t)
D554G (& L106L)
1 Acidic
(N/A)
S c1663t L555F 1 Hydrophobic
a
Nucleotide and amino acid substitutions are labeled according to their position in P3. Second site mutations are shown in parentheses.
b
Figure 2.1: Correlations between the effects of mutations on different hosts. (A) and (B) illustrate the relationship between the fitness of mutant phage on the novel host glycinea and one of two standard hosts (phaseolicola or japonica). Data points are means of 4 replicate measures on host japonica, and means of 6 replicate measures on hosts glycinea and phaseolicola. The solid black lines are the mean value of the wild type φ6 on the standard
Figure 2.2: Attachment to glycinea. (A) Frequency distribution of the mean mutant
Chapter 3: Genetic divergence between a virus’ original and novel host type predicts the characteristics of mutations which expand host range.
Abstract
I investigate the characteristics of mutations that expand φ6 host range to include a number of novel host types. I specifically investigate whether the genetic determinants of the ability of φ6 to colonize and persist on three different novel P. syringae hosts were predicted by the relationship between the original host of φ6, and the three novel hosts. I compared collections of host range mutants isolated on each of three novel host types which differed in their genetic distance from the original host of φ6. I found that multiple mutations allowed growth on each novel host type, that many of these mutations imposed a fitness cost on φ6 on its original host, and that these mutations had low fitness on the novel host from which they were isolated. I also found that these three characteristics differed depending on their novel host of isolation. Finally, I determined that the genetic distance between the original and novel host was predictive of the genetic determinants of both φ6’s ability to colonize and persist on a novel host.
Introduction
depends on understanding how these two components predictably differ across novel host types.
Both transmission and persistence should be determined, in part, by the genetic similarity between a virus’ original and novel host (hereafter, host similarity). Specifically, as host similarity decreases, the phenotypic similarity of these hosts will also decrease [151]. This decreasing phenotypic similarity should lead to both a decrease in the transmission of viruses with an expanded host range to a novel host population, and a decrease in the
persistence of these viruses in this novel host population. These two expectations arise from considering the functional effects that host similarity should have on three characteristics of the mutations that expand host range: the number of mutations capable of allowing growth on a novel host, the fitness costs these mutations confer to a virus on its original host, and the absolute fitness viruses with these mutations have on the novel host.
with its’ original host. This increase in effect size should increase the costs these mutations have on the original host. Therefore, with decreasing host similarity there should be fewer mutations which expand host range and these mutations should have greater costs on the original host. Together these results will lower virus transmission to a novel host type.
Once viral host range mutants are transmitted to a novel host, their persistence will depend on their absolute fitness, the ability to successfully produce progeny on that novel host [10, 150]. Progeny production is determined by the success of host range mutants in interacting with a number of novel host components. As host similarity decreases, host range mutants should be less successful in interacting with these novel host components. With a decreasing host similarity, host range mutants should produce fewer progeny, which will lower their persistence in a novel host population.
Evidence addressing the relationship between host similarity and the transmission and persistence of viruses with an expanded host range is both limited and indirect. Broad
genetic predisposition for host expansion) and ecological (e.g. the frequencies of different hosts in an area) factors which have interacted to determine current host ranges. As a result, these broad scale studies have only limited power to address the effects of host similarity on the characteristics of host range mutations.
Laboratory investigations of the genetic basis of viral host range have provided data on some of the characteristics of host range mutations that are important in viral emergence [26, 45, 65, 79, 90, 96, 109, 110, 112, 113]. These studies have identified mutations that expanded viral host range, and measured the fitness effects of these mutations on a number of previously permissive hosts, as well as on the novel host. However, by only examining the effects of one or a few mutations for a single virus-novel host pair and not a virus paired with many novel hosts, these studies cannot be used to investigate how host similarity affects the characteristics of host range mutants.
To investigate the effect of host similarity on the characteristics of host range
mutations, we isolated collections of φ6 host range mutants on each of three novel host types with differing genetic similarities to φ6’s original host, Pseudomonas syringae pathovar phaseolicola. We used these three collections of host range mutations to assess the number