NURSING DIAGNOSES IN THE CARE OF HOSPITALIZED PATIENTS WITH TYPE 2 DIABETES MELLITUS: PATTERN ANALYSIS AND CORRELATES OF HEALTH DISPARITIES
Kennedy O. Onori
A dissertation submitted to the faculty of the University of North Carolina at Chapel Hill in partial fulfillment of the requirements for the degree of Doctor of Philosophy in the School of Nursing.
Chapel Hill 2013
Approved by: _
iii
ABSTRACT
KENNEDY O. ONORI: Nursing Diagnoses in the Care of the Hospitalized Patient with Type 2 Diabetes Mellitus: Pattern Analysis and Correlates of Health Disparities
(Under the direction of Edward J. Halloran, RN, PhD, FAAN)
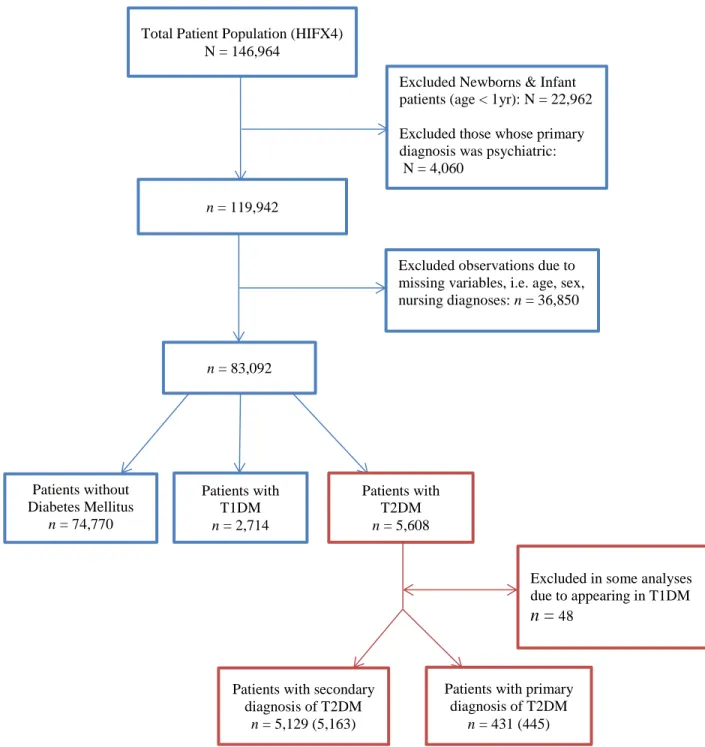
This study examined the human needs of 445 adults admitted to hospital with the primary medical diagnosis of Type 2 Diabetes Mellitus [ICD-9CM 250.0-9] and compared the pattern of nursing diagnoses (human needs) with those of 5321 patients having Type 2 DM but admitted to hospital for other reasons and with the 78,480 inpatients with no DM. Length of hospital stay, intensive care unit use and discharge dispositions were examined, controlling for race, poverty, marital status and age, to determine if the nursing diagnosis variables were distinctive for any of the three patient groups. A subset of 14 nursing diagnoses was identified from the literature on the care of Type 2 DM to determine how they varied among the three groups. The 61 nursing diagnoses were also fitted in regression models to explain variances in patient length of stay and to explore patient diabetes status. A multinomial logistic (logit) regression model that included the predictor variables of patient age, race, marital status, socioeconomic position (insurance type), and sex was used to predict patient discharge disposition.
This study was a secondary analysis of data collected over a three-year period by nurses in the daily assessment and care of their hospitalized patients. Donabedian’s structure, process, and outcome model of quality of care provided the conceptual framework for this study. The statistical software SAS (9.3) was used for the analysis.
Nursing diagnosis use pattern did not consistently distinguish patients with type 2 diabetes mellitus from other patients. Patient information gathered by nurses in the provision of care to their patients is qualitative in nature -with holistic perspective independent of
iv
stay. The number of different nursing diagnoses was the most important predictor of patient length of stay in a model that included patient age, sex, marital status and socioeconomic position.
Patient race, age, and socioeconomic position were predictive of patient discharge disposition (discharge to own home, discharge to home with home health services, discharge to nursing homes, or discharge to other healthcare facility) but not substantially related to patient length of stay. This methodological study has helped address two related questions in the negative; when the disease is known are the needs of the patient known and when the needs of the patient are known, is the disease known?
v
DEDICATION
vi
ACKNOWLEDGMENTS
I am forever grateful to Dr. Edward J. Halloran, my advisor, mentor and committee chair, and without whom this would not have been possible. He believed in me, challenged me, and above all supported me when I thought I could not go on. His words of encouragement and firm handshakes were always reassuring and became welcome parting gifts at the end of each of our discussion sessions. Dr. Halloran’s generosity with his time and resource is inestimable. Many thanks for giving me access to the Nurse-Patient Summary data set, explaining new concepts, and exposing me to the very important work of Virginia Henderson.
Many thanks also to the other members of my dissertation committee, Dr. Lorna Harris, Dr. Shielda Rodgers, Dr. Allison Vorderstrasse, and Dr. Jamie Crandell for their time, thoughtful comments, edits, and above all fresh ideas. Thank you for believing in me enough to want to do this.
And last but not the least, thank you Karen and Kenna for respectively settling for a part-time spouse and a part-part-time dad during this last five years.
vii
TABLE OF CONTENTS
LIST OF TABLES ... x
LIST OF FIGURES ... xii
ABBREVIATIONS ... xiii
CHAPTER 1 ... 1
INTRODUCTION ... 1
Statement of the Problem ... 3
Purpose of the Study ... 5
Research Questions ... 6
Theoretical Framework ... 6
Study Model Overview ... 8
International Classification of Diseases (ICD) and Diagnosis-related group (DRG) ... 10
Nursing Data ... 12
CHAPTER 2 ... 15
REVIEW OF THE LITERATURE... 15
Overview ... 15
Nursing Diagnosis ... 15
Validity of Nursing Diagnosis ... 19
Medical Diagnosis of Diabetes ... 22
Definition ... 24
Diagnosing Diabetes Mellitus ... 26
Patient Factors Affecting Health Outcomes ... 30
Age ... 30
Marital Status and Family/Social Support ... 31
Sex ... 33
Race/Ethnicity ... 34
Education ... 38
viii
CHAPTER 3 ... 42
METHODOLOGY ... 42
Overview ... 42
Research Questions ... 42
Type of Data ... 46
Design ... 47
Sample... 48
Setting ... 49
Data Collection ... 50
Measures and Instruments ... 52
Confounder Variables ... 53
Sources of Confounder Variables in healthcare Database Research ... 56
Dealing with Confounders ... 59
Impact of Nursing Diagnoses on Patient Discharge Disposition ... 59
Variables of Interest ... 61
Data Analysis Plan ... 61
Missing Data ... 65
Human Subjects ... 67
CHAPTER 4 ... 69
RESULTS ... 69
Research Question 1 ... 74
Research Question 2 ... 81
Research Question 3 ... 88
Pearson Correlation between Variables ... 92
Multiple Regression Models ... 93
General Linear Models with Interaction Terms ... 95
Research Question 4 ... 97
Research Question 5 ... 102
ix
DISCUSSION ... 113
Major Findings ... 113
Limitations ... 121
Recommendations for Further Research ... 122
Implication for Practice ... 124
Conclusions ... 125
APPENDICES ... 128
APPENDIX A: Nurse/Patient Summary Sheet ... 128
APPENDIX B: List of Nursing Problems ... 129
APPENDIX C: Needs of All Patients Usually met by Nurses ... 130
APPENDIX D: Descriptive List of Variables... 131
APPENDIX E: Descriptive Statistics of Data Set Including Subsets of Diabetes Patients ... 135
APPENDIX F: Nursing Diagnoses Use Pattern in Three Patient Groups ... 136
x
LIST OF TABLES
Table Page
3.0.1 List of Variables……….……...47
3.0.2 Annual Nurse-Patient Rating During Data Collection……….………….52
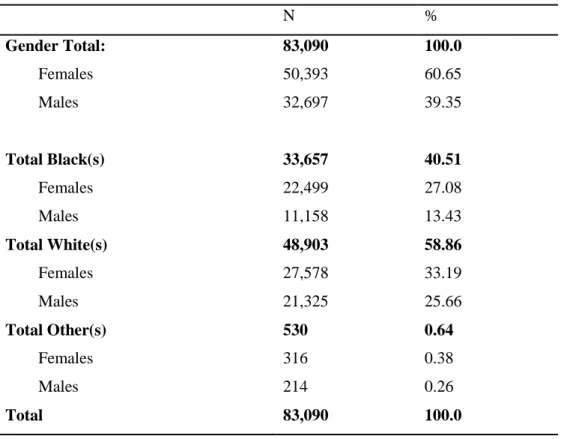
4.0.1 Total Population by Race……….………….72
4.0.2 Patients with Primary or Secondary Diagnosis of Type 2 Diabetes by Race………...73
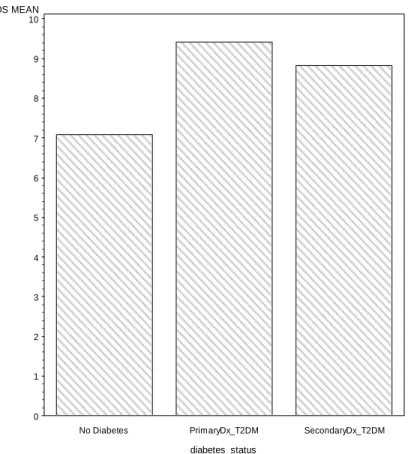
4.1.1 Average Length of Stay (Days) Across Patient Groups……….…...75
4.1.2 Correlation between Age and Length of Stay………...…75
4.1.3 Summary of General Linear Model Results with Interaction Term on Length of Stay………...78
4.1.4 Summary of Relationship of 61 Nursing Diagnoses and Variation in Length of Stay………...…79
4.2.1 Percentage and Relative Importance of key Nursing Diagnoses Across Patient Groups………...83
4.2.2 Analysis of Maximum Likelihood Estimates………86
4.3.1 Mean Age, Length of Stay, and Nursing Diagnoses……….89
4.3.2 Length of Stay across Subgroups of Patients with Primary Diagnosis of Type 2 Diabetes Mellitus………..90
4.3.3 Classification of Insurance Type by Financial Class………....91
xi
4.3.5 Multiple Regression Summary………..94
4.3.6 Parameter Estimates of Variables Affecting Length of Stay………....94
4.3.7 General Linear Model Results for Length of Stay……….…..….95
4.4.1 Group Summary of Model Selection………....99
4.4.2 List of Variables Affecting Variance in Length of Stay……….100
4.4.3 Group Summary of Model Selection with Demographic Patient Variables………….…………..100
4.4.4 List of Variables Related to Patient Length of Stay………....101
4.5.1 Discharge Disposition of Patients………...103
4.5.2 Insurance Type and Class………...104
4.5.3Distribution of Insurance Type by Race………..105
4.5.4 Discharge Disposition by Gender………...106
4.5.5 Discharge Disposition by Race………...106
4.5.6 Discharge Disposition by Insurance Categories………..107
4.5.7 Parameter Estimates of Variables Affecting Discharge Disposition………..108
xii
LIST OF FIGURES
Figure Page
1 The Interrelated Components of Structure, Process, and Outcome………8
2 Interrelated components of Structures Model in Hospitalized Patients Using the Nurse-Patient Summary Dataset………..…8
3 Disorders of Glycaemia: Etiologic Types and Stage……….25
4 Nurse Recording Patient Data using a Bar Code Scanner……….51
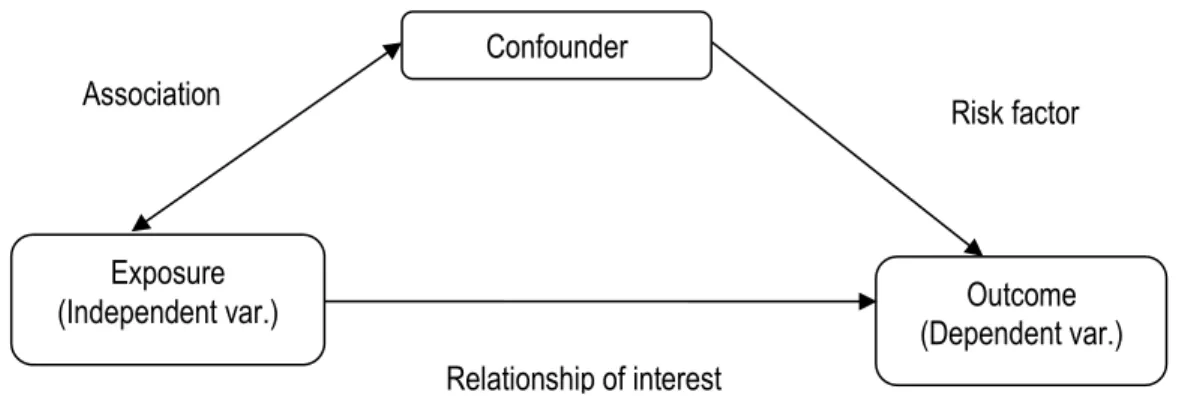
5 Effects of Confounding Variables on Outcome Variable………..54
6 Confounder Variables in Type 2 Diabetes Mellitus Outcome Investigation……….55
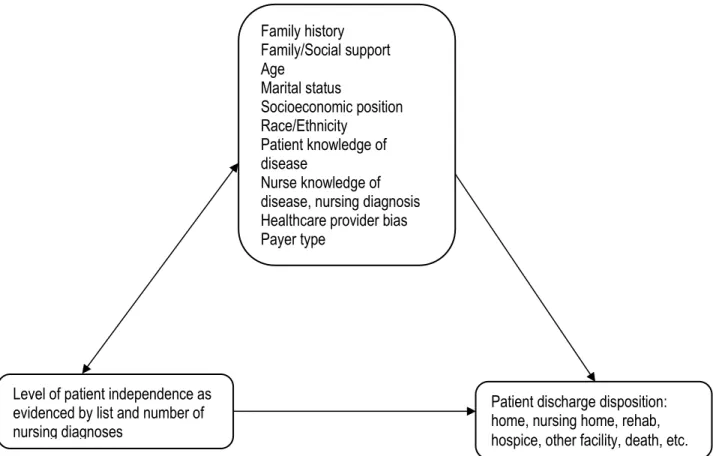
7 Variables potentially affecting Patient Discharge Disposition………..57
8 Patient Distribution Diagram for HIFX4 Dataset………..71
9 Mean Length of Stay across Patient Groups……….76
xiii
ABBREVIATIONS
DRG Diagnosis Related Group
HMO Health Management Organization ICD International Classification of Diseases
ICU Intensive Care Unit
IDDM Insulin Dependent Diabetes Mellitus
NANDA North American Nursing Diagnosis Association NIDDM Non-Insulin Dependent Diabetes Mellitus NMIS Nursing Management Information System
NMDS Nursing Minimum Data Set
NSI Nursing Severity Index
T1DM Type 1 Diabetes Mellitus T2DM Type 2 Diabetes Mellitus
CHAPTER 1
INTRODUCTION
Over the past few decades diabetes has emerged as a major health issue in the United States, and now rivals heart disease, stroke, and cancer as a major cause of death and healthcare expenditure. Diabetes is currently the seventh leading cause of death by disease in the United States (CDC, 2011b), and ranks 5th and 4th as cause of death among Blacks and American Indians or Alaska Natives respectively (CDC, 2011b; Heron, 2012). Diabetes is a
non-communicable disease with huge societal implications, accounting for 7.7 million hospital stays and $83 billion in hospital costs in 2008 (Fraze, Jiang, & Burgess, 2010). According to the Agency for Healthcare Research and Quality (AHRQ) report, hospital stays for patient with diabetes were longer, more costly, and more likely to originate in the emergency department than stays for patient without diabetes (Fraze et al., 2010).
2
people 20 years or older in the United States had diabetes in 2010 (CDC, 2011a). Data from the 2011 National Diabetes Fact Sheet indicate that 1.9 million new case of diabetes were diagnosed among people 20 years or older in 2010 alone (CDC, 2011a). Furthermore, the diabetes
population and diabetes associated expenditure are expected to double within the next 25 years, further stressing an already burdened U.S healthcare system (E. S. Huang, Basu, O'Grady, & Capretta, 2009).
Diabetes is expensive to manage. The increasing healthcare expenditure in the U.S is due in large part to the management of chronic health conditions with diabetes high on the list of diseases. In 2012, the total costs of diagnosed diabetes care was an estimated $245 billion, representing a 41% increase from 2007 figures of $174 billion (ADA, 2013). With a new breakdown of $176 billion in direct medical coats and $69 billion in reduced productivity in the form of disability, work loss, and premature mortality (respectively, $116 billion, and $58 in 2007), these estimates highlights the impact of diabetes on society.
The impact of diabetes on society also has a demographic consequence. Type 2 diabetes disproportionately affects several minority groups. Although diabetes can affect any segment of the population, it is particularly prevalent among Blacks, Hispanic Americans, Native
Americans, and the elderly (Black, 2002). According CDC data from a 2007-2009 national survey, after adjusting for population age differences, the prevalence of diabetes by
3
brief, Fraze and Jiang report that there were 3,232 diabetes-related hospital stays per 100,000 persons from the lowest income quartile compared with 1,762 stays per 100,000 persons from the highest income quartile (Fraze et al., 2010), suggesting that income plays a major role in disease management and an important factor in preventing complications that lead to hospital admissions.
Statement of the Problem
Diabetes is a complex disease and diabetes care is an even more complex proposition with issues beyond glycemic control. A large body of evidence exists that supports a range of interventions to improve diabetes outcomes. These standards of care are intended to provide clinicians, patients, researchers, payers, and other interested individuals with the components of diabetes care, general treatment goals, and tools to evaluate the quality of care (ADA, 2012b). Self-management behaviors (e.g. daily glucose checks and exercise) are the foundation for good diabetes care (CDC, 2011b). Successful self-management of diabetes equates to increased treatment compliance and reduced incidence of complications and hospitalization. Conversely, poor glycemic control and poor disease management often results in diabetes-related
complications and are major reasons for hospitalization and readmissions (Ahern & Hendryx, 2007; H.J. Jiang, Stryer, Friedman, & Andrews, 2003; Tomlin, Dovey, & Tilyard, 2008).
Effective management therefore, offers a way of minimizing both the impact of diabetes on the individual by preventing or delaying the onset of debilitating complications (Nair, 2007) and societal impact of the disease by preventing or delaying expensive complication-related hospitalizations and readmissions (Anderson, 2007; Leff et al., 2009; Paradis et al., 2010;
4
al., 2011; Chiu & Wong, 2010; Han et al., 2010; Henderson & Nite, 1978; Hiss, Armbruster, Gillard, & McClure, 2007; Smeulders et al., 2010), they can have a tremendous impact in improving health outcomes for the hospitalized patient with diabetes. Many studies have linked nursing activities to patient health outcomes (Blegen, Goode, Spetz, Vaughn, & Park, 2011; Brooten & Naylor, 1995; Courtney et al., 2009; Halloran & Kiley, 1985; Welton & Halloran, 2005). By virtue of their close and sustained interactions with their patients, nurses are uniquely positioned to have a more comprehensive assessment of their patients’ physical and psychosocial needs and are therefore important partners with their patients in treating and managing this very complex disease.
5
Purpose of the Study
Given the importance of patient data collected by nurses particularly in guiding nursing interventions and informing discharge planning, it is hypothesized here that the complexity of selected nursing diagnoses is related to patient illness severity and therefore has some influence on health outcomes and subsequently, patient discharge disposition. A patient’s discharge disposition is affected by many factors, prominent of which are the patient’s disease, length of stay, level of independence at discharge, and other patient characteristics such as age, sex, marital status, and payer type. An understanding of the relationship between the patterns of nursing diagnoses and patient factors can shed light on the decision process for patient discharge disposition. For example, it is important to know how the diagnosis of non-compliance, altered health maintenance or knowledge deficit affects patient’s level of independence, and how this interacts with the above listed patient factors to decide the discharge disposition of the patient with diabetes. Successfully linking nursing diagnoses to nursing interventions that affect patient outcomes, might also further underscore the importance of nursing diagnoses as valuable patient data that are indicative of the quality of care provided by nurses.
Demonstrating that patients’ information, for example, nursing diagnoses has value in differentiating patients with the same medical conditions might be indicative of the importance and uniqueness of nursing data. This might support the argument that nursing activities and indeed nursing information are independent of the medicine model and merits inclusion in the Uniform Hospital Discharge Data set (UHDDS).
This study therefore, examines (1) the relationships between nursing diagnoses use pattern and patients’ International Classification of Diseases 9th
6
hospital length of stay, age, marital status, race/ethnicity, payer type, and discharge disposition, and (3) the relationships between patients’ factors and patients’ discharge disposition.
Research Questions
The research questions (RQ) are:
RQ1: Can nursing diagnoses use pattern distinguish patients with primary diagnosis of type 2 diabetes mellitus (ICD-9CM 250.0-9) from other patients on the patient outcome of length of stay?
RQ2: What nursing diagnoses are associated with patients hospitalized for diabetes as primary diagnosis?
RQ3: What is the magnitude and direction of the correlation between the discrete independent variable of the number of nursing diagnoses and the continuous dependent variables of length of stay (LOS) and intensive care unit (ICU) days among hospitalized patients with diabetes?
RQ4: What is the relationship, between patients’ discharge disposition (home,
rehabilitation facility, nursing home, death, etc.) and the independent variables of age, gender, marital status, race/ethnicity, and payer type?
RQ5: Which of the 61 nursing diagnoses are more influential in explaining the variance in patient length of stay?
Theoretical Framework
7
thus, are a surrogate measure of the quality of care provided and are linked to the structure and processes used by physicians and nurses (Donabedian, 1969). The extent to which both parties are successful in achieving good health outcomes depends on the interactions of a myriad of factors. With hospitalized patients, these interactions of factors occur within the structure of the institution. A theoretical framework that captures these dynamics is a system described by Donabedian as the structure, process, and outcome model.
8
Figure 1. The Interrelated Components of Structure, Process, and Outcome.
Donabedian (1969) explains that the evaluation of structure entails the appraisal of the resources utilized in the delivery of care and of their organization. It includes the properties of facilities, equipment, manpower, and financing. The evaluation of process is an appraisal of the care itself; the nursing audit is an example of this approach. The evaluation of outcomes is the assessment of the end results of care, which are usually specified in terms of patient health, welfare, and satisfaction (Donabedian, 1969).
Study Model Overview
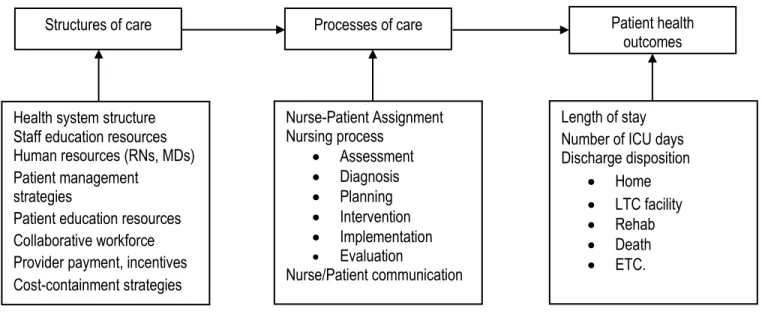
Applying this model to the management of hospitalized patients with diabetes brings the variables at play into focus as depicted in figure 2.
Figure 2. Interrelated Components of Structures Model in Hospitalized Patients Using the Nurse-Patients Summary Dataset.
Structures of care Processes of care Patient health
outcomes
Health system structure Staff education resources Human resources (RNs, MDs) Patient management
strategies
Patient education resources Collaborative workforce Provider payment, incentives Cost-containment strategies Nurse-Patient Assignment Nursing process Assessment Diagnosis Planning Intervention Implementation Evaluation Nurse/Patient communication
Length of stay Number of ICU days Discharge disposition
Home LTC facility Rehab Death ETC.
Processes
9
In figure 2, the structures of care represent the prevailing culture or system in place within the institution (hospital) that guides patient care while simultaneously meeting other institutional objectives such as staff management and cost containment. In the study hospital only registered nurses (70% with earned BSN) were assigned to patients. This institution emphasized high patient satisfaction and thus made an effort to deliver excellent patient care at some additional cost. This is an important distinction in patient health outcomes because cost containment and excellent patient care are not always mutually inclusive. Processes of care include the activities in seeking care by the patient and the practitioner's activities in making a diagnosis and recommending or implementing treatment (Donabedian, 1988). Processes of care, in this context represents the steps taken by assigned nurses (focus is on nurses because the study is concerned with nursing diagnoses) to manage their patients’ health conditions. The influence of structures on processes might be in the form of guidelines, policies and procedures,
availability of resources and equipment that aids in care delivery, continuing education
10
the need for discharge to a nursing home is due to many factors, factors that are related to both patient and nursing care. And these factors are worth investigating. For this reason, the
information that nurses collect and record in the implementation of the nursing assignment process, particularly diagnoses and evaluation of intervention, becomes an important barometer of quality of care which is closely linked to patient health outcomes.
The Nurse-Patient Summary data set (Halloran, Kiley, & England, 1988) was accumulated from two data-gathering systems. These are the International Classification of Diseases (ICD) 9th revision and the derivative diagnose-related groups (DRGs), and a tool containing a list of 61 nursing diagnoses. The ICD is used by the physicians to classify patient health conditions. Nursing diagnoses are derived from nurses’ assessments of patients’ health needs amenable to nursing interventions that guide nurses in the management of their patients’ health conditions. It is necessary to offer a brief overview of these two methods of data-gathering of patient records.
International Classification of Diseases (ICD) and Diagnosis-related group (DRG)
The extent to which the medical diagnosis of diabetes is valid in the proposed secondary analyses of this data collected by Halloran et al. (1988) depends less on the test used in the diagnosis of diabetes in the hospitalized patients than on the structural and process dimensions of care quality measurement as defined by Donabedian (1988). All physicians making the diagnosis were either board certified internists or in training and under supervision of board certified internists- what Donabedian calls structure. Further, the physicians were members of the staff of a teaching hospital and were required to practice ‘textbook’ medicine, in Donabedian’s
11
example, code 250 (diabetes) was used to represent diabetes, diabetes mellitus, high blood glucose, juvenile diabetes, and adult-onset diabetes or diabetic neuropathy. The use of the administrative databases such as the Uniform Hospital Discharge Data Set (UHDDS) that employs the International Classification of Diseases, 9th Revision (ICD-9) to summarize the results and findings of physicians as a recording tool of patient medical condition are well documented (Guttmann et al., 2010; Quan et al., 2008; Quan, Parsons, & Ghali, 2004). These administrative databases often include the demographic characteristics and diagnoses of patients and codes for procedures.
The ICD-9 is an example of a component of administrative database that is readily available, inexpensive to acquire, computer readable, and typically encompass large populations (Iezzoni, 1997). Although there is a current debate over the accuracy and thus, the utility of administrative databases in clinical research, they represent a rich source of not only general patient information but also of disease epidemiology. The three major producers of
administrative databases are the federal government (including the Health Care Financing Administration [HCFA], which administers Medicare and oversees Medicaid; the Department of Defense; and the Department of Veterans Affairs), state governments, and private insurers (Iezzoni, 1997), and because their source documents contain the minimum amount of
information required to perform the relevant administrative function (for example, to verify and pay the claims) they do not often contain much clinical information suitable for clinical research. However, their usefulness as a source of patient demographic information and disease
12
diabetes mellitus, 290 for patients with dementia and 410 for patients with acute myocardial infarction, etc. This allows for a possible comparison of nursing diagnosis use pattern for any group of patients in the Nurse-Patient Summary data set.
Nursing Data
Although the healthcare delivery system is based on the physician's medical model of diagnosing and treating illness, as evidenced by the prominence of the ICD codes in the UHDDS, nursing’s impact on the delivery of health care services is perhaps even more
significant even if not fully appreciated in the patient discharge summary. Nurses provide those services that the patent would perform unaided to maintain health or its recovery if the patient had the strength, will or knowledge; and they perform those activities that would enable the patient to gain independence as rapidly as possible (Henderson & Nite, 1978).
13
database with information about nurse education, experience, and certifications (E. J. Halloran, personal communication, February 16, 2012).
Nurses record patient data in several ways and in several forms. The traditional way nurses record information had been to document patient’s health-related activities in the form of ‘progress notes’ in hard copy patient charts, though this form is now rapidly being replaced by computerized charting. Another method by which nurses gather and record patient data is as an abstracted form of patient classification system. Patient classification tools such as nursing management information system (NMIS) have been used to determine nursing resource needs of patients by hospitals across the United States for many years (Jelinek & Pierce, 1982). The Nurse-Patient Summary checklist based primarily on nursing diagnoses (Halloran, Patterson, & Kiley, 1987) is an example of a tool that nurses use to collect patient data. This tool provided the foundation on which the Nursing Severity Index (NSI) was developed (Rosenthal, Halloran, Kiley, & Landefeld, 1995; Rosenthal, Halloran, Kiley, Pinkley, & Landefeld, 1992). In the process of developing and validating the nursing severity index, Rosenthal and colleagues (1992) found that the initial hospital rating of 61 nursing diagnoses from the Nurse-Patient Summary checklist explained variations in mortality rates of hospitalized patients. The findings suggest that an alternative source of data can independently predict patient mortality using data collected exclusively by nurses.
This distinction in utility of the ICD-9 and the derivative DRGs and nursing data is important because nurses and physicians represent different physical and organizational
14
CHAPTER 2
REVIEW OF THE LITERATURE
Overview
This chapter is a brief review of the literature that is focused on four main concepts -nursing diagnosis, Medical diagnosis of diabetes, nurses’ role in diabetes management, and patient factors (e.g. patient age, sex, marital status, race/ethnicity, education, family/social support, and payer type as a proxy measure of socioeconomic position) that in the context of this study are important concepts in the health outcomes of the patient with diabetes. A review of historical and contemporary works and studies that have attempted to examine the link between nursing diagnosis and patient outcomes is presented. A brief discussion is also presented on the reliability and validity of nursing diagnoses.
Nursing Diagnosis
The circumstances under which nurses practice have always affected their roles in diagnosis and decision-making (Henderson & Nite, 1978). In many instances, nurses have to rely on their assessment skills to make a judgment on the condition of their patients and plan an appropriate intervention independent of physicians. The importance of the nurse’s role in the diagnosis and treatment of patients’ conditions is exemplified in the statement by Henderson and Nite (1978) in noting that:
Nurses working on islands and in remote rural areas where there are no doctors have been forced to take histories, do physical examinations, analyze their findings, “diagnose” or label the
16
This statement by this preeminent nurse pioneer highlights the long history of nursing diagnosis even before it was formally defined in nursing literature. Although not described as nursing diagnoses, Abdellah and colleagues published a list of nursing problems that are the basis for the development of a scientific body of knowledge that is uniquely nursing. In their classic work: Patient-Centered Approach to Nursing, Abdellah, Beland, Martin, and Matheney (1960) listed 21 nursing problems that formed the bases for the movement to a patient-centered curriculum for nursing education programs. These 21 nursing problems (Appendix B) represent the core of patient problems amenable to nursing interventions and feature prominently in contemporary lists of nursing diagnoses.
Fry (1953) first introduced the term nursing diagnosis in 1953 to describe a step
17
1974). In 1982 the conference was opened to the general nursing community and thus the North American Nursing Diagnosis Association (NANDA) was formed (J. J. Fitzpatrick et al., 1989).
However, during the diagnosis-review cycle of 1986 to 1988, NANDA still did not have an approved definition of nursing diagnoses (Carpenito, 1991). In 1987 the American Nurses Association adopted NANDA’s International Classification, and in 1989, the International Council of Nurses recognized NANDA as the definitive source of nursing diagnoses (Carpenito-Moyet, 2006). At the ninth conference of NANDA, the General Assembly approved an official definition of nursing diagnosis (NANDA, 1990). In 1990 NANDA, in conjunction with Board of Directors and the Taxonomy Committee defined nursing diagnosis as a clinical judgment about individual, family, or community responses to actual or potential health problems/ life processes which provides the basis for definitive therapy toward achievement of outcomes for which the nurse is accountable (Carpenito, 1991). Through the widespread testing, acceptance and expansion of NANDA’s definition, it gained international recognition (Wong, 2008). More recently, nursing diagnosis has been succinctly described as the conclusions or judgments made about the component of patient situations of concern to nurses (Renpenning, SozWiss, Denyes, Orem, & Taylor, 2011).
18
leading to inaccurate problem formulation and consequently, inappropriate nursing goal setting (Müller Staub et al.). Because of these inconsistencies, nursing diagnoses struggled to establish its own identity mainly in the validity and accuracy of the labels used. In recent years however, patient problem statements have become more structured and clearer in describing patient conditions (Von Krogh, Dale, & Nåden, 2005). Nursing diagnoses have also become slightly more accepted as a method of describing patients’ needs that are amenable to nursing
interventions (Vincent & Coler, 1990). This trend towards a wider acceptance and use of nursing diagnosis is probably due to the increasing amount of research studies establishing the validity of nursing diagnoses (Levin, Lunney, & Krainovich-Miller, 2004). For example, in an attempt to determine the diagnostic content validity of the most used nursing diagnoses Levin (1984) conducted a review of the research related to nursing diagnoses. This review revealed
approximately 70 studies, 35 of which were concerned with identifying and/or validating nursing diagnostic labels. Of these 35 studies, the majority (26) focused on identifying defining
characteristics, etiologies and diagnostic labels. Despite this gap in validation studies, it is encouraging to see that even at this early stage of development of nursing diagnosis, the nursing profession has been concerned with efforts to standardize the language nurses use to describe their patients’ condition and efforts were already underway to elevate the status of nursing diagnosis.
Some of the works intended to standardize terminology have been described in
19
1982; Kim, et. al, 1984; Leslie, 1981; Martin & York, 1984; Miaskowski & Garafallou, 1986; Silver, Halfmann & McShane, 1984; and Simmons, 1980 as cited in Levin et al. (1989).
Fundamental to making a diagnostic statement is the understanding that there is a
diagnostic process that must take place before labeling. Renpenning et al. (2011) argues that both the process and the labels must have a common meaning that is derived from a conceptual
theoretical understanding of the object of nursing to be useful to nursing practice. The focus of nursing diagnosis is different from that of medicine. A nursing diagnosis is unlike a medical diagnosis in that nursing diagnoses are based in a conceptual model of human action, not human disease (though these are not unrelated) E. J. Halloran (personal communication, March 10, 2011) (Renpenning et al., 2011). A quick review of the literature on nursing diagnosis studies indicates that while much has been written on validation of nursing diagnosis, particularly in enumerating defining characteristics that support the growing list of nursing diagnoses, little has been done in linking nursing diagnosis to patient outcomes. This gap is especially acute in the subpopulation of patients with diabetes. Hospitalized patients with diabetes represent an excellent population suitable for investigating the link between nursing diagnosis and patient health outcomes because of the complex disease management processes.
Validity of Nursing Diagnosis
A valid nursing diagnosis is one that is well grounded in evidence and is able to withstand the criticism of professional nurses (Fehring, 1987). Renpenning et al. (2011)
20
understanding of what nursing is, and substantiated with knowledge from other sciences. The knowledge generated this way is then used as a basis for taking action. The second way of establishing nursing diagnoses is theoretically based. Working from a general theory of nursing, the process-operations of nursing are described, categories are established, and appropriate labels are constructed. Consideration of process leads to a discussion of domain and structure of
knowledge (Renpenning et al., 2011).
In a review of the literature on the discussion of the validity of nursing diagnosis, the importance of the phrase “defining characteristics” in describing the relevance of the diagnostic labels used by nurses is evident. Elaborating on the validity of nursing diagnosis, Gordon (1987) asserts that validity describes the degree to which a cluster of defining characteristics describes a reality that can be observed in client-environmental interaction. In affirming this definition, Fehring adds that a set of defining characteristics expands the understanding of a nursing diagnosis and contends that a nursing diagnosis is essentially a cluster of characteristics that nurses put a label on for communication purposes. These defining characteristics are valid when they actually occur and can be identified as a cluster in the clinical situation (Fehring, 1987).
21
less predictable. They reasoned that the physiologically derived nursing diagnoses, which may be linked to a patient‘s medical condition make the cues for the nursing diagnosis more easily identified as they are based on signs and symptoms that arise from the pathology, and are thus, more apparent and objective. They further contend that, diagnosing these types of problems is not influenced by the nurse’s values and beliefs or their cultural background. Therefore it is easier to list, for example, the defining characteristics for the nursing diagnoses of urinary incontinence, activity intolerance, and impaired gas exchange. On the other hand, nurses, for example, may struggle with justifying with objective defining characteristics, the nursing diagnoses of knowledge deficit, disturbed self-concept, noncompliance and even pain- which tend to present with less concrete physical symptoms.
These issues notwithstanding, nursing diagnosis’ claim to validity and reliability has many merits. Symptomatic nursing diagnoses such as pain, anxiety, fear, and others related to human functions such as breathing, nutrition, and elimination are related to the professional literature in nursing, especially evidence-based textbooks such as Principles and Practices of Nursing, 6th edition (Welton & Halloran, 2005). The manner in which nursing information is collected also gives credence to nursing diagnosis. Nursing diagnosis can be collected
concurrently in the clinical environment and summarized in the hospital discharge abstract. This type of patient classification is superior to techniques that rely on coding after a patient is
22
these problems is through the use of nursing diagnoses (Halloran et al., 1988). Nursing diagnosis therefore has become an important source of patient health information and healthcare providers from various fields have come to rely on this information gathered by nurses to inform the care that they provide.
To further underscore the validity of nursing diagnosis, nursing diagnoses serve as the basis for intervention and is validated by patient outcomes. Outcomes that link diagnoses and interventions direct nurses to focus on the outcomes of the care they provide (Micek et al., 1996). If patient outcome is the focus for evaluating the effectiveness and appropriateness of patient care, it follows therefore that the validity of nursing diagnosis is a factor in the effectiveness of nursing intervention as evidenced by achievement of desired health outcomes. Nursing
information, which essentially, is a recording of the nursing process- assessment, diagnosis, planning, implementation, and evaluation, is thus, an important database of nursing activity and account of nursing’s contribution to healthcare. Patient data, particularly nursing diagnoses have been used in studies to explain variations in many patient outcomes such as hospital length of stay (Halloran et al., 1988), patient functional status (Halloran, 1988), severity of illness (Rosenthal et al., 1995; Rosenthal et al., 1992) and hospital discharge outcomes (Welton & Halloran, 2005).
Medical Diagnosis of Diabetes
23
makes a definitive diagnosis of diabetes difficult. This is compounded by the fact that clinicians and other healthcare professionals do not often agree on a single, universal test or criteria for establishing a diagnosis of diabetes. An individual’s health status also impacts the clinician’s ability to diagnose diabetes. For example, severe hyperglycemia detected during acute infective, traumatic, circulatory or steroid therapy conditions is transitory and should not in itself be regarded as diagnostic of diabetes (Alberti & Zimmet, 1998).
Currently there are several tests in use and differentially favored by clinicians and
researchers in a variety of settings. Although they each have shortcomings, these tests have been in use for a long time. These diagnostic tests include fasting plasma glucose (FPG), oral glucose tolerance test (OGTT), glycated hemoglobin levels (HbA1c), and random blood glucose
concentration (Peters, Davidson, Schriger, & Hasselblad, 1996). However, the lack of agreement on a single, reliable test for diagnosing diabetes, in the least, means that the criteria for finding and treating diabetes is disjointed and only perpetuates the issue of under-diagnosis (Saudek et al., 2008).
24 Definition
What is diabetes mellitus? The term diabetes mellitus describes a metabolic disorder of multiple etiologies characterized by chronic hyperglycemia (high blood glucose level) with disturbances of carbohydrate, fat and protein metabolism resulting from defects in insulin
25
Figure 3. Disorders of Glycaemia: Etiologic Types and Stage. Adopted from the World Health Organization (WHO) 1999 report on diagnosis and classification of diabetes mellitus.
26
to type 2 diabetes mellitus a few years later (Jovanovic & Pettitt, 2001; Kim, Newton, & Knopp, 2002).
Diagnosing Diabetes Mellitus
Historically, the oral glucose tolerance test (OGTT) has been the main method for diagnosing diabetes (Lundbaek, 1962; Molinaro, 2011; Peters et al., 1996). Diagnosis is made based on results of multiple measures of elevated fasting plasma (>126 mg/dl) or an abnormally high plasma glucose level (>200mg/dl) (T. T. Huang & Goran, 2003). The OGTT involves the ingestion of an oral glucose solution containing up to 75grams of dextrose (or equivalent
carbohydrate content) following a fasting period of 8 to 14 hours (WHO, 1999). The underlying premise is that in non-diabetic individuals, the spike in blood glucose levels at any point during the two hours following an ingestion of 75grams of a sugary solution is less than 200mg/dl and this is quickly followed by a drop to pre-ingestion level. In an individual with diabetes, serum glucose levels rise higher than normal during the two-hour period post glucose solution
ingestion, and fails to come back down as fast. A blood glucose level of 140mg/dl to 199mg/dl (milligrams per deciliter) indicates impaired glucose tolerance, and a result above 200mg/dl indicates a diabetic condition (T. T. Huang & Goran, 2003). The problem with this test is that it is cumbersome and inconvenient. The main issue with the OGTT is that it requires the patient to fast 8-14 hours prior to testing for a baseline measurement blood glucose level. In making a case for an intravenous glucose tolerance test, an alternative that has so far failed to gain wide
27
Another commonly used diagnostic test is the fasting plasma glucose test (FPG) However, despite its wide acceptance, the use of this plasma glucose test has also been
associated with some shortcomings. For example, the FPG test requires that the patient fast for at least eight hours- a major problem because of the challenge for a physician or a laboratory to enforce or for a patient to adhere to (Molinaro, 2011). In addition, there is also within and between patient biological variability in the measurement of plasma glucose levels (Ollerton et al., 1999; Troisi, Cowie, & Harris, 2000) that can confound result interpretation. In their analysis of data from the US population–based Third National Health and Nutrition Examination Survey (1988-1994), Troisi and colleagues found diurnal variations in fasting plasma glucose levels in participants aged 20 years or older with no previously diagnosed diabetes, who were randomly assigned to morning (n=6483) or afternoon (n=6399) examinations. The result of this study indicates that the time of day a patient is tested for diabetes could affect the result of the test and thus affect the physician’s impression about the patient’s diabetes status. (Peters et al., 1996). Despite their acceptance, plasma glucose tests (fasting plasma glucose test and oral glucose tolerance test) are not optimal.
The requirement that patients must fast prior to testing and the need for multiple testing at different times and at different visits are serious obstacles, these obstacles can affect the
reliability and validity of diabetes diagnosis. For these reasons there is a renewed interest in the hemoglobin A1c test (HbA1c). This test is a measure of the average blood glucose level over the previous 2 to 3 month period. It is determined by measuring the percentage of glycated
28
(Saudek et al., 2008). Indeed, the HbA1c has several advantages over the FPG or the OGTT. Whereas a few days of dieting or increased exercise in preparation for a doctor visit can significantly affect FPG and OGTT, HbA1c accurately reflects longer-term glycemic status (Saudek & Golden, 1999). Furthermore, even though the HbA1c is only a surrogate measure for average blood glucose, two major (Barr, 2001; Manley, 2003) trials that relate glycemic control to diabetic microvascular complications uniformly use HbA1c as the measure of glycemia. As a result, the HbA1c is thus the measurement best proven to correlate with at least diabetic
retinopathy, nephropathy and neuropathy (Saudek et al., 2008) which together, perhaps represent the greatest source of complications for people with diabetes.
In establishing the validity of the HbA1c, discussion must necessarily focus on the accuracy, sensitivity, and specificity of HbA1c as a screening and diagnostic tool for diabetes. In a study to examine the relationship between HbA1c and plasma glucose (PG) levels in patients with type 1 diabetes using data from the Diabetes Control and Complications Trial (DCCT) Rohlfing et al. (2002) analyzed the Third National Health and Nutrition Examination Survey (NHANESIII) for the sensitivity and specificity of HbA1c in the diagnosis of diabetes based on fasting plasma glucose (FPG). They concluded that HbA1c provided a specific and convenient approach to screening for diabetes and suggested a value of 6.1% or greater, 2 SD above the mean in the normal NHANES III population.
In the same vein, in an effort to determine the sensitivity and specificity with which various A1C levels identified people with diabetes, Buell et al. (2007) recently completed a similar analysis based on the 1999–2004 NHANES data. The diagnosis of diabetes was
29
specificity (92%). They concluded that HbA1c of 5.8% would be an appropriate cut point above which to proceed to further evaluation.
This suggests that HbA1c is a valid and accurate test in evaluating and diagnosing the glycemic status of patients. Indeed, the International Expert Committee on diabetes in a 2009 report concluded that overall, the HbA1c assay has merit for the diagnosis of diabetes (Nathan, 2009). Also, in a report prepared for the World Health Organization (WHO), diabetes experts described the HbA1c test as a simpler alternative to blood glucose estimation or the OGTT with equal or almost equal sensitivity and specificity to glucose measurement (Alberti & Zimmet, 1998). Furthermore, most of the problems that hitherto hindered a wider acceptance and adoption of the test as a diagnostic tool have been addressed in recent years. Most prominent among these, are the issues of standardization of the HbA1c test and the availability of thetest in developing countries and other remote parts of the world. Under the auspices of the National
30
Patient Factors Affecting Health Outcomes Age
Age is an important determinant of health outcomes. Older adults for instance often suffer from several chronic diseases; these diseases might include diabetes, heart disease hypertension and diseases of the respiratory system. Studies have shown that patients with multiple comorbidities often have poorer health outcomes and are likely to have longer hospital stays and readmissions. In a systematic literature review, Scott (2003) found that increasing age and the co-existence of diabetes mellitus, renal disease, chronic obstructive lung disease, major mental health disorders, and significant co-morbidity burden were associated with underuse of effective therapies resulting in poorer health outcomes for older hospitalized patients.
Age is related to the number of chronic illnesses presented at admission. Older patients tend to have more chronic disease. They also tend to have advanced stages of diseases by virtue of having had the diseases over a longer period (Kirkland & Sinclair, 2011). For example, in type 2 diabetes, a 20 year diabetic is likely to have fewer complications compared to an 80 year old who has had several decades of the disease. In a recent study, HbA1c levels, an indicator of glycemic control rose by 0.10% per decade in people between ages 40 and 74 (M. B. Davidson & Schriger, 2010), suggesting poorer disease control. Poor disease management leads to more complications.
31
chronic diseases reported higher quality of care. The quality of care increased as the number of medical conditions increased. The study involved a total of 7680 patients in three cohorts of community-dwelling adult patients in the Community Quality Index study, the Assessing Care of Vulnerable Elders study, and the Veterans Health Administration project. The researchers found that for each additional condition presented by patients there was an associated increase in the quality score of 2.2% (95% confidence interval [CI], 1.7 to 2.7) in the Community Quality Index cohort, of 1.7% (95% CI, 1.1 to 2.4) in the Assessing Care of Vulnerable Elders cohort, and of 1.7% (95% CI, 0.7 to 2.8) (Higashi et al., 2007). This finding suggests that the number of illnesses, at least in this group did not negatively affect perception of quality of care; rather the increased utilization of care services was predictor of quality of care. Age therefore, it would seem, is a stronger predictor of health outcomes. The authors did not discuss if any, the additive effects of age.
Marital Status and Family/Social Support
Marital status is a variable of interest because of the presumptive support that married patients receive from their spouses upon discharge to home. Several researchers have
32
age, gender, race, living situation (alone or with family or friends), marital status, education, and income were related to poor outcomes as evidenced by post-discharge service use
(re-hospitalizations, ED visits, and acute unscheduled physician office or clinic visits) for elders hospitalized with an acute exacerbation of heart failure, being single was related to
re-hospitalization (Roe-Prior, 2007). During the 12-week period after the initial re-hospitalization, 43 patients had all-cause re-hospitalizations (total of 57 readmissions), in the model with the best fit (Multiple regression), being unmarried predicted all-cause re-hospitalization (Roe-Prior, 2007). In a similar study, though with non-statistically significant statistical result, Luttik, Jaarsma, Veeger, and van Veldhuisen (2006) found that married patients had 12% less events in the 9-month follow-up period compared with patients living alone. This study examined the impact of having a partner on quality of life, the number of hospital readmissions, and 9-month survival in patients with heart failure.
The findings from these studies point to the importance of family support or spousal support in at least short-term outcomes of hospitalized patients following discharge. The availability of such support is often a determinant of discharge disposition other than death. Healthcare providers including the nurse who is often an integral part of the discharge-planning team will often inquire about family members who can help with patient care after discharge. In the older patient, this family member is often the spouse, although it could also be the patient’s adult children. The purpose of such inquiry by the nurse is to know which responsible party should be entrusted with discharge instructions, whom the patient may depend on for post
33
a consequence, patients are leaving the hospital sooner and perhaps sicker than in the past. Thus, family support is needed to help with care at home, and the question about marital status
becomes a proxy measure for the availability of home care following discharge. Where this is lacking, healthcare providers might consider alternative discharge disposition for the patient.
Sex
34 Race/Ethnicity
African Americans, Hispanic Americans, Native Americans, and the elderly are
disproportionately affected by diabetes (Black, 2002; Mahler & Adler, 1999). According CDC data from a 2007-2009 national survey, after adjusting for population age differences, the prevalence of diabetes by race/ethnicity among people aged 20 years or older was 7.1% for non-Hispanic Whites, 8.4% for Asian Americans, 12.6% for non-non-Hispanic Blacks, and 11.8% for Hispanics (CDC, 2011a). The prevalence and risk of diabetes-related complications are higher for African Americans, Hispanics, American Indians, and Alaskan natives (Welch et al., 2006). African Americans for example, are 2-4 times more likely than non-Hispanic whites to develop renal disease, blindness, amputations, amputation-related mortality (Emanuele et al., 2005; Lanting, Joung, Mackenbach, Lamberts, & Bootsma, 2005). African Americans and Latinos are also more likely to have higher hemoglobin A1C levels than Caucasians (E. S. Huang, Brown, et al., 2009). Further, Miech and colleagues found that disparites exist in diabetes-related mortality rates. In an analysis of diabetes mortality rates using two different national data sources, the U.S. National Vital Statistics, and the U.S. National Health and Nutrition Examination Surveys (NHANES) collected in 1988–1994 and 1999–2004, Miech and colleagues found that overall, diabetes-related mortality across education levels widened from the late 1980s to 2005, and in the subgroups of men, women, blacks, whites, and Hispanics (Miech, Kim, McConnell, & Hamman, 2009).
35
black and white people, Whitson and colleagues (2011) found that Blacks were more likely than Whites to report disability. After controlling for age, sex, marital status and socioeconomic differences, higher rates of obesity and diabetes in older black Americans account for a large amount of the racial disparity in disability (Whitson et al., 2011).
In another study designed to evaluate the relation of chronic conditions, gender, and race to the incidence of activities of daily living limitation in older adults, Dunlop, Manheim, Sohn, Liu, and Chang (2002), found that gender and race predicted moderate functional limitation onset, after controlling for age and education. The study suggests that arthritis, diabetes, prior cerebrovascular disease, incontinence, and impaired vision were significant predictors of moderate functional limitation onset after controlling for demographic variables (Dunlop et al., 2002). This is consistent with findings from other studies in which health disparities persist even after controlling for socioeconomic-related variables such as education, and income.
36
that among the multiple complex factors that influence their decisions, bias and stereotypical behavior may play a role.
Regarding patient diabetes outcome, Peek, Cargill, and Huang (2007) confirmed the widely held view that racial and ethnic minority groups bear a disproportionate burden of the diabetes epidemic and that they have higher prevalence rates, worse diabetes control, and higher rates of complications. In their systematic review of health care interventions, Peek and
colleagues found good evidence for the ability of current health care interventions to enhance diabetes care, improve diabetes health outcomes and potentially reduce health disparities among racial/ethnic minorities. However, despite evidence that a culturally tailored approach could enhance self-care and glycemic control (Utz et al., 2008), Peek and her colleagues found that the majority of interventions in their review involved the application of standard diabetes quality improvement programs to racial/ethnic minority populations.
Aside from systematic barriers that affect health outcomes at the societal level, members of racial minority groups face obstacles at the doctor’s office level. There is evidence that race/ethnicity-related healthcare disparities stem from healthcare provider prejudices and biases. For instance, physicians' perceptions of patients are influenced by patients' race and socio-economic status. Van Ryn and Burke (2000) in a study to examine the effect of patient race and socioeconomic status on physicians' perceptions of patients, found that Black coronary artery disease patients were more likely to be seen as at risk for noncompliance with cardiac
37
The extent to which a diabetes patient can achieve good glycemic control depends on many factors, these factors are diverse and range from the simple such as the type of diabetes diagnosis to the complex interplay of environmental, cultural, and socioeconomic factors. In type 1 diabetes, strict adherence to a prescribed insulin regimen often keeps blood glucose levels under control, although, this group of diabetics is more prone to extremes of blood glucose levels. In type 2 diabetes, there are many more factors at play. Because type 2 diabetes tends to manifest in older people, personal health behaviors tends to be an important predictor of how well the individual is able to manage the disease. Sedentary life style, weight status, dietary habit, and socioeconomic position and race/ethnicity affect ability to achieve good glycemic control. Although, the disease has a genetic and family history link (Gerich, 1998; McCarthy & Zeggini, 2009; Molinaro, 2011), these links only explain the high rates of diabetes among the racial/ethnic minority groups and does not explain the health disparities. While the prevalence of a disease within a specific population might be suggestive of some familial or genetic
predisposition, persistent poor health outcomes and complications might be due to some societal factors for which members of the group has little control. There is evidence that the heavy burden of diabetes in terms of related complications among minority groups is due to disparities in the healthcare system (Peek et al., 2007), and lower utilization rates of preventive services (Welch et al., 2006).
38
than Whites to be re-hospitalized for many diagnoses including heart failure (McHugh, Margo, & Kang, 2010). Non-White Hispanics and Blacks had higher readmission rates related to diabetes than Whites (H. Joanna Jiang, Andrews, Stryer, & Friedman, 2005). Black Medicare patients also had higher rates of readmission following heart failure treatment than White Medicare patients (Rathore et al., 2003) .
Though diabetes is not currently one of the readmission conditions considered by Centers for Medicare and Medicaid Services (CMS), for reimbursement purposes, in the future when diabetes is included in this list, hospitals with high readmission rates would have to address this issue or risk losing reimbursement dollars. Hospitals can avoid these penalties by shifting their clientele base and focusing on patients that are more likely to be compliant with treatment regimen and therefore, have reduced incidence of readmissions. Groups with high incidence of chronic disease rates and high incidence of complications requiring hospital admissions might be adversely affected by such a move. Since nurses provide critical in-hospital care, deliver
essential patient teaching and discharge instructions, and work with families and outside institutions to ensure smooth transitions and prevent readmissions (McHugh et al., 2010), it is important within the context of this study to examine the relationship between nursing diagnosis and patient discharge disposition and to see if patient race/ethnicity has an interactive effect with socioeconomic position on the discharge disposition.
Education
39
College, or Advance Degree) or health literacy is an important determinant of health behavior and therefore patient health outcomes. Health literacy was defined by Chung et al. (2006) as “a measure of a patient’s ability to read, comprehend, and act on medical instructions.” Patient education level has been shown to be an important variable in the treatment of individuals with complex and chronic medical conditions. Individuals with limited formal education or limited health literacy have been shown to have poorer health outcomes when compared to persons with higher levels of education (Jeppesen, Coyle, & Miser, 2009).
Poor health outcomes were related to difficulty understanding their disease process (Gazmararian, Williams, Peel, & Baker, 2003; Paasche-Orlow & Wolf, 2007), and healthcare provider instructions (Norris & Nissenson, 2008; Persell, Osborn, Richard, Skripkauskas, & Wolf, 2007). In a cross-sectional survey of 733 uninsured, low-income, rural women aged 40–64 years participating in the Well-Integrated Screening and Evaluation for Women Across the Nation (WISEWOMAN) project, Ahluwalia, Tessaro, Greenlund, and Ford (2010) showed that lower education level was also a significant predictor for uncontrolled hypertension. A high proportion of women in the project had uncontrolled hypertension, hypercholesterolemia, and diabetes at baseline.
Payer Type/Socioeconomic Position
Payer type such as private health insurance, self-pay, Medicare, Medicaid, health management organizations (HMOs), etc. is an indicator of the patient’s available healthcare resources and potential determinant of patient’s discharge disposition. Studies have used this variable as a proxy measure for socioeconomic position. Several studies have also used
40
the fact that many minority groups are underserved and socioeconomically disadvantaged and live in socioeconomically depressed communities (Richardson & Norris, 2010). Socioeconomic positionis a variable that features prominently in the literature and has been widely raised in the discussion of quality of healthcare. Invariably, these discussions lead to the identification of essentially two groups with disparate health outcomes- one with desired or near desired health outcomes and the other with poor health outcomes. It is essential therefore, that
socio-demographic characteristics like education, race, income and type of health insurance should be considered very important confounders in the discharge disposition of hospitalized patients.
41
CHAPTER 3
METHODOLOGY
Overview
The study examines nursing diagnoses use pattern and the association with patients’ specific chronic health condition, type 2 diabetes mellitus and the ability of the observed patterns to discriminate patients’ with this chronic disease. The focus is on how well nursing diagnoses explain variations in patient outcomes related to length of stay and patient discharge disposition (home, nursing home, rehabilitations facility, death, etc.) in the context of patient age, sex, marital status, race/ethnicity, and payer type. To this end, several statistical tests were conducted on this very large dataset.
Research Questions
The research questions, hypotheses, and statistical tests are:
RQ1: Can a nursing diagnoses model distinguish patients with the primary diagnosis of type 2 diabetes mellitus (ICD-9CM 250.0-9) from other patients using length of stay (LOS) as the dependent or criterion variable?
H0: There are no multiple correlations between nursing diagnoses use pattern and patients’ ICD-9CM 250.0-9 diagnosis codes.
H1: There are positive and significant correlations between nursing diagnoses and patients’ ICD diagnosis codes.
43
nursing diagnoses explained length of stay variation. Multiple regression was used to examine these two set of variables. By knowing the disease can the pattern of nursing diagnoses be anticipated?
RQ2: Which nursing diagnoses are associated with patients hospitalized with primary diagnosis of type 2 diabetes Mellitus (ICD-9CM 250.0-9)?
H0: There are no specific groups of nursing diagnoses associated with patients hospitalized for diabetes mellitus.
H1: Certain specific groups of nursing diagnoses are associated with patients hospitalized for diabetes mellitus.
Question 2 isolates a set of nursing diagnoses that nurses recorded for the 445 patients with diabetes mellitus. Comparison of nursing diagnoses for patient with diabetes (ICD code 250) as primary diagnosis and nursing diagnoses for patients without diabetes was conducted. Nursing diagnoses often associated with diabetes in the professional literature with diabetes were identified and compared with those recorded by assigned nurses in the care of patients with primary diagnosis of type 2 diabetes mellitus. By knowing nursing diagnoses can the disease be anticipated? Research question 2 answers this question by identifying and comparing the relative importance of nursing diagnoses gleaned from diabetes literature to be important in the care of patients with diabetes with other patient groups.
44
H0: There is no correlation between the number of nursing diagnoses and patient length of stay, and intensive care unit days among patients hospitalized with diabetes mellitus. H1: There is a correlation between the number of nursing diagnoses and patient length of stay, and intensive care unit days among patients hospitalized with diabetes mellitus. Question 3 is concerned with patients’ length of stay and ICU days and the number of nursing diagnoses recorded during the hospitalizations. A correlation between length of stay/ICU days and the number of nursing diagnoses is used to address this question. Because this question examines the means of all 61 nursing diagnoses relation to patients’ length of stay and ICU days (when applicable), an analysis of variance (ANOVA) is used to examine this inquiry.
RQ4: Which of the 61 nursing diagnoses are most influential in explaining the variances in the length of stay among patients with primary diagnosis of type 2 diabetes mellitus?
H0: There is no difference in importance between nursing diagnoses in explaining the variance in patients’ length of stay.
H1: Certain nursing diagnoses are more important than others in explaining the variance in patients’ length of stay.
Rather than the number (amount) of nursing diagnoses (Question 3), Question 4 aims to examine how the different nursing diagnoses or groups of nursing diagnoses are related to patient’s length of stay. Because some nursing diagnoses are more severe than others, it is hypothesized that certain nursing diagnoses will explain a greater percentage of the variance in patients’ length of stay. To verify this, multiple regression was used to address this inquiry. The 61 nursing
45
An assumption is made based on the provisions of the central limit theorem that the data has a normal distribution. The central limit theorem allows that whenever N is sufficiently large (N > 40), the distribution of the sample mean is approximately normal even when the population is non-normal (Elliott, 2010).
RQ5: What is the relationship between patients’ discharge disposition (Home, Rehabilitation facility, nursing home, death, etc.) and patients’ age gender, race/ethnicity, marital status, and payer type?
H0: No relationship exists between patients’ discharge disposition (home, nursing home, rehabilitation facility, death, etc.) and patients’ sex, marital status, race/ethnicity, and payer type among patients with diabetes.
H1: A relationship exists between patients’ discharge disposition (home, nursing home, rehabilitation facility, death, etc.) and patients’ sex, marital status, race/ethnicity, and payer type among patients with diabetes.
46 Type of Data
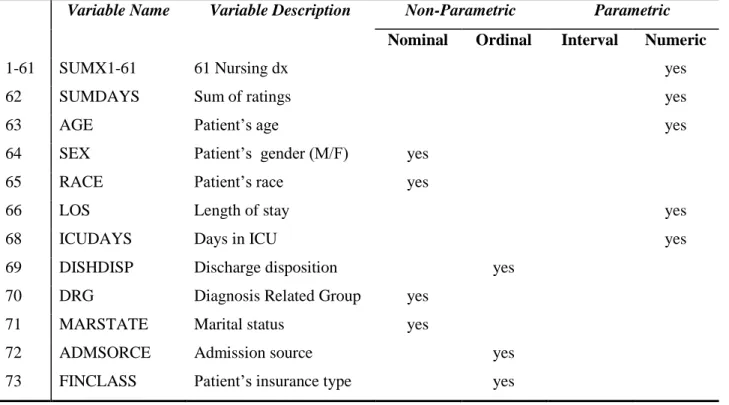
The dataset comprising 353 variables and 146,964 observations is a large data set and this necessitates a description and listing of the variables, table 3.0.1 offers a sample of key variables (see Appendix D for complete list of variables). The Nurse/Patient Summary data set has
nonparametric data (nominal and ordinal and parametric data (interval and ratio). Nominal data are discrete and categorical such as the numbers applied to non-numerical variables. For
example, in the context of the Nurse-Patient Summary dataset, gender might be listed as 1=female, 2=male; discharge disposition might be listed as 0=home, 1=nursing home,
3=rehabilitation facility, 4=died, etc.). Although nominal data may have numbers, these numbers are not used in statistical calculations. Ordinal data are also discrete number variables; they represent quantities that have a natural ordering. Often, the ordering might be used to indicate preference or order of importance as in a Likert scale. However, because the values between the intervals are not known with certainty, or the intervals might not be equal, ordinal data are not used for many statistical calculations. For example, the number of nursing diagnoses might be different for each patient, but one cannot say with certainty that the patient with five different nursing diagnoses is sicker than the patient with four. This is because all nursing diagnoses are not equally important to the patients’ health outcomes and the selection of nursing diagnoses may be affected by the nurse’s experience in using nursing diagnosis, education, and even job experience.