Dr R.Ramanathan et al JMSCR Volume 06 Issue 10 October 2018 Page 923
Accuracy of Pulmonary Asthma Score in Predicting Severity of Asthma
Exacerbation in Mild and Moderate Asthma
Authors
Dr R. Ramanathan
1*,
Dr B. Mahalakshmi
2*1
Associate Professor, Department of Pediatrics, Rajah Muthiah Medical College and Hospital, Chidambaram
2
Post Graduate, Department of Pediatrics, Rajah Muthiah Medical College and Hospital, Chidambaram
Abstract
Objectives: The objective of the study was to determine the accuracy of pulmonary asthma score in predicting severity of asthma exacerbation and comparison of efficacy between levosalbutamol and ipratropium combination over levosalbutamol nebulization in reversing airflow obstruction and improving
oxygenation, evaluated using the pulmonary asthma score, SaO2, and PEFR in mild and moderate asthma.
Methods: A prospective, randomized, study was performed in RMMCH pediatric emergency department. Children between 6 and 12 years of age who presented with mild to moderate asthma exacerberations were included in the study. They were randomly allocated into two different groups: one nebulized with levosalbutamol alone and another with addition of ipratropium bromide to levosalbutamol. Baseline Peak expiratory flow rate and final absolute values or change from baseline 60–120 minutes after the inhalation
are measured. Patients were evaluated using the pulmonary asthma score4.
Results: After treatment there is improvement in the mean pulmonary asthma scores and PEFR percentage in A+B group than A group, but it is not statistically significant (p value >0.05). There is statistically significant improvement in pulmonary asthma score and PEFR in each of the groups before and after nebulization and pulmonary asthma score has a sensitivity of 66.7% and 65.6% in diagnosing severity of asthma in relation to PEFR.
Keywords: Levosalbutamol, Ipratropium bromide, peak expiratory flow rate, pulmonary asthma score (PAS).
Introduction
The administration of β2 agonists is the standard treatment for mild to moderate asthma crisis in emergency departments(1,2). Current guidelines suggessted the use of a combination of inhalation of β2 agonists plus anticholinergics for pediatric patients with acute severe or life-threatening asthma in the emergency setting. But its role in mild to moderate asthma exacerbation is still
inconclusive. It is practically difficult to assess lung function in children under 5 years of age because most lung functions in diagnosing and predicting severity of asthma are subjective and needs individual understanding and cooperation. Recent studies of acute asthma management in the emergency department have focused on objective assessment of the severity of asthma and rapid provision of effective treatment. Care is guided by
www.jmscr.igmpublication.org Impact Factor (SJIF): 6.379
Index Copernicus Value: 79.54 ISSN (e)-2347-176x ISSN (p) 2455-0450
Dr R.Ramanathan et al JMSCR Volume 06 Issue 10 October 2018 Page 924 the clinical evaluation, including a directed history
and a physical examination focused on key warning signs of rapid deterioration or severe exacerbation and measurement of oxygen saturation by pulse oximetry. Various clinical scoring systems are effective in predicting the severity of asthma in emergency room. In our study PAS is used in assessing the severity of asthma in relation to PEFR.
Materials and Methods
A prospective, randomized, study was performed in RMMCH pediatric emergency department between the months of August 2016 and August 2018. The study was previously approved by the hospital ethics committee. Children between 6 and 12 years of age who presented with mild to moderate asthma exacerberations were included in
the study. They were randomly allocated into two different groups: one nebulized with levosalbu-tamol alone and another with addition of ipratropium bromide to levosalbutamol. Baseline Peak expiratory flow rate and final absolute values or change from baseline 60–120 minutes after the inhalation were measured). Because the peak bronchodilator effect after the administration of anticholinergics occurs within 1–2 hours, it is reasonable to expect significant improvement during this time. Patients were evaluated using the pulmonary score3. The oxygen saturation (SaO2) was measured using a pulse oximeter. Peak expiratory flow rate was performed using a portable peak flow meter. The predicted PEF was adjusted for sex and height and the percentages of the PEFR before and after nebulization was obtained.4,5.
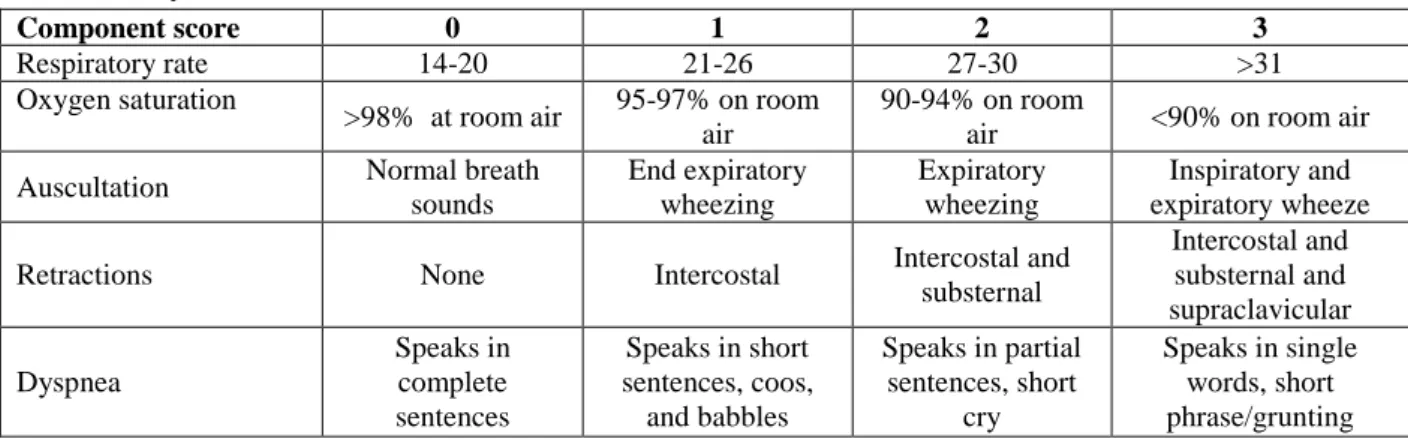
Table: Pulmonary Asthma Score
Component score 0 1 2 3
Respiratory rate 14-20 21-26 27-30 >31
Oxygen saturation
>98% at room air 95-97% on room air
90-94% on room
air <90% on room air
Auscultation Normal breath
sounds End expiratory wheezing Expiratory wheezing Inspiratory and expiratory wheeze
Retractions None Intercostal Intercostal and
substernal Intercostal and substernal and supraclavicular Dyspnea Speaks in complete sentences
Speaks in short sentences, coos,
and babbles
Speaks in partial sentences, short
cry
Speaks in single words, short phrase/grunting
The severity of the asthma crisis was classified according to the pulmonary asthma score as mild (score 5–7and PEF > 70% of the predicted value according to the age and sex; moderate (score 8– 11) and PEF 50–70% or FEV1 60–80% of the predicted value and severe (score 12–15) and PEF
< 50% or FEV1 < 60% of the predicted value.
The PAS was the main criteria to rank severity of asthmatic crisis.
Results
Group 1: A-levosalbutamol
Group 2: A+B - levosalbutamol + ipratropium bromide
Table 1: Name of the Medication Used
Frequency Percent
A 25 50.0
A+B 25 50.0
Total 50 100.0
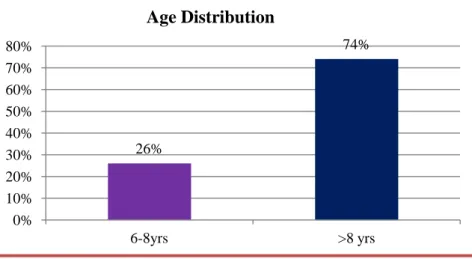
Table 2: Age distribution among study population
Frequency Percent
6-8yrs 13 26.0
>8 yrs 37 74.0
Dr R.Ramanathan et al JMSCR Volume 06 Issue 10 October 2018 Page 925 Comparison of age in both groups
Table 3: Age Range and Name of the Medication Used Cross tabulation
Age range Name of the Medication Used Total P value
A A+B
6-8 yrs 8 5 13 0.260
>8yrs 17 20 37
Total 25 25 50
Table 4: Sex distribution among study population
Frequency Percent
Male 26 52.0
Female 24 48.0
Total 50 100.0
Table 5: Pulmonary asthma score before nebulization in both groups
PAS range Name of the Medication Used Total P value
A A+B
Mild 10 8 18
Moderate 15 17 32 0.509
Total 25 25 50
Table 6: Distribution of PEFR before nebulization
Frequency Percent
>70% 18 36.0
50 -70% 32 64.0
Total 50 100.0
26%
74%
0% 10% 20% 30% 40% 50% 60% 70% 80%
6-8yrs >8 yrs
Age Distribution
8
17
5
20
0 5 10 15 20 25
6-8 yrs >8yrs
A
Dr R.Ramanathan et al JMSCR Volume 06 Issue 10 October 2018 Page 926
Table 7: Means of HR, RR, SPO2
N Mean Std. Deviation
Before
B-HR 50 130.84 23.191
B-RR 50 35.74 8.799
SPO2 50 94.5000% 3.01865%
After
A-HR 50 128.40 23.181
A-RR 50 29.44 7.843
A-SPO2 50 96.2800% 2.57967%
Comparison of PEFR before nebulzation between the groups
Table - 8: Baseline PEFR and Name of the Medication Used Cross tabulation
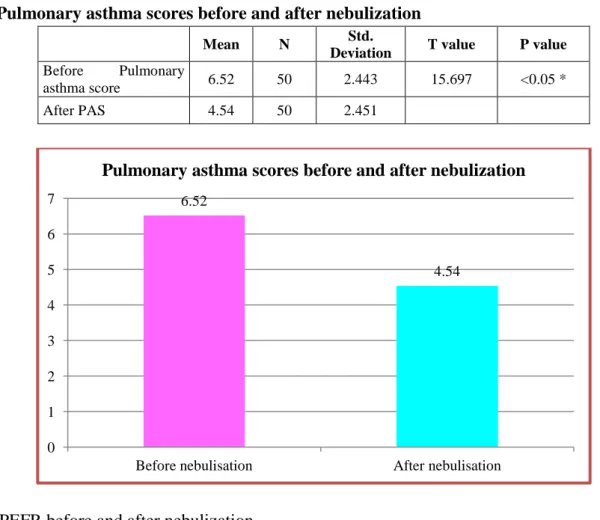
Table -9: Pulmonary asthma scores before and after nebulization
Mean N Std.
Deviation T value P value
Before Pulmonary
asthma score 6.52 50 2.443 15.697 <0.05 *
After PAS 4.54 50 2.451
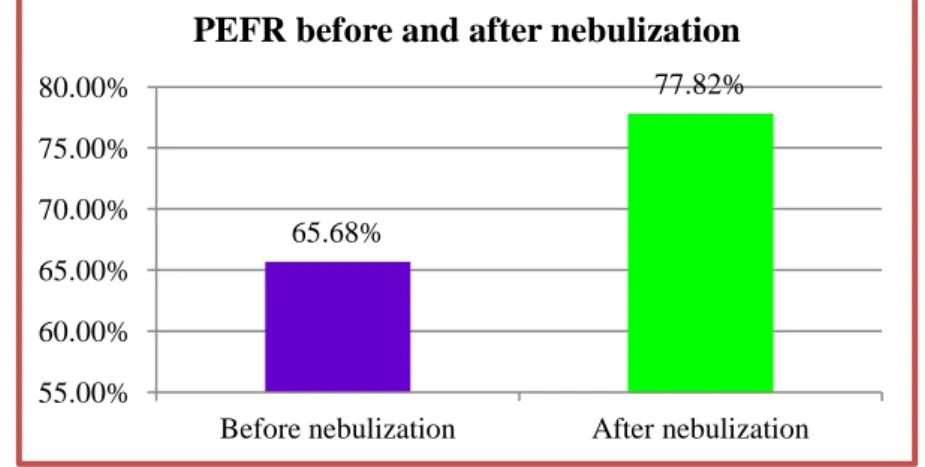
Table 10: PEFR before and after nebulization
Mean N Std.
Deviation T value P value
Pair 1
% of Predicted PEFR
baseline 65.6800% 50 9.29437% -15.588 <0.05 *
% of Predicted PEFR
after neb 77.8200% 50 7.93003%
6.52
4.54
0 1 2 3 4 5 6 7
Before nebulisation After nebulisation
Pulmonary asthma scores before and after nebulization
Name of the Medication Used
Total P value
A A+B
Pefr % Mild 10 8 18
Moderate 15 17 32 0.384
Dr R.Ramanathan et al JMSCR Volume 06 Issue 10 October 2018 Page 927 There significant improvement in PAS and PEFR after nebulization in both the treatment regimes.
Table 11: Comparison of PAS after nebulization between two groups
Name of the Medication Used N Mean Std. Deviation T value P value
PAS A 25 4.40 2.449 -0.40 0.691
A+B 25 4.68 2.495
Table 12: Comparison of PEFR after nebulization in two groups
Name of the Medication
Used N Mean
Std.
Deviation T value P value
% of Predicted PEFR after neb
A 25 77.1600% 8.80663% -0.585 0.562
A+B 25 78.4800% 7.06588%
65.68%
77.82%
55.00% 60.00% 65.00% 70.00% 75.00% 80.00%
Before nebulization After nebulization PEFR before and after nebulization
4.2 4.3 4.4 4.5 4.6 4.7
A A+B
4.4
4.68
Comparison of PAS after nebulization between two groups
76.50% 77.00% 77.50% 78.00% 78.50%
A A+B
77.16%
78.48%
Dr R.Ramanathan et al JMSCR Volume 06 Issue 10 October 2018 Page 928
Discussion
Out of 50 children included in the study, 52 percent were males and 48 percent were females.26 percent were less than 8 years of age and 74 percent were more than 8 years of age. Both groups were matched for age, sex, oxygen saturation and asthma severity. Regarding baseline severity score, in group A it was 5-7 in 10 and 8-11 in 15 cases. In group A +B it was 5-7 in 7 and 8-11 in 18 cases.
Based on PEFR, out of 50 children, 36% had mild exacerbation and 64% had moderate exacerbation of asthma respectively.
Chi square test was used for statistical analysis, paired and unpaired T test were used for comparision between two groups.
There is statistically significant improvement in PAS and PEFR in each of the groups before and after nebulization and pulmonary asthma score has a sensitivity of 66.7% and 65.6% in diagnosing severity of asthma in relation to PEFR. After nebulization there is significant improvement in respiratory rate and oxygen saturation in both groups but there is not much difference between both groups.
After treatment there is a greater improvement in the mean PAS and PEFR percentage in A+B group than A group, but it is not statistically significant (p value >0.05). This may be attributed
to small sample size in both groups. Yet the effects of Ipatropium with levosalbutamol seems to be equal to the levosalbutamol alone group. In a study of 125 children with severe asthma, by Quershi et al6, found that (FEV1) improved to a greater extent in children receiving salbutamol and ipratropium than in those receiving salbutamol placebo, but there is no effect on overall rates of hospitalization. In a subgroup analysis of children in whom FEV1 was less than 30 percent of the predictive value, the hospitalisation rate among those receiving the combination therapy was significantly lower than the rate with salbutomol alone.
In a study of 434 children by Schuh et al7 with moderate and severe asthma exacerbation showed that the addition of ipratropium bromide had a significant effect on improvement of asthma score, but there was no significant improvement of PEFR.
Dr R.Ramanathan et al JMSCR Volume 06 Issue 10 October 2018 Page 929
Conclusion
Ipratropium combination therapy has a definitive role in severe asthma crisis. But its role in mild to moderate asthma exacerbation is still inconclusive. Statistical significance has not been obtained in our study due to relatively smaller number of cases in each group. PAS holds good in assessing the severity of asthma exacerbation and hence can be used for rapid clinical evaluation of acute asthma in emergency settings and also to assess the response to treatment and to decide on hospital admission
References
1. Status asthmaticus is a major cause of acute illness in children and one of the top indi-cations for admission to a pediatric intensive care unit (ICU).
2. Werner HA. Status asthmaticus in children. Chest 2001;119:1913-29.2.Chipps BE, Murphy KR
3. Smith SR, Baty JD, Hodge DIII. Validation of the pulmonary score: an asthma severity score for children. Acad Emerg Med 2002; 9:99-104.
4. Fuhlbrigge AL, Weiss ST Kuntz KM, David Paltiel A. Forced expiratory volume in 1 second percentage improves the classification of severity among children with asthma. Pediatrics 2006; 118:e347– e35
5. MAKING SENSE of Lung Function Tests. Second edition. A hands-on guide Jonathan Dakin, MD FRCP BSc Hons, UK Mark Mottershaw, BSc Hons MSc, UK Elena Kourteli, FRCA, UK (International Standard Book Number-13: 978-1-4822-4968-2
6. Schuh S. Efficacy of frequent nebulised ipratropium bromide added to frequent high-dose albuterol therapy in severe childhood asthma. J Pediatr 1995; 126:639-45.
7. Sharma A, Madaan A.nebulised salbutomol Vs salbutomol and ipratropium combination in asthma. Indian J pediatr 2004;71;121-4.