Complex Systems Informatics and Modeling Quarterly (CSIMQ) eISSN: 2255-9922
Published online by RTU Press, https://csimq-journals.rtu.lv Article 107, Issue 18, March/April 2019, Pages 76–88 https://doi.org/10.7250/csimq.2019-18.05
Using Maps to Bridge the Socio-technical Gap: A Practitioner’s
Experience Report
Paola Mauri*
Senior consultant in System Management ICMCI Certified Management Consultant Star s.r.l. – Via Piave 22060 Cabiate, Italy
Abstract. In my projects, devoted to the implementation of management systems, it is necessary to take into account several social and technical features and link and merge social and technical environments. To bridge the gap between these environments, maps and mapping are a useful support. In this article these topics are presented through a cluster of projects I developed in large sized companies, where exploring the context is difficult and time consuming and the relationships are structured as a complex network. I focus on the maps that describe relationships between organizational structures and IT technologies; and describe in detail two cases: a success and a failure of my socio-technical approach. The lessons learned are presented and proposed as a reflection on the socio-technical perspective.
Keywords: Conceptual Modeling, Process Analysis, Socio-technical Perspective, Ethnographic Approach, Mapping.
1
Introduction
I apply a socio-technical perspective [1] in my projects, following the suggestion of the action research approach [2]. My projects deal with the development of Management Systems, in compliance with the requirements of ISO (International Standard Organization) Standard on Management systems, in particular, ISO 9001: 2015 “Quality Management Systems – Requirements” [3] and ISO 14001: 2015 “Environmental Management Systems – Requirements with guidance for use” [4].
Several requirements of ISO standards deal with data and information flows. For this reason, in my practitioner experiences, I pay particular attention to understand the relationship between the social side (for instance, the business model and the organizational structure) and the technical side (for instance, the software applications and the hardware network) of the organizations. I try to reduce the gap between the two sides, to increase the effectiveness of the systems.
*
Corresponding author
© 2019 Paola Mauri. This is an open access article licensed under the Creative Commons Attribution License (http://creativecommons.org/licenses/by/4.0).
Reference: P. Mauri, “Using Maps to Bridge the Socio-technical Gap: A Practitioner’s Experience Report,” Complex Systems Informatics and Modeling Quarterly, CSIMQ, no. 18, pp. 76–88, 2019. Available: https://doi.org/10.7250/csimq.2019-18.05
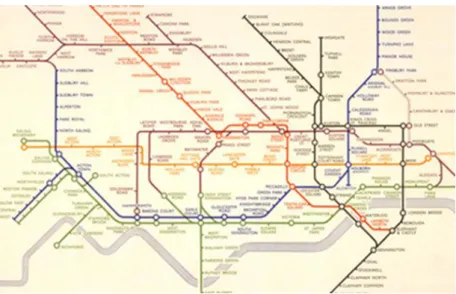
77 In Section 2 I present the methodological toolkit I exploit in my activity: Conceptual modeling and Process analysis, Social behavior and socio-technical design, Ethnographic approach and Mapping. I briefly discuss the role of maps not only in describing the environment but also as an effective means for support communication, by presenting the history of Beck’s map of the London Underground [5].
The experiences, described in Section 3, are a cluster of projects I developed in the last two years in large sized companies. These projects have several common points: the commitment and the organization features, in terms of size, ownership and management approach. In these experiences I exploited several maps to explore and to communicate. Among them I focus on maps useful to define the relationships between people and information technologies. Reflecting on these relationships, a success (Case A) and a failure (Case B) of these projects are described. A third project (Case C), recently started, is briefly presented. In this case I have to deal, in particular with process taxonomy and notation.
In Section 4, comparing results and lessons learned, I suggest that, even if the maps are an effective tool, the issues that influence a socio-technical approach could be several and to increase its effectiveness, the approach requires a set of iconic tools (including maps) which can be used as Beck’s map even to change behaviors and to improve communication. Future actions are briefly proposed in Section 5.
2
Methodological Toolkit
The methodological toolkit that supports my practice encompasses the following tools: Conceptual modeling and Process analysis,
Social behavior and socio-technical design, Ethnographic approach,
Mapping.
I present each tool in the following subsections.
2.1Conceptual Modeling and Process Analysis
The criteria that drive my practitioner activities are based on the business models proposed by ISO standards on management systems.
Since 2000, the Standard ISO 9001 on Quality Management System prescribes a process approach. Therefore the use of process analysis is necessary for “understanding and managing interrelated processes as a system” [3]. This practice allows to refine a method, in particular for defining the conceptual coordinates that drive the analysis and the phases that drive the design [6]. I considered, for instance, as conceptual coordinates the stakeholder’s point of view and the boundaries and followed a project approach based on defined phases. In the early stages I elaborated objectives and constraints by getting people together to explore future visions. Then I translated visions and feelings produced during the first phase into the management models and process descriptions, finalized to the project objectives. Process mapping closed the projects, describing the results (flow, data, and procedures) and transferring them from the project team to the whole company.
With version 2015, ISO management models introduced, as new key topics, the requirements of Context Analysis and Risk Management. These have deeply influenced my practice in the recent years. To integrate them in projects, it is necessary to deal with several functional areas, taking into account an enlarged set of stakeholders and then exploring a broader field in the company’s ‘environment’.
78 processes and stakeholders behaviors: it is necessary to take into account social behaviors when developing the analysis and modeling process can influence social behavior.
Context, process and risk analysis have been a useful way to understand and interact with the organizations and to support user involvement and participation.
2.2Social Behavior and Socio-technical Perspective
My increasing awareness of the key role of social and behavioral characteristics moved my attention to the socio-technical perspective, presented by E. Mumford in [1].
In practice I have identified several similarities with the concerns socio-technical perspective: the idea that “technical structure and work roles are both part of an inclusive system” [1], the attention to the environment and to the adaptive systems, the social support designed to reinforce social behavior, and the incompletion of the design, conceived as an iterative process.
I decided to apply the socio-technical perspective in my projects, considering that the social approach could be useful to refine principles and values that drive the practice. In the first set of experiences [7] my commitment was the re-engineering of organizational structure and its processes. I developed the projects in team, discussing and sharing solutions. I achieved positive results because was improved, in the teams, the common vision of their activities and interactions. In particular the Process Analysis increased the knowledge on the logical structure of information and data flows and improved the effectiveness in data recording and analysis. This knowledge was exploited, for instance, for a preliminary elicitation of information system requirements. These results enforced the idea that Process Analysis could be a way to link the organizational and management aspects and the technical issues: it is a common point in the research fields of Information Systems, Organizational Behavior [8] and Management Systems
The topics on Context Analysis and Risk Management enlarged the role of socio-technical perspective, in the projects. These topics drive exploration of human relationships (inside and outside the companies), while the analysis of requirements related to resources and information (including Information Systems) supports definition of the technical needs of the organization.
2.3Ethnographic Approach
The Ethnographic Approach, described in [9], states that. “The way the ethnographer is introduced in the field, the way she talks and she behaves have significant effect on her relationship towards the people in the field and the data the ethnographer will be able to have access to.” [9]
Considering myself as an ethnographer, I reflected on my practice [10], in particular on field observation and on the definition of my position in an economic organization (a company, an enterprise, a public owned group, etc.).
Usually I am introduced in the field through a contract, which offers consultancy services. These services, in general, have the commitment to measure compliance to standards, by means of audits or to develop a management system and to support its implementation. I am introduced to the organization by the person/function who defines the commitment and the project.
I usually develop my initial analysis through interviews and observations, which often are simultaneously exploited. Led by the ISO requirements, nearly always I have to deal with several functions, processes (e.g. sales, purchasing, operations, and human resources) and ownerships.
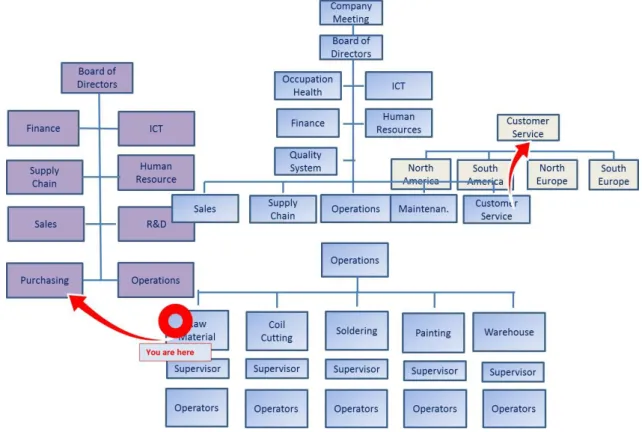
The first challenge is to understand my position in the organizational structure in order to plan the process of field observation.
79 sites and staff structures may not be clearly defined and hierarchical versus functional responsibilities, thus, could be difficult to manage.
Furthermore I have to decide ‘How, Who and When’ to interview and to observe:
How. The approach can be ‘one-to-one’, ‘one-to-many’, ‘many-to-many’. For instance, the interview during an audit is one-to-one activity, a training session is one-to-many, and a project meeting is many-to-many. Many-to-many approach allows to simultaneously evaluate the responses and to screen them. Activities, technologies, behavior and relationships can be observed, even digging into the personal relationships and into family histories is possible.
Who. The roles of people in the organization have to be compared and matched, because they can produce different responses.
When. My position in the field can change, during the project. For instance, in a long lasting project the role may move from being an observer role to being a participant.
Figure 1. Organizational Charts
The reflexive position of the ethnographer, the observer/participant positions and the insider/outsider perception, more generally, may be applied to investigate the relationship between a practitioner and an organization.
2.4 Mapping
This article focuses on the role of maps in describing the framework of complex relationships of the organizations and in reducing the gap between the social and the technical sides of companies.
To introduce this topic, two well known examples of maps are briefly presented, namely, Beck’s mapping of London Underground and Christian Nold’s experiential mapping.
80 vertical and diagonal lines. The new ‘artifact’ clearly depicted the relative location of the U-tube lines and the sequence of stations.
The map, published by The London Passenger Transport Board (now Transport For London) in 1933, was a success: after two months more than 850,000 copies circulated and it became a model for urban transportation.
But the interesting point was that this map modified the inhabitant’s perception of London territory, presenting an ‘increasing chaotic city as an object of coherence’. It was an effective way of communication with the underground users, influencing their sensibility and behavior. In this sense the map could be considered as an artifact.
Figure 2. H. Beck’s map (from http://active.tfl.gov.uk)
Thus, the maps can be conceived as windows for viewing the world, as artifacts to modify the world, and as an art form for visualizing people’s reactions to the external world.
In the ‘emotion maps’ of Christian Nold, described in [11], the maps are emotional portraits of a location. In Nold’s workshops, participants re-explore their local area with the use of a
unique device which records the wearer's Galvanic Skin Response (GSR), which is a simple indicator of emotional arousal in conjunction with their geographical location.
Considering the above-mentioned features of the maps, in the reminder of this subsection, I reflect on the role of maps in my practice.
My activities are backed up by several types of graphical tools: organizational charts, process maps, and hardware and software network representations, information networks representations, etc. These maps are always used in meetings, workshops, interviews and audits to perform field observation of large sized companies.
81 Figure 3. Maps to explore the organizations
In my practice, the maps have been useful for exploring, for describing and defining relationships (organizational charts and processes), and for tracking and modifying behavior.
Exploring the environment.
In Section 2.3, the role of Organizational Chart was described from an ethnographic point of view. In general, large sized companies are managed on the basis of Business Models that could be described through maps, for instance as a Matrix Organization. The business model influences the organizational frames and then roles and responsibilities. These topics are essential in defining a Management System and in mapping its processes because, for instance, the process ownership depends on the organizational structure that, in turn, depends on the business model.
The technical side of companies could include machineries, hardware, software and network infrastructures, data and knowledge warehouse, and information systems. For reflecting the technical side, the following maps can be used: plant layouts, hardware configuration, data logical structures, process maps embedded in information systems, etc.
Defining and describing relationships.
As previously stated, the gap between the two sides, social and technical, could be very large and could produce lack of effectiveness. Then it is essential to try to bridge this gap by defining closer relationship, in particular, between Management Systems and Information Systems and exploiting maps to describe them.
The experiences regarding capabilities of maps in defining and describing relationships are described in Section 3.
Tracking and modifying behavior.
82
3
Experience. Management Systems and IT Functions in Large Sized
Companies
This section summarizes the common features of the projects developed in seven large sized companies in years 2017 and 2018.
3.1Characteristics of Large Sized Organizations Discussed in the Article
Large sized companies I worked with share the following common features:
The ownership is based on shareholders and the governance on board of directors (CEO, CFO, COO, etc.).
The distribution of sites and markets is worldwide. In this article, mainly the practice in Italy with operation sites is described.
The organizational structures are complex and often subject to changes through corporate projects that redesign the management approach.
The complexity and frequent changes of the organizations make it difficult, even for the employees, to understand their ‘positions in the field’.
IT functions may be far from my point of observation. My contact persons are often end-users or representatives of local functional units, not involved in the strategic development of new applications.
3.2Projects
The projects had the following main and common features:
The commitment of contracts was the design and implementation of a specific management system in compliance with the model of ISO standards. In particular, due to the requirements of the new ISO standards, during the projects, I had to understand how the internal and external context was analyzed by the organizations and if/how risk management was performed. The process analysis was a key topic, as well.
My contractual interfaces in the companies were ‘Management System’ function, usually identified as Integrated Management Systems (IMS) or Quality, Health, Safety, Environment (Q&HSE) function. In a socio-technical perspective, I tried to develop my consultant activity through the involvement of all the functions that could contribute to the commitment. The involvement was based on interviews, meetings and workshops.
The projects had been developed in companies where I had never practiced before and then understanding the social environment was for me very challenging. Considering myself as an ethnographer, my first objective was to understand my position in the organizational structure in order to plan the process of field observation.
3.3Maps
In this subsection I describe how, in general, maps supported the projects and, in particular, I focus on maps that described the relationships between company functions, information systems and IT functions. The following project phases and practitioner’s roles are the sources of knowledge shared in this subsection:
Planning the project with the Management System function. Practitioner: ‘observer’.
83 functions and operations, with corporate and local structure, etc. The results of this phase were the plans of interviews with managers and/or of workshops with a project team.
Performing interviews and/or attending meetings. Practitioner:
‘observer-as-participant’. The map inventory increased step-by-step because often the involved functions presented their own map toolkit. For instance, top management could describe the structure of the business plan or of strategic risk tools by means of SWOT Analysis, and operation managers – by means of plant layouts or manufacturing process flows. Progressively a network of relationships was sketched. The results of this phase were text notes and maps.
Defining a documented framework to connect the requirement of ISO standards with
the company identity. Practitioner: ‘participant-as-observer’. Several maps could be linked together and with management system tools. For instance, the manufacturing process flows presented by operation functions could be exploited to develop an operating risks analysis and documented with operating risk techniques such as Ishikawa Diagram or FMEA (Failure Mode and Effect Analysis). (A detailed list of risk analysis techniques and related maps can be found in [12]). The result of this step was the construction of a network of links that could improve the internal communication.
In all projects I had to consider the links between Management Systems and Information Systems. I had to define the repositories (file systems, data warehouse, social network, etc.) for the information related to systems management, for instance, procedures, instructions, and guidelines. I developed the evaluation of environmental risks (for instance, the measure of pollution impacts) and/or health and safety risks (for instance, risk injury due to equipment misuse) with the support of specific software applications. I analyzed the processes (sales, supply chain processes, operations, logistics, etc.) considering the software applications that support them. For instance, the customer order process flows that could be common in Customer Relationship Management (CRM), Enterprise Resource Planning (ERP) applications and in a quality control plan.
In performing these activities, several maps were presented and discussed, that are organized in the following classes according to the relationships they display.
Maps that link IT functions with the organizational structure or with user’s categories (end users, key users, business process experts, etc.).
Maps that describe the processes embedded in the Information Systems. Maps that describe the processes embedded in the ISO Management Systems.
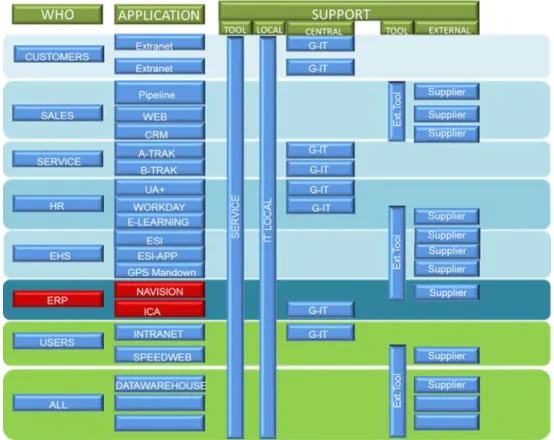
Table represented in Figure 4, was shared with one of my customers, where a synthesis of relationships from all these classes was effectively described. I collected similar descriptions in several other projects.
84 processes for recruitment, communication, training, on-boarding and team building [13]. The column SUPPORT, split in five sub-columns, identifies the resources that support the users. They are classified as internal (local and global) and external (supplier).
Figure 4. The map of relationships between management and IT systems
3.4Cases
This subsection presents the following cases from the set of experiences: a success case (Company A), a failure case (Company B) and, briefly, a work in progress (Company C).
Company A. Updating an area-specific application with users.
In Company A, where the map represented in Figure 4 was discussed and shared, my contact person and the project leader was the Manager of Health and Safety unit. This function had the role of IT internal support for the EHS (Environment, Health, Safety) Applications (ESI, ESI App, GPS Man-down), as well.
During the context analysis and risk evaluation, the project team met all the functional area (Marketing, Sales, Finance, Human Resources, Technical service, etc.) representatives and observed their activities and processes.
The team perceived the map as an effective tool for communication (as Beck’s map) and it was part of the success of the project.
Through this social approach several degrees of interaction with the IT applications were exploited. For instance, user interface and data structure were modified to record customer complaints in the CRM.
85 The above-described updating was possible because the project team, the application developer and I could interact and cooperate to re-design a specific software tool. Maps that link functions and maps that describe processes were a fruitful support.
Company B. Exclusion from the project of the new ERP.
In Company B the project was developed with the same features in term of objectives and methodological approach, as in Company A. Company B operates in a high technological field (testing equipment for microelectronics) with a complex and integrated management system, that include ethics, quality, environment, health and safety requirements. I had little time to plan and perform my activities (three months). In this project my contact person was a manager with a high level of experience on management systems and with a deep knowledge on the company, but not directly involved in the IT area.
Even in this project the process maps were a useful tool. They helped me to quickly merge in the new context. The contact person presented process/organization/IT maps that could be used to explore the company, to learn and to share concepts with the involved employees. I sketched a framework of relationships among the management system and the processes.
IT applications that support the front-end and back-end processes were, as in Company A, a key point for the implementation of the management systems. The analysis of these applications highlighted several weak points.
In the same period the company started a project to implement a new ERP application and the analysis phase almost overlapped with the context analysis of my project. The internal project leader proposed to top management an integration of the two projects and a common activity with two different suppliers. I found this opportunity very challenging and agreed to share my methods and approach with competitors. A common activity plan was defined and a kick-off meeting defined, as well.
In this crucial phase, my contact person and I were not able to quickly update the framework of relationships to include the IT requirements that we had defined during the project.
A few days before the kick-off meeting, the top management and the IT application supplier refused to participate. Due to the priority of new ERP implementation, my project was stopped and I had no further feedback.
Company C. Process mapping. The role of a notation.
Company C is a large sized company where I started a project in 2018, to develop context and risk analysis for quality and environmental management systems. This was the first phase of my experience. The business model of this company is very complex and encompasses, worldwide, Divisions, Business Units and functional areas, such as Marketing, Sales, Research and Development, etc. The maps of the business model and of its organizational charts supported my activities, in particular, to plan the interviews and to define the scope of the management systems.
The objective of the second phase of the project, which has just started, is to develop an analysis of processes and to map them, taking into account the business model (and its mapping). The project has the following guideline and key open points:
The team decided to exploit a socio-technical approach. ‘Who’ has to be involved was defined having business model and organization charts as a reference.
During the first set of interviews, several process approaches were presented: taxonomies exploited by Research and Development area, processes considered by the internal auditing function, processes embedded in IT applications.
Exploring relationships with Information Systems was difficult because the IT functions are not in the scope of the project. For this reason, the relationship with the IT process notation is not clear.
The choice of a common process notation became crucial.
86
4
Results and Lesson Learned
In this section, by considering the previously described cases, I summarize my reflections.
The experience in Company A was a success due to the possibility of sharing contents, methods and modeling notations in a project team with representatives of several functional areas, in particular, management systems and information systems. Effective maps supported socio-technical approach. They were useful to modify the perception of the team member on the relationships between people (end users and IT support) and information technologies. This perception helped the team in proposing new features for the information systems and then reduced the gap between the social side and the technical side of the company.
Experience in Company B was a failure. Even in this case, I developed the project with a social approach. But the goal was very challenging: in a short time I had to move from observer to participant position in a team where the project leader was a competitor and where the IT system involved several functions (ERP). The social design of a new information system required a strong commitment and a broad vision of the top management that could also overcome the possible conflicts among practitioners of different areas.
In general, considering the cluster of the projects, I reflect on the following topics: the interaction of management systems with the information systems;
the role of maps and notations to support this interaction; the variability of the results.
The following degrees of socio-technical interaction between management systems and information system were observed:
Low level. The project team takes the information systems into account as the reference for the management system but no modifications are produced on them. For instance, an E-learning application which records employee’s courses produces documented information on job profiles and this information fulfils an ISO 9001 requirement.
Medium level. The project team suggests/requires the updating of the information systems. For instance, a link between customer complaints and corrective actions management tools could be inserted in an existing CRM systems.
High level. The project team participates in the development of a new information system or the updating of an existing one. The information system could be a specific application, such as a health and safety risk management tool or a system involving many processes and functions, such as an ERP. The team deploys a socio-technical approach when functions, processes and information systems can be concurrently designed or re-designed in the same project.
To deploy a low or medium level of interaction, I found useful, to exploit the maps that describe data structure and/or relationships among functions, IT departments and IT applications. These maps can support a structured method to take into account user requirements (and their continuous change) in Information Systems development decisions.
To deploy a high level of interaction, I found useful to exploit maps that describe processes, where the link between organization structure and process flows is explicit as well as the relationships with tools, equipment and measurements is seen.
More generally, I consider maps useful to describe the ‘locations’ of the organizations and then to explore them. This exploration has changes my perception and the perception of my clients in the same way as Beck’s map did: they propose structured patterns that become part of people mindset.
The project experiences allow me to reflect on the variability of the results, as well.
87 approach could be successfully applied. If the circumstances are less favorable, the socio-technical approach shows some weaknesses that could be related to the lack of a defined and strong identity, easily recognized in the market scenario. This specific identity should include proper maps, acting as an iconic reference. In these cases, the ‘traditional’ approach for the IT analyst is evaluated by the company as more effective and then less expensive.
5
Conclusions and Outlook
In this article I propose to consider the use of maps as a useful approach to understand the organization’s environment, to modify social behavior and to improve communication. The maps, in this article, are understood in a very general sense as any type of graphical description. The main contributions of the article are the following:
It discusses usage of maps in different projects from a socio-technical perspective, i.e. as a part of socio-technical approach of consulting.
It shows that the use of maps in socio-technical settings yields benefits similar to those gained by map usage in other field, such as social behavior analysis.
It suggests which types of maps are useful for showing which classes of relationships. The main limitation of this work is that the experience of only one practitioner is reflected in the article. However, three project cases are provided for illustration of the map usage giving some background for generalization. The article clearly shows that mapping is a useful way of communication within an organization and a viable socio-technical tool to enhancing social behavior in relation to information technologies. The details regarding map usage, given in the article, can help practitioners to choose mapping techniques in their projects. The article is also a material useful for systems modeling tool developers as it gives some guidelines on what maps are helpful in socio-technical system projects.
Socio-technical perspective highlighted in the article shows the importance to share methodological tools among different communities. Knowledge amalgamated in this article can be used as a background for further scientific approach in developing customizable mapping toolsets. The main aim of further research is to explore new way for transferring knowledge and skills (based on maps). The methods of its achievement require a multifocal approach that involves different research areas and practitioner experience.
References
[1] E. Mumford, “The story of socio-technical design: reflections on its successes, failures and potential,” Info Systems Journal, vol.16, pp. 317–342, 2006. Available: https://doi.org/10.1111/j.1365-2575.2006.00221.x [2] R. L. Baskerville and A. T. Wood-Harper, “A critical perspective on action research as a method for
information systems research,” Journal of Information Technology, vol. 11, no. 3, pp. 235–246, 1996. Available: https://doi.org/10.1177/026839629601100305
[3] ISO 9001:2015. Quality Management Systems. Requirements.
[4] ISO 14001:2015. Environmental Management Systems. Requirements with guidance for use.
[5] W. Cartwright, “Beck’s representation of London’s Underground system: map or diagram?” GSR_2, RMIT University, Melbourne, December 2012
[6] P. Mauri, “Process Analysis and Collective Behavior in Organizations. A Practitioner Experience,” On the Move to Meaningful Internet Systems: OTM 2013 Workshops, LNCS, vol. 8186, pp. 124–133, 2013. Available: https://doi.org/10.1007/978-3-642-41033-8_19
[7] P. Mauri, “The Process Analysis as a Frame to Merge Social and Technical Issues in the Design of Information and Management System,” STPIS 2015 Workshop Proceedings, vol.1374, CEUR, pp.100–105, 2015.
88
[9] G. Regev, L. Regev, Y. Naim, J. Lang, and A. Wegman, “Teaching an Ethnographic Approach to Requirements Elicitation in an Enterprise Architecture Course.” STPIS 2015 Workshop Proceedings, vol. 1374, CEUR, pp. 5–19, 2015.
[10]P. Mauri, “‘You Are Here’. Exploring Social and Technical Environment of the Organization and Finding Your Position in the Field,” STPIS 2017 Workshop Proceedings, vol. 1854, CEUR, pp. 1–13, 2017.
[11]K. Harmon, “The Map as Art. Contemporary Artists Explore Cartography,” Princeton Architectural Press, New York , pp. 143–144, 2009.
[12]IEC/ISO 31010:2009. Risk management – Risk assessment techniques.