www.msjonline.org pISSN 2320-6071 | eISSN 2320-6012
Original Research Article
Study of bone turnover markers, procollagen type 1 N-terminal
propeptide and osteocalcin in healthy and type 2 diabetes mellitus
postmenopausal women
G. G. Kaushik
1, Rajesh Chahar
1*, Subhash Chandra
2INTRODUCTION
Bone is a dynamic tissue that is being remodeled constantly throughout life. It is composed primarily of the inorganic minerals (calcium and phosphate) and an organic matrix (type I collagen). There are two main types of bone cells i.e. osteoclasts and osteoblasts. Bone cells participate in the growth, modeling and remodeling of bone although they account for only a small fraction of bone volume.1 Organic matrix consists principally of
collagen (90%), other matrix proteins and proteoglycans. It is rapidly mineralized by osteoblasts in close apposition to and throughout the collagen fibrils. Despite its seemingly static appearance, bone is a remarkably labile tissue. Rate of formation or degradation of the bone matrix can be assessed by measuring the enzymatic activity related to the bone forming or resorbing cells. Bone matrix components are released into the circulation, either by the osteoblasts or by the osteoclasts.2 The latest
studies have established the active character of bone
1Department ofBiochemistry, J. L. N. Medical College, Ajmer, Rajasthan, India 2Department of Pathology, J. L. N. Medical College, Ajmer, Rajasthan, India
Received: 08 June 2020
Accepted: 30 July 2020
*Correspondence:
Dr. Rajesh Chahar,
E-mail: rajesh9460@gmail.com
Copyright: © the author(s), publisher and licensee Medip Academy. This is an open-access article distributed under the terms of the Creative Commons Attribution Non-Commercial License, which permits unrestricted non-commercial use, distribution, and reproduction in any medium, provided the original work is properly cited.
ABSTRACT
Background: Individuals with diabetes mellitus are at increased risk of metabolic bone disease due to decrease in bone strength and quality. Several bone turnover markers like serum procollagen type I N propeptide (P1NP) and serum osteocalcin are powerful tools for studying osteoporosis and fracture risk across population to provide diagnostic and prognostic information of bone health. The aim of this study was to recognize possible correlation of levels of serum P1NP and osteocalcin in type-2 diabetic (T2DM) postmenopausal women as compared to healthy postmenopausal women.
Methods: The study included 100 proven cases of type-2 diabetic postmenopausal women with age matched healthy
postmenopausal women as controls. P1NP, osteocalcin, and other relevant parameters were measured. Differences between diabetics and controls were analyzed.
Results: The body mass index was higher in diabetic group as compared to controls. The HbA1c% was (6.94±1.43)
in diabetic group and (5.57±1.21) in non-diabetics. Low serum level of 25 (OH) D was observed both in diabetic and non-diabetic groups but significantly lower in T2DM. Procollagen type 1 N propeptide was lower in diabetic group (37.59±17.20 ng/mL) as compared to non-diabetic (52.14±24.82 ng/mL). Osteocalcin was lower (15.64±8.06 ng/ml) as compared to non-diabetic group (21.85±9.12 ng/ml). Lower osteocalcin and P1NP levels found in this study suggests slower bone metabolism with reduced bone formation in postmenopausal diabetics.
Conclusions: Serum procollagen type 1 N propeptide and osteocalcin in postmenopausal diabetic women were lower
as compared to non-diabetic group.
Keywords: Bone turnover markers, Osteocalcin, Procollagen type I N propeptide, Type-2 diabetes
tissue, with important implications for the general homeostasis of the organism. It is now increasingly evident the role as endocrine organ exerted by the skeletal system, proving complex links with adipose tissue and glycemic and energy metabolism.3,4
Osteoporosis is the most prevalent metabolic bone disease and with an aging population its impact is expected to rise throughout the world. Nowadays, there is evidence that patients with T2DM have an increased risk of fractures compared with those without diabetes.5
Several biochemical markers of bone formation may be measured in the serum: Osteocalcin (OC), bone-specific alkaline phosphatase (bone ALP), procollagen type I N propeptide (P1NP), and procollagen type I C propeptide (P1CP).6,7 Biochemical markers of bone turnover have
the potential to provide early feedback to patients and prescribers during osteoporosis treatments.6
Serum P1NP concentrations reflect the integrated amount of skeletal new bone formation (Orion Diagnostica. 2008). The International Osteoporosis Foundation (IOF) and the International Federation of Clinical Chemistry (IFCC) have recommend P1NP as the reference biochemical marker of bone formation.6
Type I collagen, which constitutes 90% of bone proteins, is synthesized as type I procollagen. During the extracellular processing of type I procollagen, there is cleavage of the amino terminal [N-terminal propeptide of type I collagen (P1NP) and carboxy terminal propeptide (P1CP). These propeptides circulate in blood, where they are markers of bone formation. In contrast to serum P1CP, which is a single protein, P1NP circulates as different forms, including the intact authentic trimeric P1NP, a monomer, and several fragments.7 P1NP offer
several practical advantages including its low diurnal variability and stability at room temperature.
Osteocalcin is a 49-amino acid, calcium-binding peptide secreted by mature osteoblasts that is the most abundant non-collagen protein found in bone. Most OC secreted by osteoblasts is incorporated into the organic matrix that will later ossify into bone however a small fraction is secreted into the circulation, for this reason, OC is widely considered a bone formation marker.
OC has recently reemerged as a molecule of intense interest in basic and translational skeletal biology owing to the discovery that it functions as a bone-derived hormone influencing male fertility, glucose and energy metabolism, behavior due to direct effects in the central nervous system, and muscle function.8
Osteocalcin present in two forms, carboxylated and undercarboxylated (U-osc). The carboxylated form is synthesized and stored in the mineral matrix, while U-osc is produced from the degradation of bone matrix and released into the circulation as a hormonally active
isoform. U-osc has been shown to stimulate cell proliferation and increase insulin production, stimulates adiponectin expression in adipose cells, which in turn increases insulin sensitivity and energy metabolism.9
Diabetes mellitus refers to a group of common metabolic disorders that share the phenotype of hyperglycemia. The binding of insulin to specific receptors on osteoblast exerts anabolic effects, favoring survival, proliferation and differentiation of osteoblasts.10 This complex
relationship, bone tissue - insulin - glycemic metabolism can be disrupted in pathological conditions, such as type 2 diabetes mellitus (T2DM).3 Current studies support the
involvement of metabolic changes associated with T2DM in bone deterioration in terms of metabolism, structure and resistance.
Chronic hyperglycemia affects both the bone cell component and the extracellular matrix by accumulating the final products of advanced glycation end products (AGEs). This is responsible for collagen bone matrix stiffening that would allow the formation and propagation of micro-cracks throughout bone matrix.11 AGEs also
favors generation of reactive oxygen species within the bone, inducing an increase of inflammatory cytokines that result in osteoblast dysfunction and osteoclast activation.12
In postmenopausal women, acceleration of bone resorption begins at about 2-3% of bone resorption every year immediately after menopause, and the bone mass decreases exponentially.13 Bone loss occurs when the
balance between formation and resorption is upset and resorption is excessive resulting in a negative remodeling balance.
METHODS
A cross sectional case control study has been carried out for a period of one year from January 2019 to December 2019. The patients were selected from OPD of JLN Medical College and attached group of Hospitals, Ajmer. The study was carried out in 100 proven cases of type-2 diabetic postmenopausal women with age matched, 100 healthy postmenopausal women as controls. To exclude subjects with type 1 diabetes mellitus, diabetics were excluded with a history of ketoacidosis, age of onset of diabetes prior to 25 years, body mass index (BMI) <21 kg/m2 and use of insulin without a concomitant oral
hypoglycemic agent. Diagnosis of DM-II was based on demonstration of raised blood glucose level, according to criteria of World Health Organization (WHO) and American Diabetes Association (ADA) 2014. All cases and control were between 45 to 65 years and postmenopausal as defined by more than 1 year of amenorrhea.
postmenopausal women and to establish possible correlation of serum levels of the bone turnover markers in cases and healthy controls. Detailed history and Anthropometric parameters of participants was taken. Blood samples were collected from subjects by venipuncture in plain vials; serum was separated after one hour by centrifugation at 3000 rpm for 10 minutes. P1NP and total osteocalcin, 25(OH) D was measured by ELISA. Other relevant investigations like random blood glucose, HbA1C, alkaline phosphatase was also performed. The study has been approved by ethical committee of the JLN Medical College, Ajmer, Rajasthan, India.
RESULTS
Basic anthropometric parameters and blood glucose parameters of all subjects in study group type-2 diabetic postmenopausal women (Group I) and of normal healthy postmenopausal women (Group II) and are taken and summarized in Table 1. Mean age in years was (53.6±12.5), (50.44±12.1) in Group I and Group II respectively showing that diabetics are slightly more in mean age. The BMI was found to be higher in Diabetic group (27.96±4.56) as compared to non-diabetic group (24.45±4.42) (p<0.0001) (Table 1).
Table 1: The anthropometric and Biochemical characteristics of the postmenopausal diabetic and postmenopausal non-diabetic females.
Parameters Group I diabetic group (n=100) Group II non-diabetic group (n=100) p value
Mean±SD Mean±SD
Age (years) 53.6±12.5 50.44±12.1 -
BMI (kg/m²) 27.96±4.56 24.45±4.42 <0.0001
FPG (mg/dl) 135.2±43.2 84.76±14.81 <0.0001
HbA1c (%) 6.94±1.24 5.87±0.31 <0.0001
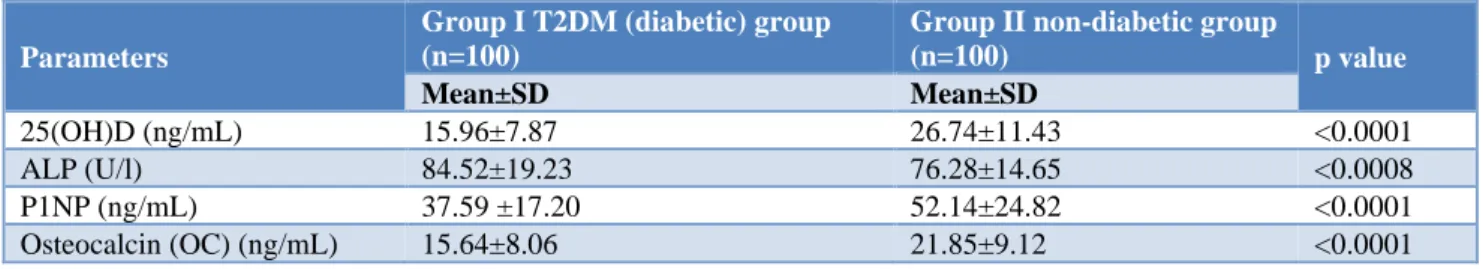
Table 2: Bone turnover markers (BTM) and 25 (OH) D in postmenopausal diabetic and non-diabetic women.
Parameters
Group I T2DM (diabetic) group (n=100)
Group II non-diabetic group
(n=100) p value
Mean±SD Mean±SD
25(OH)D (ng/mL) 15.96±7.87 26.74±11.43 <0.0001
ALP (U/l) 84.52±19.23 76.28±14.65 <0.0008
P1NP (ng/mL) 37.59 ±17.20 52.14±24.82 <0.0001
Osteocalcin (OC) (ng/mL) 15.64±8.06 21.85±9.12 <0.0001
Fasting plasma glucose was 135.2±43.2 mg/dl and 84.76±14.81 mg/dl respectively in Group I and Group II. The glycosylated hemoglobin (HbA1c%) was observed to be significantly high (6.94±1.43) in diabetic group as compared to non-diabetic (5.57±1.21), (p value <0.0001) (Table 1).
The serum levels of 25-hydroxy vitamin D in postmenopausal diabetics and postmenopausal non-diabetic subjects (controls) was 15.96±7.87 ng/ml and 26.74±11.43 ng/ml respectively, with a statistically significant difference (p<0.0001). Serum alkaline phosphatase (ALP) levels in postmenopausal diabetic group is higher (84.52±19.23 U/l) as compared to non-diabetic group (76.28±14.65 U/l), with a statically significant difference among the groups (Table 2).
Serum procollagen type 1 N propeptide (P1NP) in postmenopausal diabetic female and postmenopausal non-diabetic female (controls) was estimated. In diabetic group it is lower (37.59±17.20 ng/ml) as compared to
non-diabetic group (52.14±24.82 ng/ml). This difference is statically significant among the groups (p<0.0001) (Table 2).
Osteocalcin (OC) in postmenopausal diabetic women and non-diabetic women (controls) was estimated. In diabetic group it is lower (15.64±8.06 ng/ml) as compared to non-diabetic group (21.85±9.12 ng/ml) with a statically significant among the groups (p<0.0001) (Table 2).
DISCUSSION
presence of a low bone turnover in patients with T2DM.14
This condition allows accumulation of micro-fractures in the bone, with altered bone quality and increased bone fragility, independent of BMD.14 Multiple mechanisms
are involved in the reduction of bone resorption and formation in type 2 diabetes, such as, hyperglycemia and insulin resistance.
In present study the BMI was found to be higher in diabetic group (27.96±4.56) as compared to non-diabetic group (24.45±4.42) (p<0.0001). This is concordance with the study of Dumitru N et al and Nan R et al.15,16
Overweight and obese patients present an increased risk of fracture to minimal trauma. An increased BMI is no longer a protective factor against fragility fractures as it was considered in the past. Weight excess is a strong clinical feature associated with T2DM and there is a complex relationship between obesity and fracture risk.
The HbA1c% was observed to be significantly high (6.94±1.43) in diabetic group as compared to non-diabetic (5.57±1.21), (p value <0.0001). Similar result was also found in studies of Dumitru N et al, (in postmenopausal T2DM HbA1c% 6.84±1.24 versus non T2DM 5.47±0.31) and Wang et al, (mean HbA1c% in T2DM 9.36±2.35 versus non T2DM 5.67±0.33).15,17
HbA1c is an indicator of glycemic control.
Hyperglycemia results in dysfunction of osteoblasts in diabetic patients. It is found that the bone formation
markers osteocalcin and PINP were lower in
postmenopausal women with T2DM than in the controls, indicating that a poor glycemic control is associated with a reduction of bone formation. The inhibition of bone formation in T2DM may be due to the accumulation of advanced glycation end-products (AGEs) in the organic bone matrix, which may interfere with normal osteoblast function.18 Though low serum level of 25(OH)D was
observed both in diabetic and non-diabetic groups but significantly lower in postmenopausal T2DM than Non-diabetic controls. Vitamin D is likely to have an important role in glycemic control, probably by the associated beta cell dysfunction and insulin resistance in cases with vitamin D deficiency.
Serum alkaline phosphatase (ALP) levels in diabetic group is higher (84.52±19.23 U/l) as compared to non-diabetic group (76.28±14.65 U/l) with a statically significant difference among the groups (p<0.0008). This findings are in agreement with Varma M et al, (mean ALP in T2DM 89±4.8 U/L versus non T2DM 46±2.04 U/L); Shu et al, (mean ALP in T2DM 86.1±22 U/L versus non T2DM 72.5±24 U/L and Kulkarni et al, (mean ALP in T2DM 91.22±25.23 U/L versus non T2DM 86.82±18.59 U/L).19-21
Serum procollagen type 1 N propeptide (P1NP) in postmenopausal diabetic female is lower (37.59±17.20 ng/ml) as compared to non-diabetic group (52.14±24.82 ng/ml). This difference is statically significant among the groups (p<0.0001). This study findings are similar to that
of the research of Shu et al, (mean P1NP in T2DM 34.3±16 ng/ml versus non T2DM 57.3±28 ng/ml); Raska et al, (mean P1NP in T2DM 39.4±16.7 ng/ml versus non T2DM 45.5±17.3 ng/ml), Wang et al, (mean P1NP in
T2DM 48.47±27.27 ng/ml versus non T2DM
65.86±21.06 ng/ml), Dumitru N et al, (mean P1NP in
T2DM 41.95±15.50 ng/ml versus non T2DM
58.23±30.09 ng/ml).15,17,20,21 These studies indicated the
presence of low bone turnover markers like P1NP in patients with T2DM, though it is in reference range.
Serum osteocalcin (OC) in postmenopausal diabetic women is lower (15.64±8.06 ng/ml) as compared to non-diabetic group (21.85±9.12 ng/ml). This study is concordant with the studies of Ali M et al, (mean OC in T2DM 9.12±1.31 ng/ml versus non T2DM 11.22±1.44 ng/ml); Nan R et al, (mean OC in T2DM 19.74±11.08 ng/ml versus non T2DM 31.47±14.68 ng/ml); Raska et al, (mean OC in T2DM 17.9±6.7 ng/ml versus non T2DM 23.67±6.8 ng/ml); Wang et al, (mean OC in T2DM 17.42±9.50 ng/ml versus non T2DM 23.67±7.58 ng/ml) and Dumitru N et al, (mean OC in T2DM 18.70±7.41 ng/ml versus non T2DM 24.96±8.12 ng/ml).15-17,22,23
Lower osteocalcin and P1NP levels found in this study suggest slower bone metabolism with reduced bone formation in postmenopausal type 2 diabetes women as compared to non-T2DM healthy controls. The inhibition of bone formation in T2DM may be due to the accumulation of advanced glycation end-products (AGEs) in the organic bone matrix, which may interfere with normal osteoblast function. AGEs generate free radicals and promote oxidative stress, and increased expression of inflammatory mediators.
Hyperglycemia may have a direct influence on bone cells by increasing the expression of sclerostin (a negative regulator of bone formation) in osteocytes to inhibit bone formation. Serum OC concentration can be helpful for monitoring follow up changes in bone in type 2 diabetes mellitus. Vitamin D has an important role in glycemic control. In this study vitamin D deficiency was more pronounced in diabetic females than non-diabetic. It causes beta cell dysfunction and insulin resistance.
To diagnose postmenopausal osteoporosis, bone mineral density (BMD) needs to be measured along with BTMs. Several studies reported that serial measurements of BTMs showed better correlations with BMD than single measurements of BTMs. P1NP have been reported to be the most sensitive markers among the bone formation markers. Kulkarni et al, suggested that serum OC concentration can be helpful for monitoring follow-up changes in bone in type 2 diabetes mellitus.21 Dumitru N
et al, also highlight the importance of bone quality in postmenopausal type 2 diabetes patients, with a major impact on the fracture risk in these patients.15 Bone
CONCLUSION
Fasting plasma glucose and HbA1c% in postmenopausal T2DM group was observed to be significantly high as compared to non-diabetic postmenopausal controls.
HbA1c is an indicator of glycemic control.
Hyperglycemia results in dysfunction of osteoblasts in diabetic patients causing inhibition of bone formation. Low serum level of 25(OH)D was observed both in diabetic and non-diabetic groups. Serum alkaline phosphatase in postmenopausal diabetic group is higher as compared to non-diabetic controls. Serum procollagen type 1 N propeptide (P1NP) and osteocalcin (OC) in postmenopausal diabetic female is lower as compared to non-diabetic female. This difference indicates that bone formation was inhibited in postmenopausal women with T2DM.
Regular measuring of bone mineral density (BMD) and BTMs in the early postmenopausal period is important for early diagnosis of postmenopausal osteoporosis in T2DM and deciding the appropriate treatment time. Identification of the role of bone turnover markers will
contribute to a better understanding of the
pathophysiology of diabetic bone disease and it will help in a clinically validated screening procedure for early diagnosis and better management of this disorder.
Funding: No funding sources Conflict of interest: None declared
Ethical approval: The study was approved by the Institutional Ethics Committee
REFERENCES
1. Endres DB, Rude RK. Mineral and bone
metabolism. Burtis CA, Ashwood ER, Editors. Tietz
Textbook of Clinical Chemistry. 3rd ed.
Philadelphia: W.B. Saunders; 1998:1395-1414. 2. Garnero P, Delmas PD. New developments in
biochemical markers for osteoporosis. Calcified Tissue Int. 1996;59 (Suppl 1):S2-S9.
3. Jian-min L, Clifford JJ, Patricia D, Stavroula K, Gerard K. Regulation of glucose handling by the skeleton: insights from mouse and human studies. Diabetes. 2016;65:3225-32.
4. Sanches CP, Vianna AGD, Barreto F, DE C. The impact of type 2 diabetes on bone metabolism. Diabetol Metabol Syndrome. 2017;9:85.
5. Martinez-Laguna D, Tebe C, Javaid MK, Nogues X, Arden NK, Cooper C, et al. Incident type 2 diabetes and hip fracture risk: a population-based matched cohort study. Osteoporos Int. 2015;26:827-33. 6. Vasikaran S, Eastell R, Bruyere O, Foldes AJ,
Garnero P, Griesmacher A, et al. Markers of bone turnover for the prediction of fracture risk and monitoring of osteoporosis treatment: a need for international reference standards. Osteoporos Int. 2011;22(2):391-420.
7. Risteli J, Risteli L. Products of bone collagen metabolism. In: Dynamics of bone and cartilage metabolism (MJ Seibel, SP Robins, JP Bilezikian, eds). Academic Press, San Diego; 1999:275-287. 8. Ferron M, Wei J, Yoshizawa T, Del Fattore A, De
Pinho RA, Teti A, et al. Insulin signaling in osteoblasts integrates bone remodelling and energy metabolism. Cell. 2010;142(2):296-308.
9. Karsenty G, Oury F. The central regulation of bone mass, the first link between bone remodeling and energy metabolism. J Clin Endocrinol Metabo. 2010;95(11):4795-801.
10. Shao J, Wang Z, Yang T, Ying H, Zhang Y, Liu S. Bone regulates glucose metabolism as an endocrine organ through osteocalcin. International Journal of Endocrinol. 2015;2015:Art. ID 967673.
11. Dumitru N, Cocolos A, Caragheorgheopol A, Dumitrache C, Bratu OG, Neagu TP, et al. Collagen - the ultrastructural element of the bone matrix. Rev. Chim. (Bucharest), 2018;69(7):1706-9.
12. Carnevale V, Romagnoli E, D’erasmo L, D’erasmo E. Bone damage in type 2 diabetes mellitus. Nutrit Metabol Cardiovas Dis. 2014;24(11):1151-7.
13. Stepan JJ. Prediction of bone loss in
postmenopausal women. Osteoporos Int.
2000;11Suppl.6:S45-54.
14. Gilbert MP, Pratley RE. The impact of diabetes and diabetes medications on bone health. Endocrine Rev. 2015;36(2):194-213.
15. Dumitru N, Carsote M, Cocolos A, Petrova E. Metabolic and bone profile in postmenopausal women with and without type 2 diabetes: a cross-sectional study. Rom J Intern Med. 2019;57(1):61-7. 16. Nan R, Cursaru A, Grigorie D, Șucaliuc A. Markers of bone turnover and 25(OH) Vit-D in women with T2DM and newly diagnosed osteoporosis. Rom J Diabetes Nutr Metab Dis. 2016;23(1):73-9.
17. Wang L, Li T, Liu J, Wu X, Wang H, Li X, et al. Association between glycosylated hemoglobin A1c and bone biochemical markers in type 2 diabetic postmenopausal women: a cross-sectional study. BMC Endocrine Disorders. 2019;19(1):31.
18. Furst JR, Bandeira LC, Fan WW. Advanced
glycation Endproducts and bone material strength in type 2 diabetes. J Clin Endocrinol Metab. 2016;101(6):2502-10.
19. Varma M, Paneri S, Badi P. Correlative study of bone related Biochemical parameters in normal
postmenopausal women and hyperglycemic
postmenopausal women. Biomed Res.
2005;16(2):129-32.
20. Shu A, Yin MT, Stein E, Cremers S, Dworakowski E, Ives R, et al. Bone structure and turnover in type
2 diabetes mellitus. Osteoporosis Inter.
2012;23(2):635-41.
22. Movahed A, Larijani B, Nabipour I, Kalantarhormozi M, Asadipooya K, Vahdat K, et al. Reduced serum osteocalcin concentrations are associated with type 2 diabetes mellitus and the metabolic syndrome components in postmenopausal women: the crosstalk between bone and energy
metabolism. J Bone Mineral Metab.
2012;30(6):683-91.
23. Raska I, Raskova M, Zikan V, Skrha J. Body composition is associated with bone and glucose
metabolism in postmenopausal women with type 2 DM. Physiol Res. 2017;66:99-111.