Measuring Student Involvement: A Comparison
of Classical Test Theory and Item Response Theory
in the Construction of Scales from Student Surveys
Jessica Sharkness•Linda DeAngelo
Received: 11 January 2010 / Published online: 30 November 2010
The Author(s) 2010. This article is published with open access at Springerlink.com
Abstract This study compares the psychometric utility of Classical Test Theory (CTT) and Item Response Theory (IRT) for scale construction with data from higher education student surveys. Using 2008 Your First College Year (YFCY) survey data from the Cooperative Institutional Research Program at the Higher Education Research Institute at UCLA, two scales are built and tested—one measuring social involvement and one measuring academic involvement. Findings indicate that although both CTT and IRT can be used to obtain the same information about the extent to which scale items tap into the latent trait being measured, the two measurement theories provide very different pictures of scale precision. On the whole, IRT provides much richer information about measure-ment precision as well as a clearer roadmap for scale improvemeasure-ment. The findings support the use of IRT for scale construction and survey development in higher education. Keywords Student involvementItem Response Theory (IRT)Classical Test Theory (CTT)PsychometricsMeasurementScale development
One of the most widely studied areas in higher education is student involvement. ‘‘Involvement’’ is a complex concept that encompasses the ‘‘amount of [both] physical and psychological energy’’ that a student invests in college (Astin 1984/1999, p. 513). Thus broadly defined, involvement can mean different things to different researchers, and it conceptually overlaps with the related concepts of ‘‘integration’’ and ‘‘engagement’’ (Astin
1984/1999; Berger and Milem 1999; Kuh et al. 2001; NSSE 2000; Tinto1993,1998). Regardless of what it is called, research has consistently shown that the more students are active on campus and the more they feel a part of campus life, the more likely they are to
J. Sharkness (&)L. DeAngelo
Cooperative Institutional Research Program at the Higher Education Research Institute, University of California, Los Angeles, 3005 Moore Hall, Box 951521, Los Angeles, CA 90095-1521, USA
e-mail: [email protected] L. DeAngelo
e-mail: [email protected] DOI 10.1007/s11162-010-9202-3
have positive outcomes such as cognitive gains, satisfaction, and retention (Astin1993b; Berger and Milem1999; Kuh et al.2001; Kuh et al.2008; Pascarella and Terenzini1991,
2005; Tinto1993). As Pascarella and Terenzini write in their seminal 2005 synthesis of the higher education literature, ‘‘the impact of college is largely determined by individual effort and involvement in the academic, interpersonal, and extracurricular offerings on a campus’’ (p. 602).
Much of the literature demonstrating the positive effects of student involvement has come from scholars working with college student surveys such as those offered by the Cooperative Institutional Research Program (CIRP) and the National Survey of Student Engagement (NSSE). Indeed, the surveys from CIRP and NSSE have been instrumental in the development and testing of involvement and engagement theories (Astin1993b,1984/
1999; Kuh2001), and over the years researchers have used the CIRP and NSSE instru-ments to develop and examine a variety of involvement/engagement scales that measure everything from academic challenge and student-faculty interaction to diversity experi-ences (cf. Astin 1993b; Chang et al.2004; Chang et al.2008; CIRP 2006; Cole 2007; Franklin1995; Hurtado et al.2008; Hurtado et al.2007; NSSE2000,2008; Sax2008; Sax et al.2005).
Although much thought has been put into the aforementioned scales in terms of their content, surprisingly little systematic study of the scales’ construction has been done to date. The engagement scales developed by NSSE are ‘‘essentially unweighted indices of items’’ created ‘‘partially [through] an empirically derived grouping of survey items’’ but also partially through ‘‘an intuitive understanding’’ of ‘‘student development theory’’ (Gordon et al.2008, p. 20). The scales created by researchers using CIRP surveys have been developed individually so sweeping generalizations about scale construction are not possible, but most were created using methods similar to NSSE, i.e. by identifying a set of items that cover an area of interest, examining the correlations between the items with factor analysis, computing Cronbach’s alpha, and then summing the items to develop a measure of that area (e.g., Astin1993b).
Although not always explicitly stated, most extant scale construction using college student survey data has relied on principles drawn from Classical Test Theory (CTT). CTT is relatively simple to employ and has served measurement researchers well for many years, but since CTT was first popularized a more powerful measurement theory has been developed—Item Response Theory (IRT). IRT is theoretically and mathematically more sophisticated than CTT and can be used to obtain estimates of constructs and latent traits that have many desirable attributes (such as interval scale properties), yet it has largely been ignored by higher education researchers interested in measuring student involvement. The current study examines the appropriateness of IRT for higher education scale devel-opment by comparing the construction and evaluation of two involvement scales using both CTT and IRT. Specifically, the study investigates whether the application of IRT can improve research on involvement by providing different, potentially more useful infor-mation about the properties of scales and items than can CTT.
Conceptual Background
Classical Test Theory and Item Response Theory are the two primary measurement the-ories that researchers employ to construct measures of latent traits. Due to the fact that latent traits are by their very nature unobservable, researchers must measure them indi-rectly through a test, task, or survey. The reason unobservable traits can be accessed in
such a way is because the traits are assumed to influence the way that people respond to test or survey questions. While no perfect measure of a latent variable can ever exist, by examining how a person responds to a set of items relating to a single underlying dimension, researchers can create scores that approximate a person’s ‘‘level’’ of the latent trait. CTT and IRT are both tools that can be used to do this, but beyond their common purpose the two measurement systems are quite dissimilar. CTT and IRT differ signifi-cantly in their modeling processes, and they make fundamentally different assumptions both about the nature of the construct being measured as well as about how individuals respond to test items. A more in-depth treatment of CTT can be found in Lord and Novack (1968) and Allen and Yen (1979/2002), and more detail about IRT can be found in Embretson and Reise (2000). Below, an outline of each theory is sketched in order to compare the two as they relate to the measurement of constructs such as involvement.
Perhaps the most fundamental assumption of CTT is that a respondent’s observed score on a scale or test represents his or her ‘‘true’’ score plus random error. The true score for a test is defined as the mean of the theoretical distribution of test scores that would be obtained from repeated independent testings of the same person with the same test. Error consists of random, unsystematic deviations from true score that occur in each testing occasion. Because error is random it varies in every test administration, and as a conse-quence, observed score does also. True score, by contrast, is theoretically the same regardless of testing occasion. However, this does not mean that a person’s true score is ‘‘true’’ for every test or measure of the same construct—it is simply ‘‘true’’ for that person taking one specific test. That is, true scores are tied to a specific set of items as opposed to a ‘‘real’’ latent trait. CTT estimates of traits, then, are test-dependent, and every test or scale has different psychometric properties. Further, the CTT estimate of measurement error is sample-dependent, as the only way to estimate the standard error of measurement (SEM) is to use information from a group of respondents.
The fundamental assumption underlying IRT, by contrast, is that every respondent has some ‘‘true’’ location on a continuous latent dimension (often called ‘‘theta,’’ orh). This location theta is assumed to probabilistically influence a person’s responses to any item or set of items on a survey or test that relates to the trait that theta represents. IRT models theta by using mathematical equations that relate response patterns to a set of items, the psychometric properties of these items, and knowledge of how item properties influence responses. Embretson and Reise (2000) describe IRT as being ‘‘akin to clinical inference’’ (p. 54); IRT provides a ‘diagnosis’ (trait estimate) for a person based on observed ‘symptoms’ (response patterns) and background knowledge (a mathematical model). There are a variety of different IRT models that can be used to explain how items influence response behavior and how best to estimate theta; the choice of these depends on the nature of the data to be analyzed.
There are several differences between CTT and IRT that are important for researchers measuring involvement with scales from student surveys. First, in CTT a person’s ‘‘true score’’ is entirely dependent on a particular set of items because the true score is defined in relation to a specific test or scale. In IRT, a person’s ‘‘true score’’ is entirely independent of items because the underlying dimension of interest is only assumed to influence—it is not defined by—responses to test or survey items. Second, the standard error of measurement (SEM) is treated differently in CTT and IRT. Because of assumptions made about mea-surement error in CTT (i.e. that it is normally distributed within persons and homoge-neously distributed across persons), a test or scale’s reliability and SEM are estimated as a constant for all respondents (Allen and Yen1979/2002). IRT allows for the possibility of different scale SEMs for different values of theta, and allows items to differentially affect
SEM depending on how they relate to theta. The latter approach likely more realistically approximates how people respond to tests and surveys. It also allows researchers to con-struct scales that maximally differentiate people from one another, either across the entire theta continuum or on some critical area of the continuum. Finally, a consequence of all of the above is that CTT scale scores and their interpretation are always context-specific; in particular, they are item- and sample-specific. In IRT, the reverse is the case: item parameters are independent of sample characteristics, and theta estimates are independent of specific items. Assuming the selection of an appropriate IRT model, responses from any set of relevant (calibrated) items can be used to estimate a person’s theta.
Purpose of the Current Study
Given the importance that student involvement has for the work done by higher education researchers and practitioners, as well as the significant impact involvement has been shown to have on student outcomes, it is critical to investigate whether more accurate and sophisticated measurements of the construct can be obtained. To date, only one published study has used IRT to analyze involvement/engagement scales in higher education (Carle et al. 2009); all other assessments of such scales have relied, implicitly or explicitly, on principles drawn from CTT. No study has examined the similarities, differences, benefits and/or drawbacks of CTT and IRT as they relate to higher education scale development. Thus, the purpose of this study is to examine whether IRT can improve upon traditional CTT analyses of student involvement scales. The focus will be on comparing the infor-mation provided by CTT and IRT on two broad involvement scales of different types, one academic and one social. The academic scale focuses on the cognitive/behavioral domain of involvement, while the social involvement scale focuses on the affective/psychological domain. Most of the research on the effect of college has emphasized cognitive and/or affective areas, in part because of the ease of gathering this type of data on student questionnaires (Astin1993a). The following research questions guide the study:
(1) What do CTT and IRT tell us about the psychometric properties of scales measuring student involvement?
(2) Does the psychometric information provided by IRT duplicate, complement, or contradict that provided by CTT?
(3) What implications do these results have for researchers developing survey scales to study college student involvement?
Method Data
The data for this study are drawn from the CIRP’s 2008 Your First College Year (YFCY) Survey. The CIRP is a program of data collection and research housed at the Higher Education Research Institute (HERI) at the University of California, Los Angeles. Each year CIRP administers three surveys to college students across the country, one to entering freshmen, The Freshman Survey (TFS), one to students at the end of their first year (the YFCY), and one to graduating seniors, the College Senior Survey (CSS). Each of these surveys collects a wide variety of information about college student experiences, attitudes,
and outcomes, and each would provide a rich source of data to use in this investigation. The YFCY was chosen for use here because it was designed specifically to assess the cognitive and affective experiences and involvement of students during the first year of college (Keup and Stolzenberg2004), a critical time period for students in terms of their development and persistence (Astin1993b; Berger and Milem1999; Tinto1993). More accurate measurements of student involvement over the first year could improve research on the first-year experience, and could potentially help practitioners design programs that increase students’ chances of success over their entire college career. The 2008 YFCY dataset was chosen for use in particular because it is the largest and most nationally representative YFCY data to date, due to a sampling strategy that included students from institutions that have not previously participated in the survey. In addition, the 2008 YFCY survey included a new bank of items on academic engagement based on the work that Conley (2005) has done on the academic habits of successful college students.
Sample
The 2008 YFCY data set contains information on 41,116 students from 501 colleges and universities across the country. The plurality of responses are from students enrolled at private 4-year colleges; 49% of the overall sample was enrolled at this type of institution when taking the survey. An additional 16% of the sample comes from students enrolled at private universities, 20% from students at public universities, and 15% from students at public 4-year colleges. Most respondents are female (64%) and most are White/Caucasian (74%). Though exact comparison numbers are difficult to find, it is clear from numbers published by the College Board (2007), CIRP (Pryor et al.2007) and the National Center for Education Statistics (Snyder et al.2008) that the 2008 YFCY sample does not mirror exactly the national population of students. In particular, more YFCY respondents are white, female, and high-achieving than are students nationally; this is likely a function of the fact that students at private 4-year colleges are overrepresented in the YFCY data, as well as the fact that females and white students are generally more likely to respond to student surveys (Dey1997). That the 2008 YFCY sample differs as a whole from students nationally should not be a problem for this study as far as IRT is concerned because the psychometric properties of scales and items obtained by IRT are population-independent. However, CTT scale estimates and scores are much more population-dependent, so readers should be cautious when interpreting CTT statistics. The influence of the composition of the YFCY sample on the statistics produced in CTT and IRT will be further explored in ‘‘Discussion’’ section of this article.
Item Selection and Scale Analysis Initial Item Pool
Before any statistical analyses could be run, two pools of survey items that covered the intended social and academic involvement scales had to be identified. The selection of these initial item pools was guided by Astin’s original involvement theory (1984/1999), Pace’s (1979) work on ‘‘quality of effort,’’ and Hurtado’s and Carter’s (1997) discussion of the relationships between social and academic integration and student attachments to campus, or sense of belonging. For our study, we were interested in capturing both the cognitive/behavioral and affective/psychological domains of student involvement identi-fied by this previous theoretical and empirical work. We conceptualized our social
involvement construct as representing the ties a student feels to, and his or her satisfaction with, other students and the campus community, and our academic involvement construct as a measure of the amount of intellectual effort a student applies to his or her academic life. Appendices 1 and 2 list the 2008 YFCY items that were included in the initial academic and social involvement item pools.
Split Data for Scale Development and Confirmation
For the first part of our study, we randomly split our data into two (approximately) equally-sized samples (A and B), one to use for scale development and refinement, and one to use for evaluation and confirmation of the scales ultimately produced. The first step was scale development/refinement, which was done using exploratory factor analysis (EFA), a technique that researchers have recommended be used during the initial development of a scale or instrument (Kahn2006; Morizot et al.2007; Reise et al.2000; Clark and Watson
1995; Worthington and Whittaker2006). We followed guidelines from Reise et al. (2000), Kahn (2006), Russell (2002) and Worthington and Whittaker (2006) when conducting the iterative process of EFA, with the ultimate goal of producing a set of items that measured one and only one underlying latent trait. Once the set of items was decided upon, we proceeded to the scale evaluation and confirmation step, which was done using confir-matory factor analysis (CFA). Again following guidelines from the above researchers, we used CFA to test our hypotheses regarding the factor structures identified in the EFA. In particular, we tested whether one underlying factor adequately explained the covariation between each set of items. In the CFA process, we focused on indices of model fit, which assessed the plausibility of the unidimensional factor structures.
Sample A, which was used for the exploratory factor analyses and item-selection process, contained 20,639 cases (50.2% of the total sample). Sample B, which was used for confirmatory factor analytic purposes, contained 20,479 cases (49.8%). After each scale’s items were selected and the confirmatory analyses were run, we combined the data back into one large sample for the remainder of our analyses.
Exploratory Factor Analyses for Item Selection (Sample A)
The items in the initial pools were evaluated via exploratory factor analysis on Sample A to determine each item’s fitness as an indicator of academic or social involvement. Note that due to the ordinal nature of item responses on the YFCY, polychoric correlations were employed for all relevant analyses in the place of the more traditional but less appropriate Pearson correlations. Pearson correlations between ordinal categorical variables are biased estimates of the variables’ true correlations (Olsson 1979), and the results of factor analyses based on Pearson correlation matrices can lead to spurious results and incorrect conclusions (Dolan1994; Jo¨reskog and Sorbom1989). All polychoric correlations were computed using the software R 2.9.0 (R Development Core Team2009) and the maximum likelihood estimation algorithm in the polycor package (Fox2009). R was also used, along with Revelle’s psych library (2009), to conduct exploratory factor analyses. Following Russell’s (2002) recommendations, these exploratory analyses employed principal axis factoring with promax rotation (an oblique rotation).
The goal of exploratory factor analysis is to determine whether the variance shared by a set of items can be explained by a reduced number of latent variables (factors). In the context of scale development, researchers using factor analysis are interested in whether the interrelationships between the variables in a scale can be best explained by one and
only one underlying factor (Clark and Watson1995; Cortina1993; Gardner 1995; Reise et al.2000; Russell2002). If a scale’s variables are clearly influenced by only one factor, what is called ‘‘factorial validity’’ in CTT is achieved (Allen and Yen1979/2002), and a case for ‘‘unidimensionality’’ in IRT can be made (Embretson and Reise2000). Factorial validity and unidimensionality are desirable because researchers using a scale typically want to measure only one dimension—the latent trait of interest. If a single-factor solution does not fully explain the intercorrelations between scale items, or if there are sets of items that share correlations that cannot be explained by one underlying factor, then the scale cannot be said to measure only what it is designed to measure (Hattie1985; Reise et al.
2000).
Initial exploratory factor analyses were run on the full set of ten social and ten academic involvement variables listed in the appendices. Based on the results of these analyses, three items were removed from the social involvement item pool and four were removed from the academic involvement item pool. The first item to be removed from the social involvement scale was one that asked about how often students interacted with their close friends on campus. This variable was removed because it was found that more than 80% of students responded that they interact with their friends ‘‘daily,’’ and most of the remaining students (14%) responded that they interacted with their friends ‘‘once a week’’ or ‘‘2–3 times a week’’—almost no students interacted with their friends less frequently. As a result, contingency tables using this variable were very sparse and polychoric correlations could not be computed. The variable was dropped from the analysis because it was decided that even if the response categories with few respondents were collapsed, the variable would not be very useful in differentiating students’ levels of social involvement. Next, the variable representing the number of hours per week students reported socializing with their friends was dropped. This item was removed from the pool due to its surprisingly low factor loading in a one-factor solution (0.33 vs. over 0.48 for all other loadings); the best factor analytic solution had the hours-per-week-socializing variable loading essentially by itself on a factor.
Finally, the variable representing the ease with which students reported developing close friendships with male students was removed. This last removal deserves a somewhat more detailed explanation than that given for the variables above, as it may seem con-ceptually odd to include the ‘‘close friendships with female students’’ but not the ‘‘close friendships with male students’’ item in a scale. Essentially, the male friendships variable was removed because it had a relatively high correlation with the ‘‘female friendship’’ variable (r=0.46), and this correlation proved to be unexplained by a factor model assuming only one underlying latent trait (the residual correlation between the two vari-ables, calculated as the difference between the observed and model-reproduced correlation matrix, was 0.20). Such a large amount of unexplained covariance based on a one-factor solution is likely due to what is called a ‘‘local dependence’’ between the female and male friendship variables. That is, the correlation between the two variables seems to be due not only to the underlying latent variable of interest (social involvement) but also due to a secondary content dimension (the ease with which student develops friendships in general). While in CTT this is not necessarily a concern, in IRT a local dependence is a serious problem because it can distort the estimated item parameters. A set of variables achieves local independence when, after controlling for the reason for the variables’ intercorrela-tions (i.e. the common underlying factor), the variables are independent of one another, or no longer correlated. We were interested in creating one social involvement scale to analyze in both IRT and CTT, so the male friendships variable was removed. The male
friendship variable was removed instead of the female friendships variable because the male friendships variable had lower correlations with all of the other variables.
In terms of the academic involvement items, all four removed variables were taken out of the scale due to local independence violations. When a one-factor solution with the full set of ten variables was run, six pairs of variables showed reproduced correlations that deviated from their actual correlations by a magnitude of 0.13 or more, which we judged too high for the variables to be considered uncorrelated. Two of these pairs involved the item that reflected the frequency with which students ‘‘revised their papers to improve their writing,’’ so this item was removed first. When a factor analysis specifying one factor was run on the resulting set of nine items, four non-redundant residual correlations greater than 0.13 were still observed. To reduce the influence of the secondary content dimensions that these residual correlations represented, three more variables were removed via a process that considered statistical indicators (factor loadings, residual correlations, item-total and inter-item correlations) as well as theoretical concerns (i.e. which items best represent the broad academic involvement construct of interest or overlap least (conceptually) with other items). In order, the removed variables were those that asked students how often they ‘‘took a risk because they felt they had more to gain,’’ ‘‘asked questions in class,’’ and ‘‘sought solutions to problems and explained them to others.’’
Confirmatory Factor Analysis (Sample B)
To evaluate the factor structures that were suggested by the EFAs performed on Sample A, we used Sample B to conduct a confirmatory factor analyses for ordered-categorical measures on the reduced academic and social involvement item sets. We ran the CFAs using EQS 6.2, a structural equation modeling software (Bentler2006). To ensure that we used the correct modeling procedures, we first evaluated the multivariate normality of each set of items, as this is a key assumption of the maximum likelihood (ML) estimation method that we employed. Both sets of items showed significant departure from multi-variate normality; the normalized estimate of Mardia’s coefficient, which assesses whether the set of measured variables are distributed normally and which can be interpreted as a z-score (Ullman 2007), was 126.17 for the social involvement items and 23.13 for the academic involvement items. To correct for the observed multivariate non-normality, we used a robust ML method in all of our estimation procedures (Bentler2006). Specifically, we used METHOD=ML, ROBUST in EQS, which provides us with fit statistics that employ the Yuan–Bentler correction for non-normal data, as well as robust standard errors that are adjusted for non-normality (Bentler2006).
We ran the academic and social involvement scales’ CFAs separately; in both cases we specified one factor with paths estimated from the latent construct to each item. We did not allow errors to correlate, and for model identification purposes we set the variance of the factor and the paths for each error term to one. As previous authors have suggested (Laird et al.2005), we followed the guidelines by Raykov et al. (1991) and Boomsma (2000) and examined the following model fit measures: the Normed Fit Index (NFI), the Non-Normed Fit Index (NNFI), and the Comparative Fit Index (CFI), as well as the misfit index Root Mean Square Error of Approximation (RMSEA). Ullman (2007) has given guidelines about the values these indices should take for a well-fitting model: the NFI, NNFI and CFI should be greater than 0.95, and the RMSEA should be under 0.06 (and should certainly not exceed 0.10). Because of the non-normality of the data in this study, the fit indices examined were the ones that employed the Yuan–Bentler correction (Bentler2006).
Both the Academic Involvement and Social Involvement CFAs showed adequate to excellent fit. The academic involvement CFA showed the best fit (NFI=0.998; NNFI=0.996; CFI=0.998; RMSEA=0.024), while the social involvement CFA showed more moderate, but still acceptable fit (NFI=0.986; NNFI=0.978; CFI=0.986; RMSEA=0.068). The factor loadings estimated for the academic and social involvement items in each CFA were virtually identical to those obtained in the EFAs. Because the results of our EFA on Sample A and CFA on Sample B dovetailed so nicely, we judged our final item pools for academic and social involvement to be valid for the purposes of this study. Going forward, we recombined samples A and B and used the full sample for all further analyses.
Final Scales (Entire Sample)
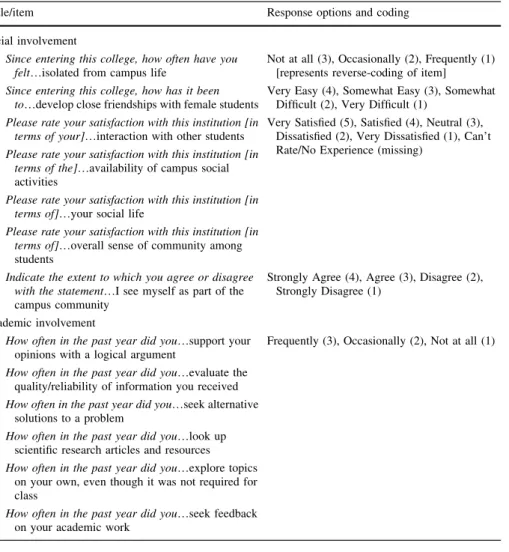
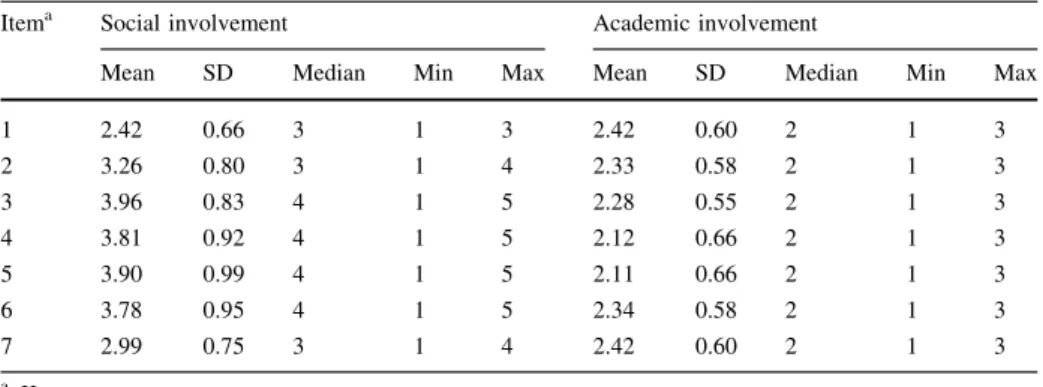
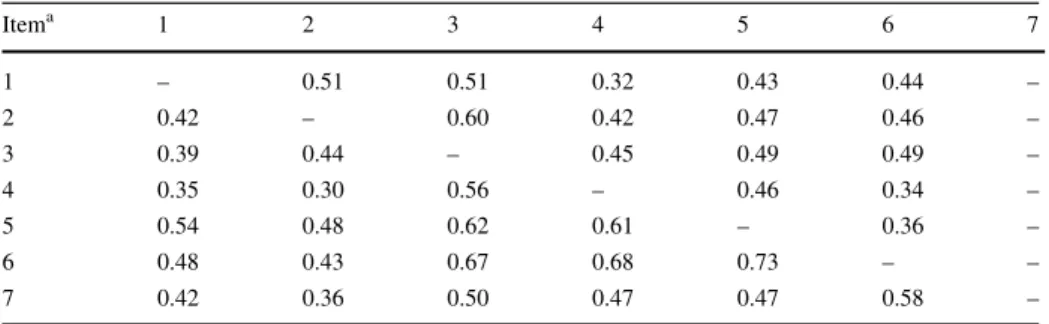
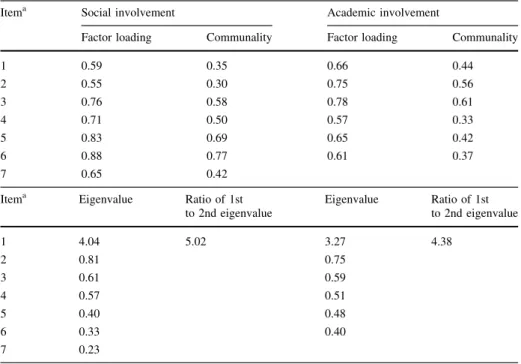
Table1 lists the items that comprise the final social and academic involvement scales examined in this study as well as each item’s response options and coding. Means and standard deviations of the variables in each scale are shown in Table2, and the polychoric correlations between the variables are shown in Table3. Table4 shows the final factor loadings for the items in each scale, based on a one-factor solution utilizing the entire dataset. The purpose of this final factor analysis was to assess the unidimensionality of each scale; that is, to assess whether each set of items measure one and only one underlying trait (Morizot et al.2007). As can be seen in Table4, a single factor solution is the most appropriate for both the academic and social involvement items, and therefore we can say that both sets of items are unidimensional and achieve factorial validity. Among both sets of items, the first eigenvalues are by far the largest, and are the only eigenvalues greater than one. Further, the ratio of the first to second eigenvalue is 5.02 for the social involvement items, and 4.38 for the academic involvement items. These ratios are both high, and this fact, combined with the fact that all but the first eigenvalues are quite small (and relatively similar in size), provide evidence that a one-factor solution is the most appropriate (Hutten1980; Lord1980).
Additional evidence supporting a one-factor (unidimensional) solution for the social and academic involvement items is found in a residual analysis comparing the model-repro-duced correlation matrices to the observed correlation matrices. In a residual analysis, if the differences between the single-factor model-reproduced correlations and the observed correlations are small and are clustered closely around zero, it can be said that the single factor solution is appropriate (McDonald1982; Reise et al.2000; Tabachnick and Fidell
2007). For the two sets of variables in this study, a one factor solution reproduced the observed correlations well—the residual correlations among the social involvement items had a mean of-0.001 and a variance of 0.002, and the residuals among the academic involvement items had a mean of mean of 0.002 and a variance of 0.001. Further, most residuals had absolute values less than 0.05, and none exceeded 0.09. These results not only argue for unidimensionality but also, as discussed above, provide evidence of ‘‘local independence,’’ which is a critical assumption of IRT.
Results from the final factor analyses on the academic and social involvement items are also shown in Table4. The factor loadings of each scales’ items are all moderate to high (Comrey and Lee1992), ranging from 0.55 to 0.88 for the social involvement scale (all but two are above 0.60) and from 0.57 to 0.78 for the academic involvement scale (all but one are above 0.60). These loadings indicate that the scale development procedure just described was successful in yielding two sets of items that contribute well to the mea-surement of the latent traits of interest.
Results CTT Analysis
Table5shows the statistics commonly used to analyze a scale under the rubric of CTT for both the academic and social involvement scales. These include Cronbach’s alpha, item-total correlations, alpha if item deleted, and average item intercorrelations (Allen and Yen
1979/2002; Russell2002). Cronbach’s Alpha
Although commonly used otherwise, alpha can only be used as part of the assessment of— and not the final or sole determination of—unidimensionality. Alpha is a measure of internal consistency, or the overall degree to which the items in a scale correlate with one another. As Cortina (1993) explains, it is ‘‘a function of interrelatedness, although one must
Table 1 Items comprising the social and academic involvement scales
Scale/item Response options and coding
Social involvement
1 Since entering this college, how often have you
felt…isolated from campus life
Not at all (3), Occasionally (2), Frequently (1) [represents reverse-coding of item] 2 Since entering this college, how has it been
to…develop close friendships with female students
Very Easy (4), Somewhat Easy (3), Somewhat Difficult (2), Very Difficult (1)
3 Please rate your satisfaction with this institution [in terms of your]…interaction with other students
Very Satisfied (5), Satisfied (4), Neutral (3), Dissatisfied (2), Very Dissatisfied (1), Can’t Rate/No Experience (missing)
4 Please rate your satisfaction with this institution [in terms of the]…availability of campus social activities
5 Please rate your satisfaction with this institution [in terms of]…your social life
6 Please rate your satisfaction with this institution [in terms of]…overall sense of community among students
7 Indicate the extent to which you agree or disagree with the statement…I see myself as part of the campus community
Strongly Agree (4), Agree (3), Disagree (2), Strongly Disagree (1)
Academic involvement
1 How often in the past year did you…support your opinions with a logical argument
Frequently (3), Occasionally (2), Not at all (1) 2 How often in the past year did you…evaluate the
quality/reliability of information you received 3 How often in the past year did you…seek alternative
solutions to a problem
4 How often in the past year did you…look up scientific research articles and resources 5 How often in the past year did you…explore topics
on your own, even though it was not required for class
6 How often in the past year did you…seek feedback on your academic work
remember that this does not imply unidimensionality…a set of items…can be relatively interrelated and multidimensional’’ (p. 100). Therefore, only if a factor-analytic technique is used to ensure that no departures from unidimensionality are present among a set of items can alpha be used to conclude that the set is unidimensional. In this study, the factor analyses (above) provided sufficient evidence that only one latent factor produced the correlations between the academic/social involvement variables. Therefore, the computa-tion of Cronbach’s alpha for the scales is justifiable and interpretable. The social involvement scale’s alpha was 0.83, and the academic involvement scale’s alpha was 0.76; both alpha coefficients indicate a good degree of internal consistency. An examination of the alphas that would be obtained upon the deletion of each item in the scales shows that alpha would only decrease if any item were removed from either scale. The only exception to this pattern was for item 2 in the social involvement scale (ease of developing friend-ships with female students), which would not affect alpha were it to be removed. No item seems to be negatively affecting the overall alpha value.
Item-Total and Average Item Intercorrelations
Table5also shows the average correlations between each item and all of the other items, as well as the corrected item-total correlations, which are computed as the correlation between an item and the sum of all other items in the scale. The average inter-item correlations were higher for the social involvement items than the academic involvement
Table 2 Means and standard deviations of items comprising the social and academic involvement scales
Itema Social involvement Academic involvement
Mean SD Median Min Max Mean SD Median Min Max
1 2.42 0.66 3 1 3 2.42 0.60 2 1 3 2 3.26 0.80 3 1 4 2.33 0.58 2 1 3 3 3.96 0.83 4 1 5 2.28 0.55 2 1 3 4 3.81 0.92 4 1 5 2.12 0.66 2 1 3 5 3.90 0.99 4 1 5 2.11 0.66 2 1 3 6 3.78 0.95 4 1 5 2.34 0.58 2 1 3 7 2.99 0.75 3 1 4 2.42 0.60 2 1 3 a Key:
Item Social involvement Academic involvement
1 Freq:Isolated from campus life (reverse-coded) Freq:Support opinions with logical argument 2 Ease:Develop close friendships with female
students
Freq:Evaluate quality/reliability of information 3 Satisfaction:Interaction with other students Freq:Seek alternative solutions to a problem 4 Satisfaction:Availability of campus social
activities
Freq:Look up scientific research articles and resources
5 Satisfaction:Your social life Freq:Explore topics on own when not required 6 Satisfaction:Overall sense of community among
students
Freq:Seek feedback on your academic work 7 Agree:I see myself as part of the campus
items; all of the average social involvement inter-item correlations were 0.38 or above while the maximum for the academic involvement items was 0.36. However, the corrected item-total correlations, which provide a measure of the relationship between each item and the overall scale, are all relatively high for both the academic and social involvement items—most are around 0.50 or above. Overall, the sets of correlations just described suggest that each scale item coheres very well with the overall construct and that each item contributes to the measurement of the overall construct.
Conclusions from CTT Analyses
The CTT analyses provide evidence that the seven social involvement items and six academic involvement items function well as measures of their respective involvement types. The items in the social involvement scale have good internal consistency, show high corrected item-total correlations, and the factor loadings for each item (based on a one-factor solution) are all high. The items in the academic involvement scale have slightly more moderate internal consistency but also show high corrected item-total correlations and factor loadings. Thus, it seems reasonable to conclude that each scale measures one underlying trait. Indeed, the analyses just presented would typically provide a researcher justification to sum or average the scales’ items to create a single number representing a student’s ‘‘level’’ of academic and social involvement. However, there are additional analyses, based on IRT, which can provide more—and possibly different—information about the fitness of the items and the scales.
Table 3 Polychoric correlations between the items comprising the social and academic involvement scales
Itema 1 2 3 4 5 6 7 1 – 0.51 0.51 0.32 0.43 0.44 – 2 0.42 – 0.60 0.42 0.47 0.46 – 3 0.39 0.44 – 0.45 0.49 0.49 – 4 0.35 0.30 0.56 – 0.46 0.34 – 5 0.54 0.48 0.62 0.61 – 0.36 – 6 0.48 0.43 0.67 0.68 0.73 – – 7 0.42 0.36 0.50 0.47 0.47 0.58 –
Note: Correlations among social involvement items are below the diagonal; correlations for academic
involvement items are above the diagonal a
Key:
Item Social involvement Academic involvement
1 Freq:Isolated from campus life (reverse-coded) Freq:Support opinions with logical argument 2 Ease:Develop close friendships with female
students
Freq:Evaluate quality/reliability of information 3 Satisfaction:Interaction with other students Freq:Seek alternative solutions to a problem 4 Satisfaction:Availability of campus social
activities
Freq:Look up scientific research articles and resources
5 Satisfaction:Your social life Freq:Explore topics on own when not required 6 Satisfaction:Overall sense of community among
students
Freq:Seek feedback on your academic work 7 Agree:I see myself as part of the campus
IRT Analyses
The Graded Response Model
Because the items in this study’s involvement scales are coded into ordinal categories scored on Likert scales, the appropriate IRT model to apply is Samejima’s (1969) graded response model (GRM; for more details see Embretson and Reise 2000 and Ostini and Nering2006). A few brief notes about IRT and the GRM are needed before the analyses
Table 4 Factor loadings, communalities, and eigenvalues for the items comprising the social and academic involvement scales
Itema Social involvement Academic involvement
Factor loading Communality Factor loading Communality
1 0.59 0.35 0.66 0.44 2 0.55 0.30 0.75 0.56 3 0.76 0.58 0.78 0.61 4 0.71 0.50 0.57 0.33 5 0.83 0.69 0.65 0.42 6 0.88 0.77 0.61 0.37 7 0.65 0.42
Itema Eigenvalue Ratio of 1st
to 2nd eigenvalue Eigenvalue Ratio of 1st to 2nd eigenvalue 1 4.04 5.02 3.27 4.38 2 0.81 0.75 3 0.61 0.59 4 0.57 0.51 5 0.40 0.48 6 0.33 0.40 7 0.23
Extraction Method: Principal axis factoring, promax rotation; polychoric correlation matrices used for analyses
a Key:
Item Social involvement Academic involvement
1 Freq:Isolated from campus life (reverse-coded) Freq:Support opinions with logical argument 2 Ease:Develop close friendships with female
students
Freq:Evaluate quality/reliability of information 3 Satisfaction:Interaction with other students Freq:Seek alternative solutions to a problem 4 Satisfaction:Availability of campus social
activities
Freq:Look up scientific research articles and resources
5 Satisfaction:Your social life Freq:Explore topics on own when not required 6 Satisfaction:Overall sense of community among
students
Freq:Seek feedback on your academic work 7 Agree:I see myself as part of the campus
and results can be described. Fitting the GRM to a set of polytomous items results in the estimation of two types of parameters. Each item (i) has a discrimination or ‘‘slope’’ parameter, represented byai, which provides an indicator of how well an item taps into the
underlying trait of interest (which here is involvement). Items that have higher discrimi-nations (a’s) provide more information about the trait. Each item also has a series of threshold parameters associated with it. The number of threshold parameters for an item is equal to the number of item response categories minus one (k-1); the thresholds are here represented asbi,1,bi,2,…,bi,k-1. The threshold parameters (b’s) are given on the same
metric as the underlying trait (h), which for model identification purposes is assumed to have a standard normal distribution with a mean of 0 and a standard deviation of 1 (Embretson and Reise2000). Therefore, thebparameters can essentially be interpreted on a z-score metric. Each item’saiandbi,k-1parameters are used to plot what are known as
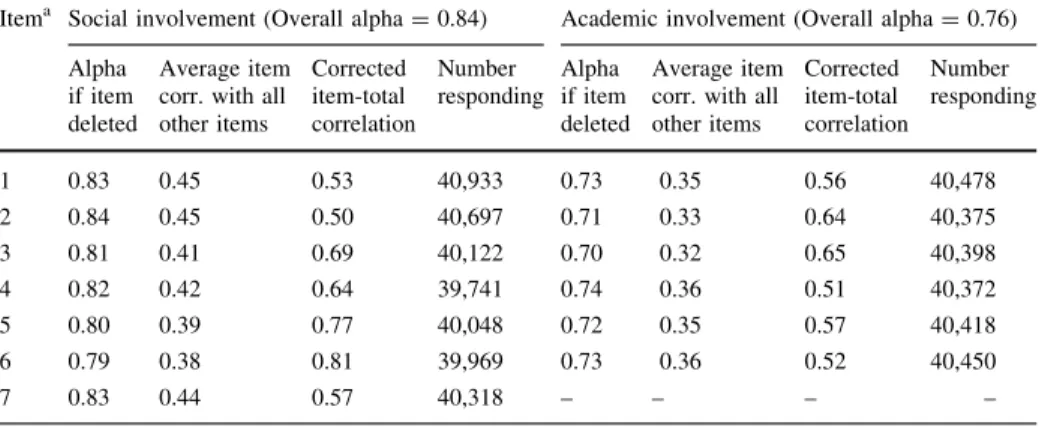
category response curves (CRCs), which visually represent the probability of a respondent answering an item in each possible response category as a function of his or her level of involvement. The parameters are also used to plot item information functions (IIFs), which display the amount of psychometric information that each item provides at various levels of involvement. Summing the IIFs produces a scale information function (SIF) that shows how much information the scale as a whole provides, as a function of involvement. In general, the higher an item’s slope parameter (ai), the more narrow and ‘‘steep’’ are the
Table 5 Typical ‘‘Classical Test Theory’’ item statistics
Itema Social involvement (Overall alpha=0.84) Academic involvement (Overall alpha=0.76)
Alpha if item deleted
Average item corr. with all other items Corrected item-total correlation Number responding Alpha if item deleted Average item corr. with all other items Corrected item-total correlation Number responding 1 0.83 0.45 0.53 40,933 0.73 0.35 0.56 40,478 2 0.84 0.45 0.50 40,697 0.71 0.33 0.64 40,375 3 0.81 0.41 0.69 40,122 0.70 0.32 0.65 40,398 4 0.82 0.42 0.64 39,741 0.74 0.36 0.51 40,372 5 0.80 0.39 0.77 40,048 0.72 0.35 0.57 40,418 6 0.79 0.38 0.81 39,969 0.73 0.36 0.52 40,450 7 0.83 0.44 0.57 40,318 – – – – a Key:
Item Social involvement Academic involvement
1 Freq:Isolated from campus life (reverse-coded) Freq:Support opinions with logical argument 2 Ease:Develop close friendships with female
students
Freq:Evaluate quality/reliability of information 3 Satisfaction:Interaction with other students Freq:Seek alternative solutions to a problem 4 Satisfaction:Availability of campus social
activities
Freq:Look up scientific research articles and resources
5 Satisfaction:Your social life Freq:Explore topics on own when not required 6 Satisfaction:Overall sense of community among
students
Freq:Seek feedback on your academic work 7 Agree:I see myself as part of the campus
associated CRCs, and the more its IIF will peak. The wider the spread of the bi,k-1
threshold parameters, the more spread out are the CRCs and the more spread out the IIF’s highest values will be.
IRT discrimination (a) and threshold (b) parameters can also be interpreted without looking at a graphical plot of the functions that they describe. In general, discrimination parameters are interpreted as the strength of association between an item and the under-lying trait; in many respects these parameters are similar to factor loadings or item-total correlations. Discrimination parameters above 1.70 are considered very high, those between 1.35 and 1.70 are high, and those between 0.65 and 1.34 are moderate (Baker
2001).1Threshold parameters can be interpreted as the points on the latent trait continuum (i.e. the ‘‘level’’ of involvement) at which a respondent has a 50% probability of responding to an item in a certain response category or above and a 50% of responding in any other lower category (Embretson and Reise2000). To illustrate, if a three-category itemi, such as one that has response options of never, occasionally and frequently, has a
bi,1of-2.0 and abi,2of 0.0, this means that the model predicts a respondent with a level of
the relevant latent trait two standard deviations below the mean (h= -2.0) has a 50% chance of responding in the first category (never) and a 50% chance of responding in the second or third category (occasionally/frequently), while a respondent with a latent trait level at the mean (h=0.0) has a 50% chance of responding in the first or second category (never/occasionally) and a 50% chance of responding in the third category (frequently). Respondents who fall below -2.0 on the latent trait level are most likely to respond ‘‘never,’’ those between-2.0 and 0.0 are most likely to respond ‘‘occasionally,’’ and those above 0.0 are most likely to respond ‘‘frequently.’’ The amount of information an item provides about any given area of the latent trait depend on the value of thebi,k-1’s and on
how clustered or spread out they are.
The following discussion of the IRT analysis of the social and academic involvement scales will have three parts. First, the discrimination parameters (ai) will be examined.
Next, the threshold parameters (bi,k-1) will be explored. Finally, the graphical output of the
analyses will be inspected. For the analysis, Samejima’s GRM model was applied to the social and academic involvement data usingMULTILOG 7(Thissen et al.2002). Discrimination Parameters
Table6displays theaiparameter estimates for the social and academic involvement scale
items. Among the social involvement items, discriminations range from a high of
a6=3.65 to the relatively low, but still relatively strong,a2=1.10 anda1=1.23. Most
of the seven social involvement item discrimination parameters fall between 1.54 and 2.77, which are all high or very high values (Baker 2001). This means that most items are contributing a relatively large amount of information to the measurement of social involvement, and that the rest are contributing a moderate but not trivial amount. Similarly, each of the academic involvement items’ discrimination parameters are moderate to high; they all fall between 1.25 and 2.27. Overall, both scales seems to be comprised of 1
Note that these numbers assume that thea’s were estimated using a logistic function that does not include a
D=1.7 constant in the numerator of the equation. The inclusion or exclusion of this constant is unimportant
in terms of the discussion in this paper, as it has to do with equating normal ogive functions and logistic functions and does not affect the parameter estimation procedure. However, it does affect parameter
inter-pretation. Specifically, when a model that estimates item parameters does not include the D=1.7 constant,
thea’s that are estimated are higher by a magnitude of 1.7 as compared to those estimated by a model that
Ta ble 6 IRT par ameter estim ates and stand ard errors for the social and acad emic involve ment scales Item a Soci al involve ment Acade mic involv emen t # Resp . opt ions a b b 1 b 2 b 3 b 4 # Resp . options a b b 1 b 2 1 3 1.23 (0.02) -2.17 (0.03) -0.02 (0 .01) 3 1.58 (0.02) -2.35 (0 .03) 0.07 (0 .07) 2 4 1.10 (0.02) -3.56 (0.05) -1.78 (0 .03) 0.27 (0.01) 3 2.07 (0.02) -2.03 (0 .02) 0.34 (0 .01) 3 4 2.11 (0.03) -3.01 (0.04) -2.02 (0 .02) -0.85 (0.01) 3 2.27 (0.02) -2.04 (0 .02) 0.52 (0 .01) 4 5 2.03 (0.02) -2.65 (0.03) -1.77 (0 .02) -0.64 (0.01) 1.06 (0.01) 3 1.25 (0.01) -1.65 (0 .02) 0.90 (0 .02) 5 5 2.77 (0.02) -2.27 (0.02) -1.48 (0 .01) -0.67 (0.01) 0.67 (0.01) 3 1.51 (0.01) -1.46 (0 .02) 0.88 (0 .01) 6 5 3.65 (0.03) -2.15 (0.02) -1.42 (0 .01) -0.48 (0.01) 0.87 (0.01) 3 1.40 (0.02) -2.53 (0 .03) 0.38 (0 .01) 7 4 1.54 (0.02) -2.50 (0.03) -1.29 (0 .02) 1.13 (0.01) – – – – Sta ndard errors are in pa renthes es a Key: Item Socia l inv olvemen t Academic involv emen t 1 Freq: Isolate d from campus life (reverse-co ded) Freq: Sup port opinio ns with logical arg ument 2 Ease: Develo p close friendships with femal e stu dents Freq: Eval uate qual ity/reliability of informat ion 3 Sat isfact ion: In teraction wit h other student s Freq: See k alternative solutions to a p roblem 4 Sat isfact ion: A vailabi lity of camp us social activities Freq: Look up scient ific res earch articles and resources 5 Sat isfact ion: Y our social life Freq: Expl ore top ics on own when not required 6 Sat isfact ion: O verall sense of com munity amo ng stude nts Freq: See k feedbac k o n your academic work 7 Agree : I se e myse lf as part of the camp us com munity b Note that the dis crimin ation par ameters ( a ) m u st b e interpre ted on a logistic metr ic
appropriate items that contribute non-trivially to the measurement of the relevant type of involvement.bNote that the discrimination parameters (a) must be interpreted on a logistic metric
Threshold Parameters
Different patterns emerge when thebi,k-1threshold parameters for the academic and social
involvement items are examined. As can be seen in the left-hand side of Table6, the vast majority of the threshold parameters for the social involvement items are negative—of the 23bi,k-1estimates, 18 are below zero. The thresholds for the lowest item categories range
from-3.56 (b2,1) to-2.15 (b6,1), while the thresholds for the highest categories range
from-0.02 (b1,2) to 1.13 (b7,3). Almost without exception, each social involvement item’s
thresholds are negative until the highest possible threshold, at which point they cross into the positive range. The only exception to this pattern occurs for item 1 (frequency of feeling isolated), for which even the highest threshold parameter is negative. What can be taken from this collection of threshold coefficients is that the social involvement item threshold parameters do not evenly span the social involvement continuum; the coverage of the negative (below-average) side of the continuum is better than the coverage of the positive (above-average) side.
By contrast, the right-hand side of Table6 shows that the items in the academic involvement scale generally havebi,k-1parameters that are more evenly spread out around
zero. Half of the academic involvement item thresholds are negative, and the remainder are positive. However, despite the more even balance of positive and negative parameters, the academic involvement items’ threshold values are also not well distributed along the entire latent trait range. Rather, they span the academic involvement continuum from only-2.5 to 0.90. Further, many of thebi,1andbi,2parameters have similar values to one another. For example, the first threshold parameter for item 2 (b2,1) is-2.03 while for item 3 (b3,1)
it is-2.04, and the second threshold parameter for item 4 (b4,2) is 0.90 while for item 5
(b5,2) it is 0.88. Two main points can be taken from the patterns shown by the academic
items’ threshold parameters. First, the thresholds cover only certain areas of the continuum, with the best coverage provided in the negative, or below-average portion of the contin-uum. Second, due to the similar values that many of the parameters take, the coverage that the parameters do provide is clustered in certain areas of the latent trait continuum. This is especially true on the positive side of the continuum, as the highest threshold parameters (bi,2’s) have a particularly restricted range, from just 0.34 to 0.90.
Two important conclusions can be drawn from the values of the social and academic involvement items’ threshold parameters described above. First, because the highest social and academic threshold parameters (which mark the latent level of involvement that a student needs to have in order to be most likely respond in the highest category for each item) occur at relatively low values ofh, students who are high on either trait have few response options that can describe their social and intellectual involvement on campus. In most cases, only the highest category describes their involvement. By contrast, students who are below average in involvement have a larger number of response options (all but the highest category for each item) that can describe their attachments and intellectual activities on campus, and this is especially true for the social involvement items because these items’ threshold parameters span virtually all of the levels of below-average involvement that are likely to be observed. Second, the overlapping academic involvement thresholds suggest that despite the different content represented by the items, several of the items are in a sense the ‘‘same’’ because they tap into the latent academic involvement
continuum in the same way. In terms of measurement precision these variables are redundant, as items whose threshold parameters fall very close to those of other items provide information about the same narrow part of the latent trait continuum.
In total, the IRTbparameters for the social involvement scale suggest that the scale discriminates best among students who have negative (i.e. below average) involvement levels, while it discriminates less well (or not at all) among students who have social involvement levels more than one standard deviation above the mean. Similarly, the b
parameters for the academic involvement scale also suggest that the scale discriminates better among students who are low in academic involvement than among those who are high. Further, the clustered nature of the academic involvementbparameters implies that there are narrow areas of the academic involvement continuum at which the scale dis-criminates very well and other areas at which it does not discriminate well at all. These conclusions are supported in the graphical plots of CRCs and SIFs, which are discussed below.
Graphical Plots of IRT Analyses
The above conclusions about the functioning of the social and academic involvement scales are corroborated by examinations of the relevant CRCs (Figs.1, 2) and SIFs (Fig.3a, b). As can clearly be seen in the CRCs, the rightmost two curves for the items in both scales (e.g. the curves labeled 2 and 3 in Fig.1(item 1), those labeled 3 and 4 in
1 2 3 4 5 0.0 0.2 0.4 0.6 0.8 1.0 -3 -2 -1 0 1 2 3 Pr o b . o f re sp o n se
Social Involvement Level
Item 4.Sa tisfa ction with ava ilability of ca mpus socia l a ctivities
1 2 3 4 5 0.0 0.2 0.4 0.6 0.8 1.0 -3 -2 -1 0 1 2 3 Pr o b . o f re sp o n se
Social Involvement Level
Item 5.Sa tisfa ction with your socia l life
1 2 3 4 5 0.0 0.2 0.4 0.6 0.8 1.0 -3 -2 -1 0 1 2 3 Pr o b . o f re sp o n se
Social Involvement Level
Item 6.Satisfaction with the overa ll sense of community a mong students
1 2 3 4 0.0 0.2 0.4 0.6 0.8 1.0 -3 -2 -1 0 1 2 3 P rob . of r e sp o n se
Social Involvement Level
Item 7. Agreement: I see myself as pa rt of the ca mpus community 1 2 3 0.0 0.2 0.4 0.6 0.8 1.0 -3 -2 -1 0 1 2 3 Pr o b . o f re sp o n se
Social Involvement Level
Item 1.Frequency of feeling isola ted from campus life 1 2 3 4 0.0 0.2 0.4 0.6 0.8 1.0 -3 -2 -1 0 1 2 3 Pr o b . o f re sp o n se
Social Involvement Level
Item 2.Ease of developing close friendships with female students
1 2 3 4 0.0 0.2 0.4 0.6 0.8 1.0 -3 -2 -1 0 1 2 3 P ro b . o f re sp o n se
Social Involvement Level
Item 3.Sa tisfa ction with intera ctions with other students
Fig.1(item 2), and so on), which represent the probability of responding to the items in the second highest and highest response categories respectively, intersect at involvement levels close to 0 or 1. The fact that these intersections occur at only average or slightly
1 2 3 0.0 0.2 0.4 0.6 0.8 1.0 -3 -2 -1 0 1 2 3 P rob . of r e sp o n se
Aca demic Involvement Level
Item 1.Frequency tha t students supported opinions with logical a rgument
1 2 3 0.0 0.2 0.4 0.6 0.8 1.0 -3 -2 -1 0 1 2 3 P rob . of r e sp o n se
Aca demic Involvement Level
Item 2.Frequency tha t students eva luated qua lity/relia bility of information
1 2 3 0.0 0.2 0.4 0.6 0.8 1.0 -3 -2 -1 0 1 2 3 P rob . of r e sp o n se
Aca demic Involvement Level
Item 3.Frequency tha t students sought a lternative solutions to a problem
1 2 3 0.0 0.2 0.4 0.6 0.8 1.0 -3 -2 -1 0 1 2 3 P ro b . o f re sp o n se
Aca demic Involvement Level
Item 4.Frequency tha t students looked up scientific research a rticles a nd resources
1 2 3 0.0 0.2 0.4 0.6 0.8 1.0 -3 -2 -1 0 1 2 3 P ro b . o f re sp o n se
Aca demic Involvement Level
Item 5.Frequency that students explored topics on own when not required
1 2 3 0.0 0.2 0.4 0.6 0.8 1.0 -3 -2 -1 0 1 2 3 P ro b . o f re sp o n se
Aca demic Involvement Level
Item 6.Frequency tha t students sought feedback on your aca demic work
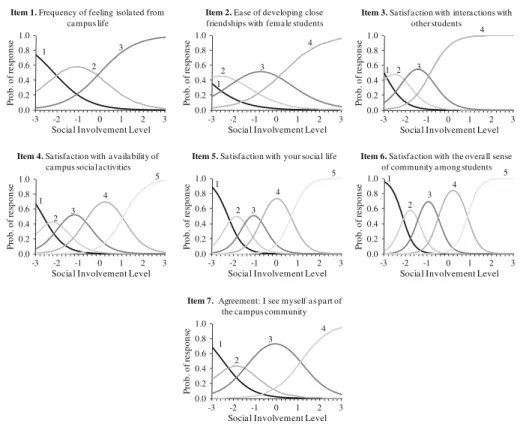
Fig. 2 Item characteristic curves for the items comprising the academic involvement scale
0 2 4 6 8 10 12 -3 -2 -1 0 1 2 3
Social Involvement Level a Information 0 0.2 0.4 0.6 0.8 1 SEM Information SEM 0 1 2 3 4 5 6 -3 -2 -1 0 1 3
Academic Involvement Level
Information 0 0.2 0.4 0.6 0.8 1 SEM Information SEM b 2
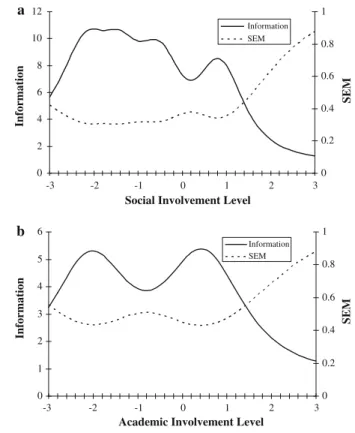
Fig. 3 scale information functions (SIF) and standard errors of measurement (SEM) for
social (a) and academic
above-average levels of social and academic involvement affects the amount of infor-mation that each item, and hence the total scale, can provide about students with involvement levels farther above average. As discussed above, this is due to the fact that all of the ‘‘farther above average’’ students are predicted to respond to each item in the exact same way—in the highest category—and can therefore not be distinguished from one another. Another notable point about the curves is that many of the academic involvement CRCs look very similar to one another, especially in terms of the values ofhat which the curves intersect. One could almost say that several of the graphs appear to be inter-changeable with one another, visually demonstrating that the items these curves represent have predicted response patterns that are virtually identical to one another. A student answering one of these questions in any given category is likely to answer another of the questions in the identical category.
Figure3a provides the SIF for the overall social involvement scale as well as its associated standard error of measurement (SEM). (Note, IRT ‘‘information’’ is a function of involvement, the magnitude of the scale items’ai’s and the spread and value of their
bi,k-1’s; SEM is calculated as one over the square root of the scale information
func-tion’s value at each level of involvement.) As expected, the social involvement SIF takes a sharp dip after involvement&1. Consequently, standard error rises sharply at the same point. These two patterns confirm the conclusions made previously about the social involvement scale based on its ai’s,bi,k-1’s and CRCs. Namely, the dip in information
and the corresponding rise in standard error again demonstrates that the social involvement scale can determine with precision the levels of social involvement of students who are low in involvement, but it cannot do the same for those who are high. However, for the range of involvement that the scale best measures, measurements are made with high precision. Indeed, for levels of social involvement up until&1, the SEM is relatively low (&0.40).
The academic involvement SIF (Fig.3b) is somewhat different than that of the social involvement scale, although like the social involvement SIF, information dips and the standard error rises sharply after involvement &1 (the reasons for this are the same as outlined above). What is unique about the academic involvement scale’s SIF is that the information function shows two distinct ‘‘peaks,’’ with the highest points occurring around theta &-2.0 and theta &0.40. The existence of such peaks is not surprising given the observations made above about the b parameters associated with the items in this scale. Because of the relatively restricted range and clustered nature of these bs, the scale is not equally effective at measuring academic involvement across the entire latent continuum. Rather, the scale makes its finest distinctions among stu-dents whose latent levels of academic involvement are in the neighborhood of the values at which most of the category response curves cross, that is, around h= -2.0 andh=0.40. An example makes it clear why this is the case. A student whose latent academic involvement level is 0.35 can be identified fairly accurately with the current scale’s items by a response of ‘‘frequently’’ to item 2, which has a b2,2 of 0.34, and a
response of ‘‘occasionally’’ to item 6, which has a b6,2 of 0.38. However, a student
whose latent academic involvement level is 0 cannot be as easily identified because he or she is likely to have a pattern of responses that is identical to the pattern shown for students whose involvement levels are between -1.46 (the highest of the bi,1
param-eters) and 0.07 (the lowest of thebi,2parameters). All of these students are predicted to
Discussion
In terms of evaluating specific items within the social and academic involvement scales, IRT and CTT provide similar information. For example, the IRT and CTT results agree on which items best measure social involvement—item 5 (satisfaction with your social life) and item 6 (satisfaction with the overall sense of community among students). The CTT statistics show that these two items would have the largest negative effect on Cronbach’s alpha were they to be deleted from the scale, and that they have by far the highest correct item-total correlations; the IRT statistics show that these same two items have the largest
a parameters. Similarly, IRT and CTT agree on which items best measure academic involvement—item 2 (frequency of evaluating the quality or reliability of information received) and item 3 (frequency of seeking alternative solutions to a problem). Again, these two academic involvement variables have the highest item-total correlation, the largest negative impact on alpha were they to be removed, and the highesta’s. On the whole, the agreement of IRT and CTT about which items are the best measures of involvement is not particularly surprising, as all of the statistics just cited are indicators of the relationship between a variable and the underlying trait, and they are calculated from the same data. One would hope that they would all show the same patterns.
Beyond the relative strengths and weaknesses of each item in terms of its fitness as an indicator of the latent construct, however, the IRT analysis also reveal something that is completely missed in the CTT analysis. Namely, IRT provides evidence that neither involvement scale measures all levels of involvement with equal precision. For example, the IRT results suggest that the social involvement scale, though it is very precise for students low in involvement, does not have as much measurement precision for students with high levels of social involvement. From a CTT perspective this conclusion does not make sense. In CTT the standard error of measurement is a function of the sample vari-ability and the relivari-ability of the scale (which is here computed as Cronbach’s alpha). The social involvement scale has a high alpha level (0.83), so CTT dictates that it should have a low SEM, and that the low SEM should apply to all students regardless of involvement level.
If one thinks of involvement from an IRT perspective, however, the lack of precision at the high end of the social involvement scale intuitively makes sense. If a student is high, or more than 1 or 1.5 standard deviations above the mean in social involvement, then he or she is likely very well integrated into the campus environment and likely has many ties to others on campus. Therefore, he or she is likely to answer every social involvement scale question in the highest, or perhaps the second highest, category—how could it be other-wise? Thus, in terms of response patterns we would expect, and indeed we observe, that a large proportion of students who are (presumably) well integrated in the social life of their campus provide the same or very similar patterns of responses to the scale’s questions. This is a problem in terms of precision at the high end of the social involvement scale because the similar high-end response patterns provide no way to meaningfully distinguish between students who are very high in social involvement and those who are only moderately high in social involvement. The practical result of such low precision will be little to no variation in scores at the high end of the scale, which may cause problems for inferential analyses. For example, researchers may run the risk of underestimating the strength of the relationship between the social involvement scale and another survey item/scale, or of finding no relationship when a relationship is indeed present.
The results of the IRT and CTT analyses thus have different implications in terms of the social involvement scale’s measurement precision and its utility for research. The CTT
analyses suggest, first of all, that the scale is fine as it is—it has a high alpha, which is what most affects SEM. If a researcher wanted to improve alpha and thus reduce the CTT estimate of SEM, then the most logical way to do so would be to add items to the scale that are very similar to the items already in the scale. These new items would correlate highly with the existing items and the overall alpha of the new set of items would thus be increased. However the new scale, with its now overlapping items, would not actually provide more information, content-wise, nor more precision—it would just provide redundant information.
The IRT analyses, on the other hand, suggest something entirely different. The analyses show that the social involvement scale is doing a good job of measuring low levels of social involvement, so for some purposes (such as identifying students who have low levels of involvement) the scale is operating sufficiently. However, if what is desired is mea-surement precision across the entire social involvement continuum, additional questions that tap specifically into high levels of involvement need to be added to the scale. That is, the IRT analyses suggest that to improve overall precision, which only needs to be done for the high end of the scale, a question or two should be added to the scale that asks about something that only students who have the highest levels of social involvement are likely to do, or to feel. This is a more theoretically interesting and compelling method of improving the scale than is the avenue suggested by CTT. For those working with sec-ondary data, the process of scale improvement would require a re-examination of the variables available on the survey instrument they are using, with the specific purpose of identifying items that might tap into the high end of social involvement. For those working at the survey-development level, the process would require a thoughtful consideration of what it meansto be highly involved, and the writing of survey questions designed spe-cifically to identify those students who are very highly involved. The addition of such items would not only increase the social involvement scale’s measurement precision where it is most needed, but would also increase the amount of unique content information that is collected about how students are involved on campus. Further, writing items that specif-ically fit the need of tapping into high levels of social involvement might also advance theory-building in this area.
In terms of the academic involvement scale, IRT and CTT again provide different views of measurement precision. The CTT statistics demonstrate that the items are highly in-tercorrelated and have a reasonably high overall Cronbach’s Alpha (0.76), and therefore, the scale comprised of the items is relatively precise. IRT demonstrates, on the other hand, that like the social involvement scale the academic involvement scale has low precision for involvement levels above approximately 1.0, meaning that the scale cannot differentiate among students at the higher end of the academic involvement continuum. Further, unlike the social involvement scale, the academic involvement scale does not have uniformly high precision across the lower ends of the trait range. Rather, the amount of measurement precision offered by the scale fluctuates based on where students fall on the continuum— certain levels of academic involvement, specifically those around-2.0 and 0.40, are more accurately measured than are others.
To improve precision of the academic involvement scale under a CTT framework, one needs only to follow the suggestion made earlier: add to the scale additional academic involvement items that are very similar to existing items and that will thus correlate highly with the existing items. Indeed, if all of the ten original academic involvement items are included in the scale its Cronbach’s alpha increases from 0.76 to 0.83 and its CTT estimate of SEM necessarily decreases. However, such an approach would not work in IRT because