Surface phonons of the Si
„
111
…
: In-
„
4
Ã
1
…
and
„
8
Ã
2
…
phases
K. Fleischer,1,2S. Chandola,1,2N. Esser,3W. Richter,2,4and J. F. McGilp1 1School of Physics, Trinity College Dublin, Dublin 2, Ireland
2Institut für Festkörperphysik, Technische Universität Berlin, Hardenbergstrasse 36, D-10623 Berlin, Germany 3Department Berlin, Institute for Analytical Sciences (ISAS), Albert-Einstein Strasse 9, 12489 Berlin, Germany
4INFM, Universitá di Roma Tor Vergata, Via della Ricerca Scientifica 1, I-00133 Roma, Italy
共Received 12 March 2007; revised manuscript received 16 August 2007; published 7 November 2007兲 The reversible phase transition of the Si共111兲: In-共4⫻1兲surface has been studied using Raman spectroscopy and the symmetry, frequencies, and linewidths of the surface phonon modes have been determined. Dramati-cally different behavior has been identified for vibrational motion in the direction of the In chains and orthogo-nal to them. The differences in the Raman spectra of the room and low temperature surface are discussed in terms of the Peierls transition model and a recent dynamical soft shear distortion model. The measurements are found to be consistent with the former model, while some difficulties arise for the latter model. A combined Peierls transition and soft shear distortion model is consistent with the data, but is lacking detail. The Raman spectra presented here represent a challenge in developing theoretical models of this complex system.
DOI:10.1103/PhysRevB.76.205406 PACS number共s兲: 73.20.Mf, 73.63.Nm, 78.30.⫺j, 78.67.Lt
I. INTRODUCTION
In recent years, the physical realization of quasi-one-dimensional 共quasi-1D兲 systems on surfaces has stimulated investigations on the nature of 1D metallic states, as unusual properties such as spin charge separation or charge density waves are expected.1–3 One interesting system is the
Si共111兲: In-共4⫻1兲 surface, which is known to be a 1D con-ductor at room temperature but changes to a nonconducting phase at low temperatures.4,5 In the accepted model of the
Si共111兲: In-共4⫻1兲 surface, two zigzag rows of In atoms form quasi-1D chains, separated by a zigzag row of Si atoms
共see Fig.1兲.6The reversible phase transition of this quasi-1D
system into an 共8⫻2兲 geometry at temperatures below 120 K has attracted considerable interest in recent years.4,6–18 The nature of the transition is still not fully
un-derstood and several models are currently under discussion: a single or triple band Peierls transition,4,10,13,14,17 an
order-disorder phase transition where the room temperature 共RT兲
共4⫻1兲phase is explained by a thermal mixture of different
共4⫻2兲sub-unit-cells,11 a displacive phase transition involv-ing entirely different structures,8 and, most recently, an
order-disorder phase transition involving a soft shear distor-tion between asymmetric ground states, where the RT 共4
⫻1兲 symmetry is explained as a time average of the whole surface.15Although initially the theoretical low temperature
共LT兲model did not identify the semiconducting nature of the
共8⫻2兲phase—in contrast to the models for the 1D metallic
共4⫻1兲phase—recently published new models appear to de-scribe the band structure of the共8⫻2兲phase quite well.13–15
However, there is still considerable dispute about the physi-cal description of the room temperature phase either as a fluctuating average of LT unit cells or as a thermodynamic stable phase15,16,19,20
The prediction of soft phonon modes by Gonzálezet al.15
and the availability of density functional theory calculations of the surface phonon modes of the 共4⫻1兲 phase21 have
stimulated the more detailed Raman spectroscopy studies of the surface phonon modes of both phases reported in this
paper, where particular attention is paid to the symmetry of the modes and the low energy In-In vibrations crucial for the understanding of the surface phase transition. The changes in the Raman spectra upon cooling are described and, after the usual temperature related shift of phonon modes is iden-tified, the changes arising from the phase transition are dis-cussed in terms of the different models. The observed surface phonon modes for both phases are listed, together with their symmetry.
II. EXPERIMENT
The measurements were performed in a UHV system of base pressure 8⫻10−11mbar, equipped with a liquid helium cooling stage with integrated direct current heating and a standard Knudsen cell for In evaporation. The vicinal Si共111兲 samples, with an offcut of 1° toward the 关¯11¯2兴, were heat treated at 1100 ° C following the method described by Vier-nowet al.22
The formation of the single domain 共4⫻1兲 surface was monitoredin situwith reflection anisotropy spectroscopy and confirmed with low energy electron diffraction, as described elsewhere.12,23Modifications to the chamber共preparation
[image:1.612.333.539.576.683.2]rectly on the cooling stage兲avoided the problem of the sup-pression of the phase transition by contamination12,24 and
also allowed the sample reorientation necessary to determine the symmetry of the surface phonon modes using Raman selection rules. The chain direction共关¯110兴兲 is defined as x, the perpendicular direction关¯1¯12兴as y, and the surface nor-mal as z 共see also Fig. 1兲. Following the Porto notation
关ki共ei,es兲ks兴, measurements were performed in z共y,y兲¯z and z共x,y兲¯, probing thez A
⬘
and A⬙
symmetries respectively.25These two fundamental symmetries arise from the 1m 共Cs兲 symmetry of the共4⫻1兲and共8⫻2兲 surfaces, showing only one mirror plane, perpendicular to the In chains共yzplane in our notation兲. In such a system, only two classes of symme-try allowed vibrational modes exist, those within the mirror plane共A
⬘
兲 and those perpendicular to it共A⬙
兲.The Raman spectrometer consists of a DILOR-XY triple-grating monochromator with a slit width of 150m operat-ing in subtractive mode for efficient reduction of the elasti-cally scattered background, together with a LN2 cooled charge coupled device共CCD兲Array共Spectrum-1, F36, CCD 1024⫻256-0兲. Spectra shown in the first sections were taken with a Kr+ ion laser operated at 647 nm 共1.91 eV兲 and 90 mW, using a 250m spot size. The resolution in this configuration is about 1.5 cm−1. For the resonance measure-ments, lines from both the Kr+ laser and an Ar+ laser were used. In order to minimize the elastically scattered back-ground, it was necessary to select sample areas with few macroscopic defects: a camera at the entrance slit of the monochromator allowed this to be monitored. Modes with phonon energies as low as 20 cm−1 were identified under these conditions. In contrast to earlier measurements on the surface phonons with high resolution electron-energy-loss spectroscopy共HREELS兲,9 this enables the low energy In-In
and In-Si vibrations to be probed directly.
III. RESULTS
A. Two phases and the phase transition
The Raman spectra of the共4⫻1兲 and共8⫻2兲 phases for different polarization geometries are shown in Fig.2, while Fig. 3 shows the development of the spectra taken during cooling at 1 K / min. A large number of surface modes are found for this particular surface共see full list in Sec. III B兲. It is generally agreed that the共4⫻1兲phase has a unit cell com-prising four In and two Si in the first and eight Si atoms in the second double layer共see Fig.1兲. Making the simplifying assumption that the underlying Si atoms show bulklike behavior,21 the six atoms in the first double layer give 12
modes ofA
⬘
and 6 ofA⬙
symmetry. The Raman effect probes phonons around the⌫point of the Brillouin Zone, and two of these modes共within an essentially two dimensional transla-tional symmetry兲 are expected to be acousticlike and not observable. It should be noted, however, that bulklike layers have been shown previously to contribute significantly to the surface vibrational modes关see, for instance, Sb on InP共Refs.25and26兲兴. The degree of confinement to the surface may vary for the different eigenmodes and thus the description of
surface eigenmodes in terms of the top layer of atoms of Fig.
1may be a significant approximation.
Nine modes are easily identified in measurements probing A
⬘
symmetry, together with two weaker modes assigned to a two phonon process共see Fig.2兲. Some of these modes are asymmetrically broadened, indicating modes that are not re-solved. In contrast to the rich A⬘
structure, only one broad mode withA⬙
symmetry is seen for the RT phase.The phase transition was monitored by slowly cooling the samples at 1 K / min and recording the spectra with a short integration time of 4 min. In Fig.3, the spectra for 250 and 60 K are shown directly for comparison, while all the others are shown as a gray scale, using white for the highest inten-sity. Cooling is expected to produce a small blueshift of the phonon modes, accompanied by an increase in intensity. This is most clearly seen for the mode at 428 cm−1, which shifts to 435 cm−1. The intensity of this mode initially increases with cooling but, below the phase transition at 120 K共Fig.
[image:2.612.319.558.59.336.2]3兲, it decreases again. This reduction in spectral weight is consistent with a splitting of the mode arising from the back-folding that accompanies the doubling of the real space unit cell. For weakly dispersing modes, formation of the LT phase will produce new modes in the vicinity of the original modes. Strongly dispersing modes will produce new modes at positions far from those of the RT phase共e.g., 266 cm−1兲.
FIG. 2. Raman spectra of the共4⫻1兲and共8⫻2兲phases taken in
A⬘ andA⬙symmetries, using an incident laser energy of 1.91 eV. The positions of the Raman modes are marked by dotted lines共see also TableI兲. New共8⫻2兲 modes, assigned to backfolding of the phonon branches, are indicated by gray lines, while blueshifting of modes on cooling is marked by black arrows. The spectral range from 240 to 370 cm−1is omitted as it is dominated by the bulk Si
The共8⫻2兲unit cell should produce many more observ-able modes, if there is significant electronic interchain inter-action. However, if the dominant Raman modes are localized within the chains, measurable differences in the phonon en-ergies above 20 cm−1 between the 共8⫻2兲 and the smaller
共4⫻2兲 unit cell would not be expected. As no phonon cal-culations of mode energies and their displacement vectors exist for the low temperature共8⫻2兲structure, detailed dis-cussion will be limited to the simpler共4⫻2兲 unit cell.
The 4⫻2 sub-unit-cell 关Fig.1共b兲兴 has 24 A
⬘
and 12 A⬙
modes, including two nonobservable, acousticlike modes. Figure2shows that many of these modes are resolved共17A⬘
and 8A⬙
modes兲. Some smaller structures seen in the spectra for 1.91 eV incident energy could not be confirmed with other laser lines, due to poorer resolution, and are omitted from the list in TablesIandII.B. Surface modes
As the intensity of the surface phonons is weak, care is required in assigning measured structures. Due to the large integration time needed, systematic errors, such as weak plasma lines or artificial lines created by excitations due to cosmic background radiation, may produce artifacts. Such problems can be minimized by comparing measurements taken at different incident laser energies 共see Fig. 4兲. An individual measured peak was only assigned to a surface phonon mode if it was identified for all measured laser en-ergies, as this procedure eliminates plasma lines.
Table I lists the identified modes of the 共4⫻1兲 surface. For the共8⫻2兲 surface, the increased number of modes is a
further complication. TableIIlists the identified modes using the same procedure as for the共4⫻1兲surface. In both tables, modes are indicated where the measurements at lower inci-dent laser energy共1.91 and 1.83 eV兲, and thus better resolu-tion, suggest that more than one mode contributes to the measured peak.
The data of Fig.4were fitted using a multipeak analysis of Voigt profiles resulting from a convolution of Gaussian and Lorentzian curves. The Gaussian broadening, attributed to the instrumental resolution, was determined by measuring a plasma line of the ion laser for each incident laser energy and was kept constant for all modes共2wG: 1.9, 2.2, 3.6, 3.8, 4.8 cm−1for incident laser energies of 1.83, 1.91, 2.18, 2.41, 2.54 eV, respectively兲. In TablesIandII, only the Lorentzian width of the phonon lines is given. The elastically scattered background from the incident laser beam was approximated by an exponential decay. The errors in the energy were esti-mated from the confidence interval of the fits, together with the standard deviation of the position derived from the indi-vidual fits at different laser energies. The latter is necessary as variations in focusing conditions and coupling into the monochromator, which cannot be avoided when using a macro-Raman system attached to a UHV chamber, can lead to shifts in the energy axis共the errors are larger than those of a dedicated micro-Raman spectrometer兲.
IV. DISCUSSION
A. Assignment of modes
Allowing for the blueshift on cooling, comparison of TablesIandIIshows that most modes of the 共4⫻1兲 struc-0
1 2 3
0 100 200 300 400 500
50
100
150
200
250
(4x1) (8x2)
Tem
perat
ure
(K
)
(4x1)
0 100 200 300 400 500
0 1 2
250K
Raman shift (cm-1)
300K
0
In
te
ns
ity
(
)
ct
s
m
W
*m
in
In
te
ns
ity
(
)
ct
s
m
W
*m
in
30K
(8x2)
60K
λi=647 nm, Pi=90 mW, z(y,y)z
[image:3.612.54.296.58.287.2]0
FIG. 3. 共Color online兲 Raman spectra of the 共4⫻1兲 共bottom兲 and共8⫻2兲phases共top兲. The integration time for the high quality measurements was 20 min. The spectra taken during cooling at −1 K / min used a 4 min integration time to enable the phase tran-sition to be monitored共examples are shown at 250 and 60 K, with the overall intensity expressed as a gray scale兲.
TABLE I. List of the identified surface phonon modes of the Si共111兲-In:共4⫻1兲surface. The fitting procedure is described in the text. The FWHM of the modes, 2wL, is the Lorentzian width. Some
modes have unusually large FWHMs and large errors in the fre-quency determination. More than one mode may be contributing, but no definite assignment is possible as these modes are either weak 共148 cm−1兲 or only shoulders on stronger modes 共36,
72 cm−1兲.
Symmetry
0
共cm−1兲
2wL
共cm−1兲 Comments
A
⬙
28± 0.9 10± 2A
⬘
31± 1 6 ± 4 1.91 and 1.83 eV only36± 2 14± 10 Possibly two modes
51.8± 0.6 3 ± 1
61± 1.3 5 ± 2
72± 3.3 11± 9 Possibly two modes
105± 1 8 ± 3 Two phonon
process
118± 1 9 ± 2
148± 7 16± 12 Possibly two modes
428± 1 14± 4 Resonant to 2TA共W兲
467± 1.5 7 ± 7 1.91 and 1.83 eV only
487± 2.6 10± 2 1.91 and 1.83 eV only
[image:3.612.313.560.149.370.2]ture also appear in the共8⫻2兲spectra. Only two modes occur exclusively on the共4⫻1兲surface共105, 118 cm−1兲, and these assigned to two phonon structures of the 51.8± 0.6 and 61± 1.3 cm−1 modes. Such a two phonon scattering process is more likely at higher temperature due to the higher occu-pation number of the phonon modes. At LT, such modes will become weaker, as can be seen in Fig.3for the peak in the Si 2TA structure at 300 cm−1 关2TA共X兲兴. Resonance studies, and the determination of the symmetry of the strong 共4
⫻1兲 mode at 428 cm−1 关435 cm−1 for the 共8⫻2兲 surface兴, suggest a new assignment of this mode, which was assigned previously to a microscopic vibration of the Si zigzag chain.12Resonance studies reveal that the width and intensity
of this mode and the Si bulk 2TA structure are correlated. Even high resolution measurements using the additive mode of the triple-grating monochromator do not significantly
change the line shape. The width of this structure remains large, particularly at incident laser energies above 2 eV, compared with the linewidth of the low energy modes or the Si bulk⌫25 mode 共see TableI兲. It is therefore likely that a surface resonance is enhancing the 2TA共W兲 bulk structure located around 430 cm−1,27 and that this is dominating the
response.
The rest of the modes are assigned to surface vibrations. TableI lists 8 A
⬘
modes but only a single A⬙
mode for the共4⫻1兲structure, while TableIIlists 15 A
⬘
modes and 8A⬙
modes for the 共8⫻2兲 structure. Individual phonon modes have been calculated for the 共4⫻1兲 structure,21 but directassignment is difficult because the calculations include the underlying Si layers, leading to a very large number of modes. However, some general conclusions can be drawn. The calculation shows that all low energy modes 共
⬍70 cm−1兲 are dominated by In-In vibrations, while modes above 250 cm−1are dominated by Si-Si vibrations. The In-In modes are of major interest, as the phase transition is accom-panied by a change in the In-In interatomic distances.8Table
I lists five A
⬘
In-In vibration modes perpendicular to the chains, but only one broad A⬙
In-In mode associated with vibrations along the chain direction. No A⬙
modes are ob-served above 70 cm−1. For the larger unit cell of the 共8 ⫻2兲surface, more modes are observed, most above 70 cm−1 at energetic positions consistent with backfolding of weakly dispersing phonon branches and/or small changes in In-In interatomic distances. The rather weak A⬘
共4⫻1兲 mode at 36± 2 cm−1 splits into two strong modes at 28± 1.3 and 41± 2 cm−1, giving one additional A⬘
mode below 70 cm−1共TableII兲. In the chain direction, the changes are much more dramatic, with four A
⬙
modes below 70 cm−1 replacing the single RT mode. The Raman spectra provide direct evidence that In-In vibrations with displacement patterns parallel to the chains change substantially between the two phases, while those with displacements perpendicular to the chains are much less affected.B. Models for the phase transition
In the absence of supporting calculations, the experimen-tal results on the surface vibrational modes can only exclude one of the phase transition models,11 but reveal some
diffi-culties with a recent dynamical fluctuation model.15,20
Peierls transition model.4,10,13,17,28 Comparison of the 共4 ⫻1兲and共8⫻2兲Raman spectra reveals that all major modes of the共4⫻1兲surface are found in the共8⫻2兲spectra, though blueshifted and with increased intensity due to the lower temperature. In addition, many new modes are found in the
共8⫻2兲spectra, most at energetic positions consistent with a backfolding of weakly dispersing phonon branches when the surface unit cell is doubled in a Peierls-distorted phase. Evi-dence of a dynamical charge density wave共CDW兲, consis-tent with a Peierls instability, has been obtained directly from scanning tunneling microscopy measurements of the LT phase.28
Individual chains are known to undergo the phase transi-tion over a range of temperatures due to defects within the chain and also because of temperature gradients.4,28The
Ra-TABLE II. List of the identified surface phonon modes of the Si共111兲-In:共8⫻2兲surface. The spectra with the highest resolution and signal-to-noise ratio 共1.91 eV兲 indicate that more than one structure may be contributing for several of the modes. The larger errors, compared to the RT measurements, in energy and Lorentzian linewidth 2wL, are a consequence of the large number of peaks
fitted.
Symmetry
0
共cm−1兲
2wL
共cm−1兲 Comments
A⬙ 23.5± 0.8 4 ± 1.5 Possibly two modes
42± 3.5 8 ± 5 Possibly three modes
59± 3 8 ± 6 Possibly two modes
69± 1.5 4 ± 1.5
85± 1.7 8 ± 4
184± 0.7 7 ± 3
262± 2 12± 7
458± 1.2 3 ± 1.5
A⬘ 21± 1.6 4 ± 3
28± 1.3 4 ± 2
41± 2 4 ± 2
57.2± 0.7 5 ± 2
62± 1.5 3 ± 4
69± 1.1 5 ± 4
83± 2.3 7 ± 6 Possibly two modes
100-130 Broad structure
139± 1.2 11± 6 Possibly two modes
154± 2 7 ± 6 Possibly two modes
185± 2 12± 8 Possibly two modes
255± 4 7 ± 6
264± 3 7 ± 4 Also in HREELSa
412± 2.5 10± 8
435.1± 0.7 22± 10 Resonant to 2TA共W兲
473± 2 4 ± 4 Also in HREELSa
495± 5 18± 14 Also in HREELSa
⌫25⬘ 523.6± 0.8 0.9± 0.2 Si bulk
man spectra in the temperature range from 120 to 90 K共Fig.
5兲 appear to be a simple linear combination of the 共8⫻2兲 and共4⫻1兲 spectra, in agreement with this model.
Finally, the observed sensitivity of the surface to very small amounts of additional In 共Refs. 24 and 29兲 is also consistent with this model, as adsorbates prevent the forma-tion of nonlocal collective states such as the CDW. The ob-servation that the formation of the LT共8⫻2兲 phase is sup-pressed by the adsorption of⬍0.1 ML In is consistent with the Peierls model.12
Order-disorder transition models.11,15 An early
order-disorder transition model postulates that the RT structure is an average of spatially disordered, LT 共4⫻2兲 sub-unit-cells.11 Raman spectroscopy probes local
vibra-tional modes and thus would detect the presence of such sub-unit-cells. No evidence of the LT vibrational signature is found at RT, allowing this model to be excluded.
A more recent order-disorder model invokes a soft pho-non mode, associated with a shear distortion, that moves the In atoms dynamically between asymmetrically distorted 共8
⫻2兲structures, with a finite occupation time in a symmetric
共4⫻1兲structure at RT. At LT, the system is frozen into one asymmetric distorted hexagonal structure.15,20 At RT, the model predicts that the spectral weight of the contributing asymmetric共8⫻2兲structures is still comparable to the sym-metric 共4⫻1兲 structure.19,20 Consequences for the Raman
spectra would be, first, that the共8⫻2兲structure should have distinctively different vibrational spectra from the symmetric
共4⫻1兲structure. Second, the signatures of the LT structures should be found in the RT spectra. Third, as the RT phase is formed, the order-disorder transition should produce broad-ening of Raman lines, which is well documented in other systems.30,31 Fourth, soft phonon modes should show
char-acteristic shifts in energy around the transition temperature, although this is not a unique feature of an order-disorder transition, as similar soft modes have been found in Peierls systems.32–35
[image:5.612.93.514.60.465.2]The Raman data show more peaks in the LT spectrum than in the RT spectrum, clearly ruling out a spectral signa-ture of the LT strucsigna-ture at RT共contradicting point 2, but in
agreement with recent photoemission results16兲. The larger
number of peaks at LT is consistent with an asymmetric phase共point 1兲, but the data show a strong relation between the LT and RT structures, in that all the共4⫻1兲 lines appear in共8⫻2兲 spectra, although blueshifted and more intense, as discussed above. This might be explained by noting that all but one of these lines are of A
⬘
symmetry 共vibrations or-thogonal to the chain direction兲, and postulating that the ef-fect of the structural asymmetry will appear mainly in vibra-tions in the shear distortion direction, i.e., along the chains. This might also help to explain, within this model, the nar-row linewidths observed for some of the A⬘
modes at RT, which appear to contradict point 3: e.g., the strongest low energy phonon mode at 51.8± 0.6 cm−1 is of A⬘
symmetry and is very sharp at RT, with a full width at half maximum共FWHM兲of only 3 ± 1 cm−1. In contrast, measurement of the A
⬘
36 cm−1 mode using the best resolution from a single laser line gives a width of 12± 1 cm−1. At LT, this mode shifts to 41 cm−1 and narrows to 4 ± 2 cm−1, consistent with point 3. Changes in Raman linewidths at the phase transition could not be monitored, as the signal-to-noise ratio共SNR兲of the variable temperature measurements was too poor for re-liable peak analysis. Linewidth measurement is also compli-cated by unresolved side modes in some of the spectral lines共Table II兲. The insensitivity of particular A
⬘
modes to the phase change, while otherA⬘
modes are affected, is unusual, but such behavior is observed occasionally for order-disorder transitions in complex bulk materials.30The very different form of theA
⬘
andA⬙
spectra at RT is consistent with the dynamical fluctuation model. The dy-namical shear distortion along the chain direction would be expected to broaden and smear out the A⬙
modes and, in-deed, only one broadA⬙
mode is detected at RT共TableI兲.A⬘
modes, with motion in the orthogonal direction, would be less affected, and eight surface modes are observed. At LT, the configurations are frozen, revealing more modes of A⬙
symmetry共Table II兲. Freezing of soft phonon modes is ex-pected when the average thermal energy,kT, is reduced be-low the energy of the modes. The onset of the phase transi-tion at 120 K corresponds to⬃80 cm−1, close enough to the energy of a number of LT A
⬙
modes 共59, 69, 85 cm−1兲 to support the idea that the freezing in of vibrationalA⬙
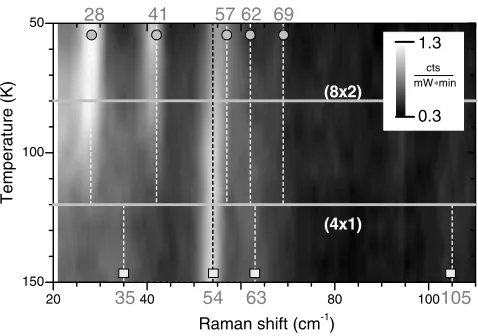
modes may be involved in the mechanism of the phase transition.Regarding soft phonon modes共point 4兲, their spectral sig-nature of a strong dispersion of mode energy with tempera-ture has been seen in a wide range of structural phase transitions.32 The low energy region of the A
⬘
symmetryspectrum in the temperature range between 150 and 50 K is shown in Fig. 5. The dotted lines mark the position of the phonon modes at 150 K for the共4⫻1兲phase and at 50 K for the 共8⫻2兲 phase. The spectrum in the temperature range from 120 to 80 K appears to be a simple linear combination of the two distinct Raman spectra. There is no evidence, above 20 cm−1, of the characteristic energy dispersion of a soft phonon mode. However, as discussed above, the main soft mode is predicted to be a shear mode of the two zigzag In chains in thexdirection,15and thus to be ofA
⬙
symmetry.Measurements of the A
⬙
modes require long integration times at 30 K and it is possible that one of them is the pre-dicted soft mode. The poor SNR inA⬙
geometry prevented temperature dependent, wide spectrum scans and current cal-culations provide no estimate of the soft mode energy. These energies can be very low, for example, only 30 cm−1for the soft mode spin-Peierls transition in CuGeO3.34 The absence of evidence of a soft mode is inconclusive in assessing the model. A more significant problem for this model is that it does not explain why adsorption of additional In or other metals of ⬍0.1 ML stabilizes the 共4⫻1兲 phase at low temperatures.12,24,29If the RT共4⫻1兲phase is predominantly a transient structure connecting the basic共8⫻2兲LT sub-unit-cells, whose spectral intensity is still significant at room tem-perature, contamination seems more likely to lead to a “fro-zen“ randomization of LT sub-unit-cells, instead of the 共4⫻1兲-like vibrational structure actually found.12
In summary, the Raman results exclude a significant con-tribution from the LT共8⫻2兲structure in the RT spectra, in agreement with recent photoemission results.16No direct evi-dence of a soft phonon mode was found, but the apparent softening of modes of A
⬙
symmetry, which are associated with vibrations along the chains, leading to only one mode being observable at RT, is consistent with the presence of soft shearing motions in the chain direction.Combination of Peierls transition and soft shear distor-tion. In a recent publication by Riikonenet al., the possibility was raised that both mechanisms contribute to the phase transition.18The calculated LT structure is in good agreement
with measured LT atomic positions8 and also the
semicon-ducting nature of the phase. If the CDW leads to a periodic lattice distortion, the total energy of the system will be low-ered, following Peierls’ argument. The calculated 共8⫻2兲 ground state with the asymmetrical shear distortion could be essentially identical to a lattice distortion consequent on CDW formation. The soft shear modes associated with vibra-tions in the chain direction then provide a mechanism for the transition to the RT metallic phase.
50
100
150
20 40 60 80 100
Raman shift (cm-1)
69 62 57 41 28
105 54
(4x1) (8x2)
Temperature
(K)
35 63
1.3
[image:6.612.54.293.57.225.2]0.3 cts mW∗min
V. CONCLUSIONS
In measuring the symmetry, frequencies, and linewidths of the surface phonon modes of both phases of the reversible transition of the Si共111兲: In-共4⫻1兲 surface, it has emerged that the symmetry of the modes is particularly important, with dramatically different behavior identified for vibrational motion in the direction of the chains and orthogonal to them. The data are generally consistent with a Peierls transition as the driving force for the reversible phase transition,4,10,13,17,28
but a detailed theoretical model is required. Recent theoreti-cal theoreti-calculations leading to an asymmetritheoreti-cal structure for the
共8⫻2兲and a dynamical fluctuation for the 共4⫻1兲structure suggest an explanation of some of the details of the Raman measurements.14,15 Specifically, soft shear distortions in the
chain direction predicted by this model may explain the single broad mode of A
⬙
symmetry observed at RT, whichcontrasts with the minimum of 8 sharpA
⬙
modes observed at LT. However, in agreement with recent photoemission results,16 the spectra do not show the substantial spectral weight of the 共8⫻2兲 subunits at RT predicted by the model.19,20 The results also allow an early order-disordertransition model to be excluded.11The Raman spectra
pre-sented here represent a challenge to current theoretical mod-els of this system.
ACKNOWLEDGMENTS
This paper has emanated from research conducted with the financial support of Science Foundation Ireland, the Irish Research Council for Science, Engineering and Technology, and SFB 290 of the Deutsche Forschungsgemeinschaft. Wolf Gero Schmidt and Friedhelm Bechstedt are thanked for fruit-ful discussions and sharing their data.
1F. J. Himpsel, K. N. Altmann, R. Bennewitz, J. N. Crain, A.
Kirakosian, J. L. Lin, and J. L. McChesney, J. Phys.: Condens. Matter 13, 11097共2001兲, and references therein.
2J. Voit, Rep. Prog. Phys. 57, 977共1994兲, and references therein. 3P. Segovia, D. Purdie, M. Hengsberger, and Y. Baer, Nature共
Lon-don兲 402, 504共1999兲.
4H. W. Yeom, S. Takeda, E. Rotenberg, I. Matsuda, K. Horikoshi,
J. Schaefer, C. M. Lee, S. D. Kevan, T. Ohta, T. Nagao, and S. Hasegawa, Phys. Rev. Lett. 82, 4898共1999兲.
5T. Kanagawa, R. Hobara, I. Matsuda, T. Tanikawa, A. Natori, and
S. Hasegawa, Phys. Rev. Lett. 91, 036805共2003兲.
6O. Bunk, G. Falkenberg, J. H. Zeysing, L. Lottermoser, R. L.
Johnson, M. Nielsen, F. Berg-Rasmussen, J. Baker, and R. Feidenhans’l, Phys. Rev. B 59, 12228共1999兲.
7S. Wang, W. Lu, W. G. Schmidt, and J. Bernholc, Phys. Rev. B
68, 035329共2003兲.
8C. Kumpf, O. Bunk, J. H. Zeysing, Y. Su, M. Nielsen, R. L.
Johnson, R. Feidenhans’l, and K. Bechgaard, Phys. Rev. Lett.
85, 4916共2000兲.
9K. Sakamoto, H. Ashima, H. W. Yeom, and W. Uchida, Phys.
Rev. B 62, 9923共2000兲.
10H. W. Yeom, K. Horikoshi, H. M. Zhang, K. Ono, and R. I. G.
Uhrberg, Phys. Rev. B 65, 241307共R兲 共2002兲.
11J.-H. Cho, D.-H. Oh, K. S. Kim, and L. Kleinman, Phys. Rev. B
64, 235302共2001兲.
12K. Fleischer, S. Chandola, N. Esser, W. Richter, and J. F. McGilp,
Phys. Rev. B 67, 235318共2003兲.
13S. F. Tsay, Phys. Rev. B 71, 035207共2005兲.
14C. González, J. Ortega, and F. Flores, New J. Phys. 7, 100
共2005兲.
15C. González, F. Flores, and J. Ortega, Phys. Rev. Lett.96, 136101
共2006兲.
16J. R. Ahn, J. H. Byun, J. K. Kim, and H. W. Yeom, Phys. Rev. B
75, 033313共2007兲.
17J. R. Ahn, J. H. Byun, H. Koh, E. Rotenberg, S. D. Kevan, and H.
W. Yeom, Phys. Rev. Lett. 93, 106401共2004兲.
18S. Riikonen, A. Ayuela, and D. Sanchez-Portal, Surf. Sci. 600,
3821共2006兲.
19H. W. Yeom, Phys. Rev. Lett. 97, 189701共2006兲.
20C. González, F. Flores, and J. Ortega, Phys. Rev. Lett.97, 189702
共2006兲.
21F. Bechstedt, A. Krivosheeva, J. Furthmüller, and A. A.
Stekolni-kov, Phys. Rev. B 68, 193406共2003兲.
22J. Viernow, J. L. Lin, D. Y. Petrovykh, F. M. Leibsle, F. K. Men,
and F. J. Himpsel, Appl. Phys. Lett. 72, 948共1998兲.
23F. Pedreschi, J. D. O’Mahony, P. Weightman, and J. R. Power,
Appl. Phys. Lett. 73, 2152共1998兲.
24S. V. Ryjkov, T. Nagao, V. G. Lifshits, and S. Hasegawa, Surf.
Sci. 488, 15共2001兲.
25Light Scattering in Solids VIII: Raman Scattering from Surface
Phonons, edited by M. Cardona and G. Güntherodt共 Springer-Verlag, Berlin, 2000兲.
26N. Esser, K. Hinrichs, J. R. Power, W. Richter, and J. Fritsch,
Phys. Rev. B 66, 075330共2002兲.
27B. A. Weinstein and G. J. Piermarini, Phys. Rev. B 12, 1172
共1975兲, and references therein.
28S. J. Park, H. W. Yeom, S. H. Min, D. H. Park, and I.-W. Lyo,
Phys. Rev. Lett. 93, 106402共2004兲.
29K. Fleischer, S. Chandola, N. Esser, and J. F. McGilp, Phys.
Status Solidi B 242, 2655共2005兲.
30R. Rao, T. Sakuntala, and S. Deb, J. Mol. Struct. 789, 195共2006兲. 31H.-G. Unruh, J. Raman Spectrosc. 17, 113共1986兲.
32J. F. Scott, Rev. Mod. Phys. 46, 83共1974兲. 33E. Mele, Surf. Sci. 278, 135共1992兲.
34H. Kuroe, T. Sekine, M. Hase, Y. Sasago, K. Uchinokura, H.
Kojima, I. Tanaka, and Y. Shibuya, Phys. Rev. B 50, 16468 共1994兲.
35A. Girlando, A. Painelli, S. Bewick, and Z. Soos, Synth. Met.