The economic component of the Sustainable Agriculture Farming Systems (SAFS) project at UC Davis compared the financial per- formance of low-input and organic farming systems to conventional systems. All of the systems have been profitable over the first 4 years of the project. However, nei- ther the organic nor lo w-input systems have been able to show equivalent profits to either of the conventional systems on a whole farm basis without organic price premiums.
Advocates of sustainable agriculture concur that sustainable farming sys- tems should reduce reliance on nonre- newable resources without compro- mising economic viability. Unfortu- nately, sustainable farming systems sometimes strive to reduce inputs without ample regard for expected productivity during the system-design phase. The economic viability of the system is analyzed at the end of the growing season, but is not adequately considered during the planning pro- cess. The resulting farming system has low-inputs and low costs, but may also obtain low yields, low income and, ultimately, low profit levels. This scenario has led many to believe that Organic and farming ’ys- tems cannot attain yields comparable to those from conventional systems and therefore cannot be profitable. Processing tomato yields and organic price premiums were the most important factors
determining relative whole-farm profit because tomatoes contributed over 55% of the cash value in each system.
The Sustainable Agriculture Farm- ing Systems (SAFS) project at UC
developing “best farmer” strategies for
farming systems. Expected financial
Alfernative systems aim to
Davis, begun in 1988, has focused onreduce inputs, main tain pro fits
organic, low-input and conventionalKaren Klonsky P Peter Livingston
ment includes four variations of a rep- resentative field crop rotation for the Sacramento Valley: a conventional 4-year rotation; a conventional 2-year rotation; a low-input system; and an organic system. The basic 4-year rota- tion, representative for this area, is processing tomatoes, safflower, corn and a double crop of a winter legume or grain with dry beans. The winter- crop time niche includes wheat for conventional 4-year and a legume and/or a grain for the low-input and orgakc systems. The 2-year conven- tional rotation includes only tomatoes and wheat (for details, see pp. 14-19).
The short-run economic viability of the alternative systems was compared by estimating the profitability of the alternative systems for the first com- pleted rotation of the project (crop years 1989-1992). The costs of produc- tion, cash value and resulting profits are reported in this paper, with an em- phasis on fertility management and weed management, as these were the production components that contrib- uted to the greatest variation in costs.
Calculating profit
The production costs, farm income and profit for each of the four alterna- tive cropping systems were calculated for the first completed 4-year rotation (the 1989-1992 growing seasons), us- ing the Budget Planner computer pro- gram developed by North Carolina State University and UC (table 1). The program simulated the economic per- formance of a representative 2,000- acre farm, following the actual farm- ing systems used in the field trials. This technique is commonly used to compare results of field trials using re- alistic, standardized costs of field op- erations. The income and profits for the organic system were calculated us- ing conventional market prices and also premium prices received for or- ganic commodities, resulting in five systems being reported.
Every crop in the rotation was grown each year of the experiment and included in each year of the simu- lation. For example, the conventional 4-year rotation included 500 acres each of wheat/beans double cropped, to- matoes, safflower and corn each year,
as opposed to 2,000 acres of tomatoes one year followed by 2,000 acres of safflower the next, and so on.
would be incurred by a farmer using the farming operations conducted in the field trials. The cost of each farm- ing operation is the sum of the materi- als, equipment and labor costs. The equipment costs are determined by multiplying the hourly cost of owning and operating equipment by the hours used to complete the operation. Own- ership costs consist of capital replace- ment, property taxes and insurance; operating costs include fuel, lubrica- tion and repairs.
The actual application rates of ma- terials such as seed and fertilizer in the test plots were used in the calcula- tions. The prices were obtained annu- ally from local suppliers and include the effects of inflation and market variations.
The actual equipment used for the '/+acre plots in the field trial was not the same equipment that would be used for a full-scale operation. Fur- thermore, it was important not to bias the results by using a smaller tractor in one system than in another to perform the same task. Therefore a standard- ized equipment complement was de-
The model calculated the costs that
veloped for each system that was ap- propriate for a 2,000-acre farm and the farming practices followed for that system. Repairs and fuel use were cal- culated using engineering equations developed by the American Society of Agricultural Engineers (ASAE) for performance of farm equipment.
Similarly, the actual time the equip- ment spent on the test plots cannot be used in the cost calculations because of the disproportionate amount of turn- ing and setup required in a field trial situation. To circumvent this problem, the time to complete each operation was derived using agricultural engi- neering equations (also developed by ASAE) based on the speed and width of the implements used in the opera- tion. The labor costs for each system were calculated based on this time es- timate and the prevailing labor rate for the area. The costs of the irrigation system and buildings were the same for each of the farming systems.
ment were unchanged for each of the 4 years. This means that differences in profit between systems are attribut- able to the crops grown, machinery re- quirements, production practices and market conditions, and are not attrib- utable to equipment purchases or
sales, or changes in the size of the op- eration. Year-to-year variations in profit only reflect changes in produc- tion practices, cultivar serections, weather conditions and market price fluctuations.
The farm was assumed to be man- aged by a full-time operator. The owner received the net income rather than a salary for management. The manager was paid the prevailing wage rate for performing field opera- tions. All land was assumed to be rented at a typical cash rent for the area.
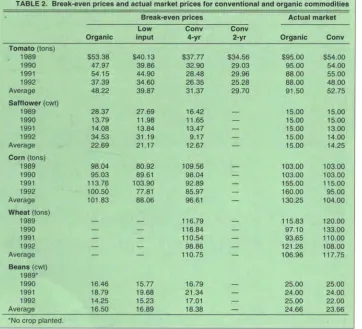
cal farm for each system were based on the yields from the field trials (see page 16, for yields) and the actual local harvest season prices (table 2, this page). This means that relative sys- tems performance is influenced in part by inflation and short-term price fluc- tuations related to industry-level sup- ply and demand. In order to accu- rately portray the financial situation for organic production, the farm rev- enue and profit were calculated in two
Annual revenues for the hypotheti-
ways: using the conventional prices and the organic premium prices.
Costs of production
The following discussion explains the differences in costs of production on a whole-farm and a crop-by-crop basis. Looking at each system in the context of a whole farm allows an ex- amination of each system’s perfor- mance as a complete unit. Cost analy- sis by each crop allows researchers to determine which components of the system and crop are enhancing the economic viability of the system and which are detracting from it.
Whole farm. The relative ranking of the systems by cost of production changed over the rotation as practices were adjusted to improve the perfor- mance of each system (fig. 1). Averaged over the 4 years, the costliest system was conventional 2-year ($708 per acre), fol- lowed by organic ($7021, low-input ($691) and conventional 4-year ($640).
accounted for significant differences in costs and resource use across sys-
Differences in fertility management
tems and between years (see table 3, next page, and table 1, page 21). The low-input and organic systems relied on a leguminous cover crop for nitro- gen, except in the first year, when time constraints did not allow for planting and chicken manure was used as the nitrogen source. Subsequently the pri- mary source of nitrogen for these sys- tems was a Lana vetch cover crop. The management of the cover crops varied from year to year (see table 1, page 21). Due to unusually low fall rainfall, the vetch was sprinkler-irrigated in 1990 and 1991, adding to the cost and en- ergy use.
more cultural operations than the ap- plication of synthetic fertilizer in the conventional systems. Among other things, this means that fuel and labor costs are greater for a cover crop than for synthetic fertilizer. Minimum till- age was used to incorporate the cover crops in 1991 to reduce the use of fos- sil fuels. Although costs and resource use were minimized, it resulted in a short supply of nitrogen. Therefore minimum tillage was not adopted as a standard practice.
Over the first rotation the average cost per acre for fertility was very close for the organic, low-input and conventional 4-year systems. The con- ventional 2-year system showed the lowest cost because it did not include corn, which is a high nitrogen user, in the rotation. It can be concluded that the nutrient needs of the specific crops included in the rotation play a bigger role in determining total costs than do the specific management practices. Further, the use of cover crops in con- junction with supplemental manure and other sources of nutrients does not appear to be significantly more expen- sive than conventional fertilizers when the crop rotations are the same.
[image:3.594.28.390.393.722.2]The use of a cover crop necessitates
Although the average fertility costs over the first 4 years were similar for each system, in any individual year the costs varied significantly (table 3).
Fertility costs for the low-input and or- ganic systems were lower than for the conventional 4-year system in 1989, when no cover crops were planted, and in 1991, when minimum tillage was used, while the costs were higher in 1990 and 1992. The fertility costs for the conventional systems trended downward, while the low-input and organic systems showed no general trend. The implication is that there continues to be a steep learning curve in the fertility management of the sys- tems relying on cover crops.
Weed management also had a criti- cal impact on costs that varied from year to year. The low-input and or- ganic systems utilized cultivation as the primary form of weed control, with extensive hand hoeing in the to- matoes. The judicious use of herbi- cides was sometimes called for in the low-input system. The conventional systems use preplant and layby herbi- cides in combination with cultivation. Hand hoeing was also used for toma- toes (seeatable 1, page 29).
The major difference in weed-con- trol costs arose from the amount of time spent hand hoeing tomatoes. All of the plots were hand hoed twice in 1989 and 1990 and three times in 1991 and 1992. However, due to the greater weed pressure, hoeing crews spent much more time in the low-input and organic systems than in the conven- tional ones. This meant that the low- input and organic systems substituted labor for herbicides and fossil fuels used for herbicide application. Not surprisingly, the highest-cost system every year except one was the conven- tional 2-year system, because of the high proportion of tomatoes in that
Judicious use of herbicldes in low-input corn cut costs and boosted yields.
system. The conventional 4-year sys- tem had the lowest average costs, pri- marily due to the higher hand-hoeing costs for tomatoes in the other sys- tems. However, it is important to note that the weed-control costs for all crops other than tomatoes were actu- ally lower for the low-input and or- ganic systems than for the conven- tional systems in all 4 years.
Pests other than weeds, such as in- sects and mites, did not play key roles in system performance. Irrigation costs were identical across systems.
Although the differences in average costs per acre have been discussed for the whole farm, it is important to look at the enterprises within the rotation to understand the vast number of fac- tors embedded in the average cost- per-acre values.
Tomatoes. The total costs for the low-input and organic systems were higher than for the conventional sys- tems in all years, primarily due to the
high hand-hoeing costs already dis- cussed. In addition, supplemental ni- trogen (ammonium nitrate) was ap- plied to the low-input tomatoes in 1991 and 1992 and to the organic to- matoes in 1992 (fish powder and kelp through the irrigation system and 1 1/2 tons of manure). Also, in 1992 the low-input and organic toma- toes were transplanted instead of di- rect seeded to allow for a longer grow- ing season for the preceding cover crop and to improve competition with weeds. The cost of transplanting was extremely high when compared to di- rect-seeded tomatoes: $308 per acre compared to around $115 per acre. An organic starter fertilizer was applied to the transplants while they were grow- ing in the greenhouse. This expense was combined into the total transplant cost, since the transplants were custom grown. As a result, yields in the low- input and organic systems were equivalent to the yields of conven- tional tomatoes for the first time.
Fertility management in the low-input and organic systems relied on cover crops and manure.
ma1 planting time for good stand es- tablishment of most cover crop spe- cies, while the early planting time for safflower necessitates incorporation of the cover crop before spring growth has allowed for significant develop- ment of biomass. For these reasons, manure was again used in these two systems in 1992.
Unfortunately, the 1992 low-input and organic safflower costs are not comparable either to the conventional safflower costs or to the previous years’ costs due to the poor stands, which were eventually disked under before harvest. An unsuccessful attempt was made to improve the low-input stand by sidedressing with nitrogen and re- planting one of the replications. Fi- nally the decision was made to replant to another crop, consistent with the concept of “best farmer practices;” in this case, beans were chosen. The cost of the lost safflower in the low-input and organic plots was added to the cost of the beans that followed. Of the total operating costs for the low-input system, 40% can be attributed to grow- ing the safflower, 10% to trying to save the stand, and roughly 50% to produc- ing the beans.
The decision to terminate the saf- flower crop and replant with beans was a good one. Both the low-input and the organic safflower and beans with price premiums, covered all of their cash costs and some of their noncash overhead. Organic safflower replanted to beans could not recoup all of the cash costs without premium prices, but covered the failed crop’s loss.
Corn. Averaged over the 4 years, the low-input and organic systems cost less to grow than the conventional 4-year. Total operating costs per acre proved to be higher in the conven- tional systems than in either the low- input or the organic system in 1989, when no cover crop was grown, and in 1991 because of the low cost of mini- mum tillage used to plant the corn into the vetch cover-crop residue. The con- ventional systems’ costs were lower in 1990 and 1992, when fertility costs were higher in the organic and low-in- put systems.
Winter crops. This temporal niche is the only one in the rotations that is filled with different crops for the dif- ferent systems. Wheat was grown in the conventional systems each year. Lupin was grown in the low-input and
organic systems for the first 2 years and was replaced by an oats-vetch mix in the subsequent years. Both crops are relatively low cost compared to the other crops in the rotation. Conse- quently the cost of the low-input and organic systems was roughly half the cost of growing conventional wheat in 1990 through 1992.
Beans. Beans were not grown in the first year of the rotation because of timing constraints. Unlike the other crops in the rotations, the cultural practices for beans were nearly identi- cal across all systems. As would be ex- pected, operating costs in the three systems were fairly close. The major difference in cultural practices was the weed-control programs. In 1990 and 1991 there were more cultivations in the organic and low-input plots than in the conventional plots, undoubtedly due to the use of preplant herbicides in the conventional systems. All sys- tems required more cultivations in 1992 than in the previous years. Over- all, the conventional systems consis- tently had the highest cost due to the use of herbicides, while the low-input and organic systems substituted lower-cost fossil fuels for herbicides in the cultivations. There were no fertil- izer applications except for a nitrogen sidedress to the conventional treat- ment in 1992.
Cash value
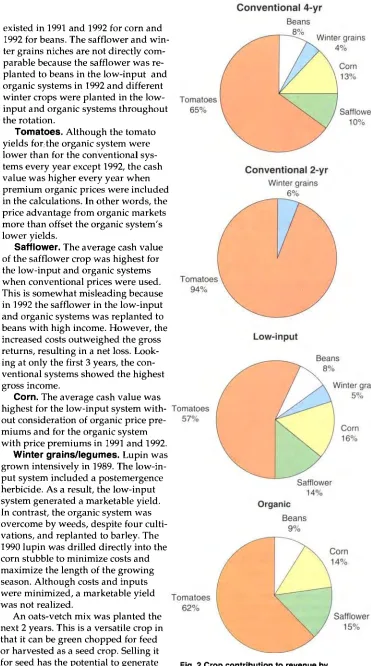
Cash value is the proceeds (gross income) received by the grower from the sale of the farm’s crops before any costs are deducted. Tomatoes contrib- uted over 55% of the cash value in each system (fig. 2). Not surprisingly, the Sustainable Agriculture Farming Sys- tems project has devoted a great deal of effort to improving the performance of the tomato crop in each system.
processors. Therefore the price is ex- tremely sensitive to small changes in supply. The price of organic tomatoes, although substantially higher than the price of conventional tomatoes, has declined over the period of this study (table 2). Other markets, such as beans, are just forming and are not well de- veloped. Furthermore, substantial adoption of alternative practices could increase production to the point that the prjce premium would decrease if consumer demand did not increase at a comparable rate.
Farm income is always susceptible to fluctuations in the marketplace and to exogenous shocks. Farm revenue was calculated two ways -with con- ventional prices and with organic price premiums - in order to deter- mine the importance of the organic markets to the viability of the organic system.
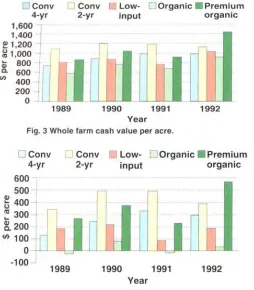
prices, the cash value for the whole farm was highest on average for the conventional 2-year rotation (table 1). This is not surprising, since tomatoes generate three to five times as much revenue per acre as any of the other crops in the rotations, and half of the acreage in the 2-year system was de- voted to tomatoes, while only a quar- ter of the acreage in the other systems was in tomatoes. However, in 1992, when the organic tomato yield was equivalent to the conventional sys- tems’ yields and when price premiums were included for tomatoes, corn and beans, the organic system showed the highest gross returns per acre ($1,445 per acre for the organic system com- pared to $1,102 per acre for conven- tional 2-year) (fig. 3 ) . The gross returns from the organic system with price premiums was higher on average than from the conventional 4-year system in every year except 1991, when to- mato yields were low in the organic system.
The low-input beans and corn showed the highest average gross in- come when conventional prices were used. The organic corn and beans real- ized the highest gross returns when organic price premiums were in- cluded, even though the markets only
Whole farm. Using all conventional
existed in 1991 and 1992 for corn and 1992 for beans. The safflower and win- ter grains niches are not directly com- parable because the safflower was re- planted to beans in the low-input and organic systems in 1992 and different winter crops were planted in the low- input and organic systems throughout the rotation.
Tomatoes. Although the tomato yields for, the organic system were lower than for the conventional sys- tems every year except 1992, the cash value was higher every year when premium organic prices were included in the calculations. In other words, the price advantage from organic markets more than offset the organic system’s lower yields.
Safflower. The average cash value of the safflower crop was highest for the low-input and organic systems when conventional prices were used. This is somewhat misleading because in 1992 the safflower in the low-input and organic systems was replanted to beans with high income. However, the increased costs outweighed the gross returns, resulting in a net loss. Look- ing at only the first 3 years, the con- ventional systems showed the highest gross income.
Corn. The average cash value was highest for the low-input system with- out consideration of organic price pre- miums and for the organic system with price premiums in 1991 and 1992.
Winter grains/legumes. Lupin was grown intensively in 1989. The low-in- put system included a postemergence herbicide. As a result, the low-input system generated a marketable yield. In contrast, the organic system was overcome by weeds, despite four culti- vations, and replanted to barley. The 1990 lupin was drilled directly into the corn stubble to minimize costs and maximize the length of the growing season. Although costs and inputs were minimized, a marketable yield was not realized.
An oats-vetch mix was planted the next 2 years. This is a versatile crop in that it can be green chopped for feed or harvested as a seed crop. Selling it for seed has the potential to generate
[image:6.594.211.582.44.710.2]Fig. 4 Whole farm profits per acre.
dependent on the physical ability to sort the oat and vetch seed, which most growers do not have.
tems were harvested for seed in 1991, while ,the low-input oat-vetch was green chopped in 1992 and the organic plots were harvested for seed. The oat- vetch crop seed yield was so poor in 1992 that additional cleaning would not have left much clean seed for eventual sale. In contrast, the low-in- put oat-vetch forage chop had high yields. Unfortunately, a market for green chop feed does not really exist because it is too expensive to haul any distance. Virtually all green chop feed is grown and used on the same farm. Dairy farm advisors who work with forage crops helped estimate a value of $21 per ton. A local market would need to be identified before harvesting oat-vetch for forage again if this is to be considered a viable cash crop.
Beans. The gross returns from the low-input and organic systems were significantly higher than for the con- ventional 4-year system, even with conventional prices.
Both the low-input and organic sys-
Profitability
The profitability of each system is the sum of the net returns (the differences between the revenues and the costs) for each of the crops in that system. The differences in net returns (profit) are mostly attributable to the differences in yield and the price premi- ums in the organic markets. The differ- ences in costs are a less important factor.
Whole farm. Look- ing at the bottom line for the whole farm, the 2-year conventional system had the highest net return for each year of the rotation with all conventional prices as well as with organic price premi- ums (table 1). The organic system with conventional prices showed the lowest profit in all years, followed by the low- input system. Even with organic price premiums, the conventional 2-year system realized a higher average profit than the organic system. Nevertheless, the organic system with premium prices showed significantly higher net returns than the conventional 4-year and low-input systems in every year except 1991, when minimum tillage was used for incorporating the cover crops in the low-input and organic systems. The costs were reduced, but nitrogen fertility was inadequate so the yields for corn and tomatoes suf- fered. This dramatic difference in re- sults when using conventional and or- ganic premium prices shows the importance of the organic market for economic viability for organic produc- ers, including processing tomatoes in their rotations.
Tomatoes. The tomato yields and organic price premiums were the most important factors determining relative whole-farm profit because this is by far the highest value crop in the rota- tion. The highest average net returns were from the organic system when
price premiums were included. Other- wise, the conventional systems were always highest. The low-input and or- ganic systems had significantly higher costs, attributable to hand hoeing in all years and to transplanting in 1992. The low yield in organic tomatoes in 1989 and 1990 explains the low net return for the whole farm. Another signifi- cant factor was the negative return for the winter legume in those years.
Safflower. The safflower crop showed net losses in 1989 and 1991 in all systems, and low profits in 1990. In 1992 the conventional 4-year system showed marked improvement, while the low-input and organic systems showed large losses due to high ex- penditures in replanting to beans. The average returns were positive and highest for conventional 4-year, while the low-input and organic systems showed net losses.
Corn. The low-input system was most profitable for corn in all years ex- cept 1991, when fertility was inad- equate. The reduced use of inputs de- creased yield along with costs. The prudent use of herbicides in the low- input system allowed it to outyield the organic system, while keeping costs below the conventional systems in all other years. In 1992 the use of nitrogen sidedress turned out to increase profit- ability for the low-input system, but also raised costs above those for the conventional corn for the first time. The supplemental manure in the or- ganic system did not pay for itself un- less organic prices were received.
Winter grainshegumes. The win- ter grain/legume crop in the low-in- put and organic systems continues to be a problem. The returns have been negative in every year except 1989, when lupin was harvested for grain in the low-input plots.
[image:7.594.17.271.50.340.2]Break-even prices
Numerous factors outside the control of in- dividual farmers influ- ence market prices of commodities. These in- clude total production for the region and com- peting regions, im- ports, transportation costs, export demand and international trade agreements.
A break-even analy- sis estimates the prices needed to cover costs and thereby allows for comparison of system performance indepen- dent of commodity mar-
ket fluctuation. Of course, break-even analysis is still dependent on market prices of fuel, labor, seed and other in- puts, which are susceptible to the same outside forces as commodity prices are. Nevertheless, break-even prices are a good way to look at eco- nomic viability under current market conditions.
Table 2 shows the break-even prices and actual prices received by farmers. The organic and low-input systems are economically viable overall, although they have greater year-to-year fluctua- tion than the conventional systems.
Clearly, the processing tomatoes are profitable for all systems in all years, as the market prices are sub- stantially above the break-even prices in all cases. The organic and low-input tomato crops, while economically vi- able, are dependent on organic pre- mium prices for competitive perfor- mance with the conventional systems. The break-even prices for safflower were substantially above the market prices in 1989 and 1992 for the low-in- put and organic systems, and in 1989 and 1991 for conventional 4-year. Overall, the safflower crop performed much better in the conventional sys- tems than in the low-input and or- ganic systems. The break-even prices for corn in the low-input system were the lowest in all 4 years. The ranking between the organic and conventional 4-year systems was not consistent. However, the break-even prices for all
three systems were fairly consistent over time.
Conclusion
The design of a farm pro- duction system must take into account the costs of the inputs and the resulting value of the output. It can be argued that conventional agriculture has traditionally placed the greatest impor- tance on yield maximization while alternative agricul- ture has emphasized mini- mizing inputs and in par- ticular, nonrenewable resources. While it is easy to understand the roots of these philosophies, neither will lead to a profit-maxi- mizing situation. The Farm- ing Systems project strove to avoid both of these po- tential pitfalls by assem- bling an interdisciplinary team from the outset and in- cluding economic viability as a primary goal. Profit is the measure of economic viability used for analysis of the alternative sys tems studied in this project.
On average, all of the systems were profitable over the first 4 years of the project. Using conventional prices, the conventional 2-year system showed the highest average profit of all of the systems. The 4-year conventional sys-
Y
.- 2 a
::
C (0
In 1992 the low-Input and organlc toma- toes were transplanted Instead of direct seeded to glve the preceding cover crop a longer growing season and to improve competition with weeds.
-
tem has the second highest averagenet returns followed by the low-input and lastly the organic system, which was only slightly profitable.
Total costs for the low-input and organic systems were higher than for the conventional systems primarily due to the high costs of hand hoeing weeds in the tomatoes. Weed- control costs for all crops other than tomatoes were actually lower for the low-input and organic systems.
the organic and low-input tomatoes seems to have solved a number of lo- gistical problems in those systems. Hand hoeing costs have decreased and yields are on par with the conven- tional systems. However, the cost of transplants made the organic and low- input tomatoes less profitable with conventional prices than the conven- tionally grown tomatoes, even though the yields were not statisti- cally different.
The ranking is not the same on a crop-by-crop basis as on a whole-farm basis because of the disproportionate contribution of tomatoes to the bottom line. The conventional 4-year had the highest profit for tomatoes using con- ventional prices. The low-input shows the highest profit for corn, while the organic and low-input systems had higher profits for beans than the con- ventional system. Clearly, the crop se- lection for a rotation has a dramatic impact on the success of the system. Corn is a difficult crop to grow organi- cally because of the lack of economical weed control. Safflower is problematic because of the early planting date. A
remaining challenge is to profitably farm a winter legume/grain crop in
the low-input and organic systems that contributes to the overall perfor- mance of those systems.
The total production costs are quite similar when averaged over all 4 years. These averages are misleading, however, because the year-to-year comparisons demonstrate that the costs of low-input and organic systems can be either higher or lower than an analogous conventional system de- pending on the cover crop species se- lected, the number of operations used for ground preparation, incorporation of the cover crop and cultivation, and the amount of hand labor substituted for pesticides and fossil fuels. The low- input system actually has higher aver- age costs than the conventional 4-year because of hand hoeing costs in toma- toes. Reducing inputs in 1989 and 1991 succeeded in reducing relative costs, but resulted in poor tomato and corn yields and consequently lower overall profits for the low-input and organic systems compared to the conventional systems.
The most challenging component of the farming systems' design has been fertility management in the low-input and organic systems. This component
has also showed the greatest variation from year to year, showing a steep learning curve. Fine tuning the fertility program is a high priority for research currently underway. In particu- lar, the management of the cover crops preceding corn and toma- toes in the low-input and or- ganic systems is critical.
Weed management was the other significant factor affecting performance. In the low-value field crops, the use of herbicides made the conventional system the most expensive and lowest profit in safflower and corn. In contrast, the substitution of hand hoeing for herbicides in high- value processing tomatoes for the organic and low-input sys- tems made them more expensive than the conventional systems. The Farming Systems project has demonstrated that the crops studied can attain the same yields in the or- ganic and low-input systems as the conventional systems. It has also shown that organic and low-input sys- tems can be less expensive than con- ventional systems. However, without organic price premiums, neither the organic nor low-input systems have been able to show equivalent profits to either of the conventional systems on a whole-farm basis.
For organic production to compete with conventional production, the price premiums currently being real- ized in organic markets appear to be needed during the early transition pe- riod to offset lower yields of the field crops included in the Sustainable Ag-
riculture Farming Systems project. When price premiums are included, the organic system is the most profit- able for tomatoes, corn and beans and more profitable overall than either the low-input or conventional 4-year sys- tems. The organic system is still less profitable than the conventional 2-year system because the latter system has higher acreage in tomatoes.