Expanded production of labor-intensive crops
increases agricultural employment
RESEARCH ARTICLE
▲ ▲
Akhtar Khan Philip Martin Phil Hardiman
▼
The production of labor-intensive fruit, vegetable and horticultural spe-cialty crops increased in the 1990s, as did the employment of farmwork-ers: average annual employment or roughly the number of year-round equivalent jobs rose about 20%, to almost 400,000. Far more individuals, however, are employed on California farms during the year. Agricultural employers reported 1.1 million in-dividuals (unique Social Security numbers) when they paid unem-ployment insurance taxes in 2001. We analyzed the jobs and earnings of these farmworkers in 1991, 1996 and 2001. About three individuals were employed for each year-round equivalent job in the 1990s, and there was a shift to farmers hiring workers via farm labor contractors. The find-ings suggest that it may be possible to employ a smaller total farm work-force, with each worker employed more hours and achieving higher earnings.
C
alifornia has the largest and most complex agricultural labor market in the United States, reflecting seasonal employment demands, the predomi-nance of immigrant workers and the significant role of labor contractors in matching workers and jobs. Whether measured in sales, production or acres, California agriculture expanded in the 1990s (table 1). Farm sales reached $27 billion in 2000, with about 77 mil
-lion tons of crops produced on 8.8 mil
-lion acres. More than half of these sales (with 49 million tons of produce on 3.8 million acres) were in fruits and nuts, vegetables and melons, and horti
-cultural specialties (FVH), such as flow
-ers and nursery products. Rising yields
the country do so with proper docu
-ments. Regularization does not mean rewarding those who break the law. Regularization means that we give legal rights to people who are already con
-tributing to this great nation.” President George Bush agreed: “When we find willing employer and willing employee, we ought to match the two. We ought to make it easier for people who want to employ somebody, who are looking for workers, to be able to hire people who want to work”(Migration News 2001).
The United States and Mexico ap
-peared close to agreement on a program to legalize farm and other workers before September 11, 2001. However, after the war on terror was declared, the momentum for a new guest-worker pro
-gram and the legalization of immigrants already in the country slowed. In sum
-meant that more tons of vegetables were produced from the same acreage, while acreage of fruits and nuts rose from 2 million acres in 1990 to 2.4 million acres in 2000, a 19% increase over the 1990s.
Many FVH commodities are labor intensive, with labor accounting for 15% to 35% of production costs. Most of the workers employed on FVH farms are immigrants from Mexico, and a signifi
-cant percentage are believed to be unau
-thorized (fig. 1).
In recent years, several proposals have aimed to reduce unauthorized worker employment in agriculture (see page 4). In September 2001, Mexican President Vincente Fox called for a U.S.-Mexico labor migration agreement so
[image:1.612.216.555.558.724.2]that “there are no Mexicans who have not entered this country [U.S.] legally, and that those Mexicans who come into
TABLE 1. Harvested acres of California crops, 1991–2000
Field crops Fruits and nuts Vegs and melons
Year Acreage Production Acreage Production Acreage Production
tons tons tons
1990 5,233,715 25,141,401 2,002,650 13,051,525 1,185,790 21,149,460 1991 4,750,498 24,245,313 1,998,900 11,053,475 1,099,764 21,770,010 1992 4,926,284 24,731,653 2,012,500 13,492,350 1,061,976 18,659,660 1993 4,693,600 24,238,996 2,047,700 13,403,875 1,223,556 21,795,467 1994 4,913,800 25,980,008 2,092,350 13,748,800 1,327,502 25,047,912 1995 4,910,200 25,353,756 2,094,470 12,474,300 1,289,906 23,556,849 1996 5,029,000 25,276,521 2,155,050 13,112,150 1,382,228 25,252,871 1997 5,292,499 28,096,228 2,211,070 15,419,680 1,243,758 23,377,219 1998 5,161,274 26,875,266 2,249,650 13,359,825 1,351,526 28,028,170 1999 5,160,073 28,652,304 2,321,400 12,791,700 1,459,396 34,543,286 2000 5,035,220 28,528,069 2,383,760 15,486,300 1,380,064 33,077,470
1990–96 −3.9% 0.5% 7.6% 0.5% 16.6% 19.4%
1996–00 0.0% 13.0% 11.0% 18.0% 0.0% 31.0%
Source: CASS 2002.
Labor-intensive crops such as fruits and nuts, vegetables and melons, and horticultural spe-cialties now account for more than half of California farm sales. An analysis found that 1.1 million workers are doing the equivalent of 400,000 year-round agricultural jobs in California. In Watsonville, farmworkers harvest strawberries.
Edwin Remsberg/CSREES-USD
mer 2003, there were several new pro
-posals for a migration agreement with Mexico to legalize the status of currently unauthorized workers and allow some to earn immigrant status by working and paying taxes in the United States. There is little agreement, however, on what impacts such a program would have on California’s farm labor market.
We used a unique database to exam
-ine farm employment trends in Cali
-fornia agriculture. The data suggests that: (1) about three individuals are em
-ployed for each year-round equivalent job, helping to explain low farmworker earnings; (2) there was a shift in the 1990s from crop farmers hiring workers directly to farmers hiring via farm labor contractors (FLCs); and (3) there is con
-siderable potential to improve farm-labor market efficiency, by using a smaller total workforce with each work
-er employed more hours and achieving higher earnings.
Average, peak and total employment
California employers who pay $100 or more in quarterly wages are required to obtain an unemployment insurance (UI) reporting number from the California Employment Develop
-ment Depart-ment (EDD). The EDD then assigns each employer or report
-ing unit a four-digit Standard Indus
-trial Classification (SIC) or, since 2001, a six-digit North American Industry Classification System (NAICS) code that reflects the employer’s major ac
-tivity (US Census Bureau 2002). Major activities are grouped in increasing lev
-els of detail; for example, agriculture, forestry and fisheries are classified as a major industrial sector and, within this
sector, SIC 01 is assigned to crops, 017 to fruits and nuts and 0172 to grapes.
We defined “farmworkers” as unique Social Security numbers (SSNs) reported by farm employers to the EDD, and then summed their California jobs and earnings. This enabled us to answer questions such as how many farm and nonfarm jobs were associated with a par
-ticular SSN or individual in
1 year, and in which commodity or coun
-ty a person had maximum earnings. We adjusted the raw data before do
-ing the analysis. Farm employers have reported their employees and earnings each quarter since 1978, when near-universal UI coverage was extended to agriculture. Although it is sometimes alleged that farm employers, especially FLCs, do not report all their workers or earnings, there is no evidence that un
-derreporting of employees or earnings is more common in agriculture than in oth
-er industries that hire large numb-ers of seasonal workers, such as construction. We excluded from the analysis SSNs re
-ported by 50 or more employers in 1 year (there were 602 such SSNs and 59,776
wage records [jobs] in 2001). We also excluded wage records or jobs that had less than $1 in earnings and jobs, or that reported earnings of more than $75,000 in one quarter. These adjustments eliminated from the analysis 2,750 SSNs, 62,571 wage records or jobs and $803 mil
-lion in earnings. These exclusions were about 0.25%, 2.7% and 6.1% of the totals, respectively, and are documented more fully in Khan et al. (2003).
There is no single explanation for the outlier data we excluded. In some cases, several workers may share one SSN, while in others our suspicion that a SSN had “too many” jobs may represent data-entry errors.
During the 1990s, the Social Secu
-rity Administration cleaned up SSNs, including threatening to fine and reject tax payments from employers with too many mismatches between SSNs and the names associated with those SSNs, which should have reduced the num
-ber of SSNs reported by employers. We think the rising number of SSNs reflects more individuals employed in agricul
[image:2.612.241.576.580.717.2]-ture, not more noise in the data.
Fig. 1: Legalized and unauthorized farmworkers, 1989–2000. Source: NAWS 2001. The authors argue that the efficiency of the farm labor
market could be improved so that fewer workers are each employed more hours and achieve higher earnings. Left, begonia bulbs are produced in Marina. Center, Angelberto
Edwin Remsberg/CSREES-USD
A
Edwin Remsberg/CSREES-USD
A
Employees, jobs and earnings
Agricultural employment can be measured in three major ways: at a point in time, as an average over time or by counting the total number of in
-dividuals employed over some period of time. In the nonfarm labor market the three employment concepts yield similar results. If 100 workers are em
-ployed during each month and there is no worker turnover from month to month, then point in time, average and total employment is 100. However, ag
-ricultural employment during the six summer months may be 150, versus 50 during the six winter months, meaning that point, average and total employ
-ment counts differ.
We began with all SSNs reported by agricultural employers (SIC codes 01, 02 and 07), summed the jobs and earn
-ings of these SSNs within each SIC code, and assigned each SSN to the four-digit SIC code in which the worker had the highest earnings. This means that a SSN reported by a grape employer (0172) as well as by an FLC (0176) would be considered a grape worker if his high
-est-earning job was in grapes.
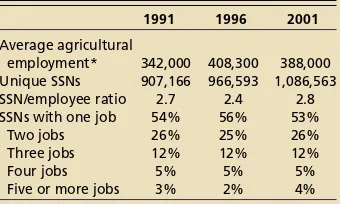
The number of individuals or unique SSNs reported by California agricultural employers has been stable over the past decade — 907,166 in 1991, 966,593 in 1996 and 1,086,563 in 2001 (table 2). However, average agricultural employ
-ment peaked in 1996 and then fell to 388,000, suggesting that more workers shared fewer jobs in 2001. (It is possible, but not likely, that the increased number of individual workers needed to pro
[image:3.612.220.558.56.417.2]-duce the increased tonnage worked only outside the pay periods containing the 12th of each month in a given quarter.
TABLE 3. Farmworkers and farm jobs: 1991, 1996, 2001
Average Average SIC Industry title Jobs Employees Earnings earnings earnings
$ millions $/job $/employee
1991
01, 02, 07 Agriculture 1,540,769 907,166 8,558 5,555 9,434
01 Production (crops) 684,130 482,511 3,943 5,763 8,171
02 Production (livestock) 59,428 55,535 893 15,035 16,089
07 Services 794,948 524,344 3,711 4,669 7,078
071, 072, 076 Farm services 646,215 432,794 1,986 3,074 4,590 074, 075, 078 Nonfarm services 148,733 136,902 1,725 11,597 12,600
Subtotal All nonag 407,449 376,480 2,585 6,344 6,866
50–59 & 70–89 Trade and services
as % of all nonag jobs 57.8% 56.8% 52.0%
Total Ag and nonag 1,948,218 1,283,646 11,143 5,720 8,681 1996
01, 02, 07 Agriculture 1,705,616 966,593 9,236 5,415 9,555 01 Production (crops) 694,238 498,268 4,026 5,800 8,081 02 Production (livestock) 54,496 51,368 830 15,224 16,151
07 Services 953,261 589,032 4,369 4,584 7,418
071, 072, 076 Farm services 786,422 489,633 2,428 3,088 4,960 074, 075, 078 Nonfarm services 166,839 152,422 1,941 11,634 12,734
Subtotal All nonag 453,000 408,265 2,718 6,000 6,657
50–59 & 70–89 Trade and services
as % of all nonag jobs 60.3% 58.8% 55.5%
Total Ag and nonag 2,158,616 1,374,858 11,954 5,538 8,695 2001
01, 02, 07 Agriculture 1,809,503 1,086,563 11,128 6,150 10,241 01 Production (crops) 630,428 474,195 4,027 6,388 8,493 02 Production (livestock) 68,575 63,854 945 13,774 14,792
07 Services 1,107,796 721,655 6,144 5,546 8,514
071, 072, 076 Farm services 817,708 507,231 2,530 3,094 4,987 074, 075, 078 Nonfarm services 290,088 264,366 3,614 12,459 13,671
Subtotal All nonag 697,334 609,746 4,629 6,638 7,592
50–59 & 70–89 Trade and services
as % of all nonag jobs 59.7% 57.9% 55.0%
Total Ag and nonag 2,506,837 1,696,309 15,757 6,286 9,289 Source: Analysis of wage records by EDD (2003) Labor Market Information Division.
The 12th of the month is the pay period for which employers are asked to report employee numbers.) Farmworkers had a total of 1.5 million farm jobs in 1991, 1.7 million in 1996 and 1.8 million in 2001. One-quarter also had at least one nonfarm job — about 407,000 workers were both farm and nonfarmworkers in 1991, 453,000 in 1996 and 697,000 in 2001 (table 3).
The total California earnings of persons employed in agriculture were $11.1 billion in 1991, $12.0 billion in 1996 and $15.8 billion in 2001 (all in 2001 dollars). (We converted earnings in 1991 and 1996 to 2001 earnings using the Employment Cost Index [ECI] for private industry in the western region, for wages and salaries only. We adjusted earnings using the ECI rather than the Consumer Price Index [CPI] because the ECI measures changes in the price of la
-bor including wages and salaries, while the CPI measures changes in the price of goods and services. Because the ECI
specifically measures wage changes, the U.S. Bureau of Labor Statistics [1997] strongly recommends using the ECI when converting nominal wages to real wages.) The share of total earnings for farmworkers from agricultural employ
-ers was 77% in 1991, 77% in 1996 and 71% in 2001, indicating that in the late 1990s, farmworkers tended to increase their supplemental earnings via nonag
-ricultural jobs.
Average earnings per job were high
-est in liv-estock, $13,800 per job in 2001. There was little difference between average earnings per job in agricultural services ($5,500) and crops ($6,400). Av
-erage earnings per job were higher for the nonfarm jobs of agriculture work
-ers ($6,600) than for agriculture jobs ($6,200).
Primary farmworkers and jobs
In 2001, California’s farmworkers held 2.5 million jobs, including 1.8 mil
-lion jobs with agricultural employers.
TABLE 2. Average agricultural employment, unique SSNs and jobs held: 1991, 1996, 2001
1991 1996 2001
Average agricultural
employment* 342,000 408,300 388,000 Unique SSNs 907,166 966,593 1,086,563 SSN/employee ratio 2.7 2.4 2.8 SSNs with one job 54% 56% 53%
Two jobs 26% 25% 26%
Three jobs 12% 12% 12%
Four jobs 5% 5% 5%
Five or more jobs 3% 2% 4% * Monthly employment summed and divided by 12 months,
[image:3.612.30.200.74.176.2]These agricultural jobs included 630,000 in crops, 69,000 in livestock and 1.1 million in agricultural services. The ag
-ricultural services sector includes both farm and nonfarm activities, such as veterinary and lawn and garden servic
-es; FLCs accounted for 70% of the em
-ployees reported by farm agricultural services. Fruits and nuts accounted for 53% of the crop jobs, dairy for 39% of the livestock jobs and FLCs for 58% of the agricultural services jobs. The major change between 1991 and 2001 was the drop of 54,000 jobs in crop production and increase of 313,000 jobs in agricul
-tural services.
We placed SSNs in the detailed com
-modity or SIC code that reflected the maximum reported earnings for the worker, and considered workers to be primarily employed in the SIC with maximum earnings. In 2001, there were 877,000 primary farmworkers, and they included 322,000 reported by crop em
-ployers, 50,000 reported by livestock employers and 504,000 reported by ag
-ricultural service employers. Fruit and nut employers accounted for 47% of the crop-reported workers, dairy for 40% of the livestock-reported workers and FLCs for 44% of the agricultural services–reported workers.
The major change between 1991 and 2001 was the increase in number of
SSNs with their primary (highest earn
-ing) job in agriculture — from 758,000 to 877,000. There was a slight drop in the number of workers reported by crop employers, a slight increase in livestock workers and a sharp 135,000 increase in agricultural services workers, anchored by a 59,000 increase (to 226,000) in workers reported by FLCs in 2001.
Most farmworkers had only one job. In 2001, 53% of the SSNs were reported by only one employer to the EDD, 26% were reported twice, 12% three times, 5% four times and 4% five or more times. During the 1990s, about 65% of farmworkers (SSNs) were reported by one agricultural employer only, 17% to 21% by two agricultural employers, 5% by at least two agricultural employers and one nonfarm employer, and 9% to 12% by one farm and one nonfarm em
-ployer.
In the three-digit SIC codes repre
-senting more detailed commodity sec
-tors, 60% to 83% of the employees had only one job. For example, in 2001 79% of the employees reported by dairy farms had one dairy farm job, while 7% also had a second agricultural job — 3% had a dairy job, a second farm job and a nonfarm job, and 11% had a nonfarm job in addition to the dairy job. About two-thirds of the employees of FLCs and farm management companies had
only jobs with one such employer; 22% had another farm job; 6% had an FLC job, another farm job and a nonfarm job; and 6% had a nonfarm job in addition to the FLC job.
Even more detailed four-digit SIC codes showed the same pattern: the commodities or SICs most likely to of
-fer year-round jobs such as dairies and mushrooms (food crops grown under cover) had 70% to 80% of employees working only in that commodity, while commodities or SICs offering more sea
-sonal jobs, such as deciduous tree fruits and FLCs, had 53% to 63% of employees working only in that commodity. At the four-digit, SIC-code level, the five largest SICs (FLCs, ornamental nursery products, crop preparation services [custom harvesters], grape employers, and vegetable and melon employers) accounted for about 45% of the agricul
-tural wages reported.
Earnings, estimates of hours worked
Agricultural employers (SIC 01, 02 and 07) paid a total of $11 billion in wages in 2001, an average of $10,200 per worker (table 3). Earnings were high
[image:4.612.63.580.70.298.2]-est for the 64,000 workers primarily employed in livestock; they averaged $14,800, followed by those primarily employed by crop employers ($8,500) and those employed by agricultural
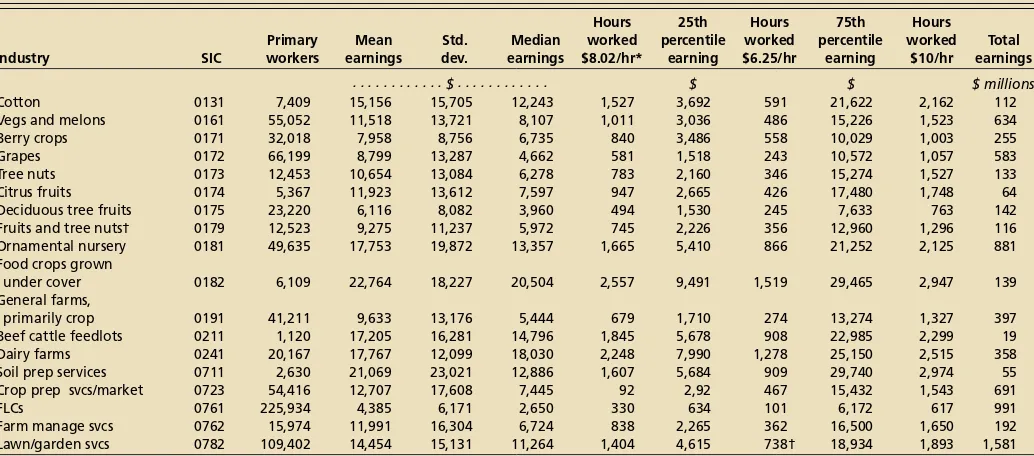
TABLE 4. Earnings of primary employees ($), 2001
Hours 25th Hours 75th Hours
Primary Mean Std. Median worked percentile worked percentile worked Total
Industry SIC workers earnings dev. earnings $8.02/hr* earning $6.25/hr earning $10/hr earnings
. . . $ . . . $ $ $ millions
Cotton 0131 7,409 15,156 15,705 12,243 1,527 3,692 591 21,622 2,162 112
Vegs and melons 0161 55,052 11,518 13,721 8,107 1,011 3,036 486 15,226 1,523 634
Berry crops 0171 32,018 7,958 8,756 6,735 840 3,486 558 10,029 1,003 255
Grapes 0172 66,199 8,799 13,287 4,662 581 1,518 243 10,572 1,057 583
Tree nuts 0173 12,453 10,654 13,084 6,278 783 2,160 346 15,274 1,527 133
Citrus fruits 0174 5,367 11,923 13,612 7,597 947 2,665 426 17,480 1,748 64
Deciduous tree fruits 0175 23,220 6,116 8,082 3,960 494 1,530 245 7,633 763 142
Fruits and tree nuts† 0179 12,523 9,275 11,237 5,972 745 2,226 356 12,960 1,296 116
Ornamental nursery 0181 49,635 17,753 19,872 13,357 1,665 5,410 866 21,252 2,125 881
Food crops grown
under cover 0182 6,109 22,764 18,227 20,504 2,557 9,491 1,519 29,465 2,947 139
General farms,
primarily crop 0191 41,211 9,633 13,176 5,444 679 1,710 274 13,274 1,327 397
Beef cattle feedlots 0211 1,120 17,205 16,281 14,796 1,845 5,678 908 22,985 2,299 19
Dairy farms 0241 20,167 17,767 12,099 18,030 2,248 7,990 1,278 25,150 2,515 358
Soil prep services 0711 2,630 21,069 23,021 12,886 1,607 5,684 909 29,740 2,974 55
Crop prep svcs/market 0723 54,416 12,707 17,608 7,445 92 2,92 467 15,432 1,543 691
FLCs 0761 225,934 4,385 6,171 2,650 330 634 101 6,172 617 991
Farm manage svcs 0762 15,974 11,991 16,304 6,724 838 2,265 362 16,500 1,650 192
Lawn/garden svcs 0782 109,402 14,454 15,131 11,264 1,404 4,615 738† 18,934 1,893 1,581
* USDA-NASS (2003) reported that annual average earnings of field and livestock workers in 2001 were $8.02 per hour; California minimum wage was $6.25 per hour in 2001. † Not elsewhere classified.
It may be possible to employ a
smaller total farm workforce, with
each worker employed more hours
and achieving higher earnings.
farm services, custom harvesters and FLCs ($5,000). There was considerable variation in earnings among workers in agricultural farm services: workers in soil preparation services (SIC 0711) averaged $21,100 in 2001, versus $12,700 for crop preparation services for mar
-ket (custom harvesters; SIC 0723) and $4,400 for FLC employees.
The average earnings of primarily farmworkers varied significantly, even within detailed four-digit SIC codes — in most cases, the standard deviation exceeded the mean wage (table 4). Me
-dian earnings were generally less than mean earnings, reflecting that higher-wage supervisors and farm managers pulled up the mean.
If the workers in detailed commodi
-ties are ranked from lowest-to-high
-est paid, the low-est 25% of earners in an SIC category generally earned less than $4,000 a year. For example, among workers primarily employed in veg
-etables and melons in 2001 (SIC 0161), the first quartile or 25th percentile of an
-nual earnings was $3,000. This reflects relatively few hours of work — if these workers earned the state’s minimum wage of $6.25 an hour in 2001, they worked 480 hours. The 25th percentile earnings cutoff was lowest for those employed primarily by FLCs, only $634, suggesting that FLC employees receiv
-ing the minimum wage worked 101 hours. The highest 25th percentile mark was in mushrooms (food grown un
-der cover), $9,491, which reflects 1,519 hours at minimum wage.
The 75th percentile marks the high
-est earnings that a nonsupervisory worker could normally expect to achieve — 75% of workers reported earning less than this amount and 25% earned more. The 75th percentile var
-ied widely by commodity: $6,172 for those primarily employed by FLCs, $10,572 for those in grapes and $29,465 for those in mushrooms.
More labor-intensive crops, jobs
The number of individuals and jobs reported by agricultural employers in
-creased in the 1990s, reflecting in-creased production of labor-intensive fruit and vegetable crops and, the data suggests, more farmworkers each worked a fewer number of hours. With the state’s mini
-mum wage at $6.25 per hour after Jan. 1, 2001 (and $6.75 per hour since Jan. 1, 2002), the earnings reported by employ
-ers suggest that most farmwork-ers are employed fewer than 1,000 hours per year (about half-time).
FLCs increased their market share in the 1990s, but dependence on them var
-ied by commodity. For example, FLCs rather than citrus growers reported many citrus workers, while dairy em
-ployers reported most dairy workers. FLCs are associated with low earnings, which sug
-gests few hours of work — the median earnings reported by FLCs for their employees in 2001 were $2,650, or 400 hours if workers earned the state’s $6.25 mini
-mum wage.
California’s farm labor market has large numbers of workers searching for seasonal jobs; FLCs are matching an increasing share of these workers with jobs, resulting in lower earnings for FLC employees. Workers who avoid FLCs experience higher earnings in agricul
-ture or in the nonfarm labor market. If FLCs are most likely to hire recently ar
-rived and unauthorized workers, as the National Agricultural Worker Survey (NAWS 2001) suggests, FLCs serve as a port of entry for immigrant farmwork
-ers.
The impact of guest workers, legal
-ization and earned legal-ization will depend on the details of any new pro
-gram. If the status quo continues, the percentage of unauthorized workers is likely to rise. Alternatively, if there were a legalization program, farmworkers might more quickly exit the farm work
-force. However, an earned legalization program could slow this exit if workers were required to continue working in agriculture to earn full legal status.
The next step in this analysis is to
examine the mobility of individual farmworkers over time and geography, examining where workers migrate during 1 year and patterns of entrance to and exit from the farm workforce (Moore et al. 2002). Do farmworkers who increase their earnings by moving to nonfarm jobs stay in nonfarm jobs, or do they sometimes return to agri
-culture? Are geographic and economic mobility linked for workers who get nonfarm jobs? Answers to these ques
-tions will help to determine the trajec
-tory of the farm labor market.
A. Khan is Research Program Specialist, La-bor Market Information Division, California Employment Development Department (EDD); P. Martin is Professor of Agricul-tural and Resource Economics, UC Davis; and P. Hardiman is Research Manager, Labor Market Information Division, EDD. The views expressed are those of the authors and do not necessarily reflect the policies of the EDD or the State of California.
References
[CASS] California Agricultural Statistics Service. 2002. www.nas.usda.gov.ca.
[EDD] California Employment Devel-opment Department. 2003.Current Em-ployment Statistics (CES). Labor Market Information Division, Sacramento, CA.
Khan MA, Martin P, Hardiman P. 2003. California’s Farm Labor Markets: A Cross-sec-tional Analysis of Employment and Earnings in 1991, 1996, and 2001. California Employ-ment DevelopEmploy-ment DepartEmploy-ment. www.calm-is.ca.gov/SpecialReports/Ag-Emp-1991to2001. pdf.
Migration News. 2001. Fox visits Bush. Vol 8, No 10. http://migration.ucdavis.edu/mn/ pastissues/oct2001mn_past.html.
Moore C, Khan A, Dardia M, Barbour E. 2002. Wage Mobility in California: An Analy-sis of Annual Earnings. California
Employment Development Department. www.calmis.ca.gov/specialreports/Wage- Mobility-2002.pdf.
[NAWS] National Agricultural Worker Sur-vey. 2001. US Department of Labor. www.dol. gov/asp/programs/agworker/naws.htm.
US Bureau of Labor Statistics. 1997. Hand-book of Methods. Ch. 8. http://stats.bls.gov/ hom/homch8.pdf.
US Census Bureau. 2002. The North Amer-ican Industry Classification System (NAICS). www.census.gov/epcd/www/naics.html.
[USDA-NASS] US Department of Agricul-ture, National Agricultural Statistics Service.