RESEARCH ARTICLE t
by Steven C. Blank, Hayley Boriss, Larry Forero
and Glenn Nader
We analyzed video auction sales in the western United States from 1997 to 2003, in an attempt to answer two long-standing questions about the economics of cattle ranching in California. First, as expected, ranchers received lower prices for cattle sold here compared to prices received by ranchers in the Midwest; this is due to the cost of transporting cattle to Midwestern feedlots. Second, some (but not all) “value-adding” produc-tion and marketing practices — such as preconditioning, Quality Assurance Programs and natural beef produc-tion — did raise prices received by ranchers. We report on the average location discounts and quality premi-ums for several market regions.
C
alifornia’s cattle ranchers have long suspected that buyers offer lower prices here than they do for similar cat-tle in the Midwest. The primary reason for this price discounting is generally believed to be because most U.S. feed-lot, slaughter and packaging facilities are located in the Midwest, and ranch -ers in California and other Western states must pay to ship calves to these facilities. Indeed, the cost of that trans -portation is the basis for price discounts offered in Western markets compared to those offered in markets located closer to the Midwestern meat-processing in -dustry (Clary et al. 1986). However, in the past it was difficult to calculate ex -actly how much of the price differences observed in Western versus Midwestern cattle sales was due to transportation costs as opposed to other factors, such as differences in the physical attributes of the animals.Cattle markets signal what they value by offering a price premium for animals that possess desired
character-istics (Mintert et al. 1990). Consequently, ranchers have developed production and marketing programs aimed at producing cattle with characteristics thought to add value.
In recent years there has been much discussion in the cattle industry about whether preconditioning weaned calves before sending them to market adds to their sales value. Preconditioning is a special type of management program aimed at making calves more valu-able to buyers. Several preconditioning programs have been discussed, includ-ing various respiratory-vaccination and weaning programs. For example, two research projects conducted by Colorado State University in 1997 and 1999, with video auction data from 1996 to 1997 and 1995 to 1998, respectively, both reported that combined vaccina-tion and weaning programs resulted in higher average prices than those re-ceived by sellers of unvaccinated calves (King 2003). In those studies, price pre -miums were reported as high as $3.89 per hundredweight (cwt).
Likewise, a study conducted by Oklahoma State University in December 2000 found that price premiums were received for preconditioned calves, but the premium was not enough to cover preconditioning costs (Avent et al. 2004). These studies focused on precon-ditioning, assessing its market effects. However, many factors influence cattle prices and those influences are often interactive.
Our research focused on price differ-ences in calf markets across locations and across value-adding programs. We were able to estimate both the aver-age transport-based price discounts and individual value-added program premiums received by ranchers. This new analysis gives a current picture of the market value of transportation and other pricing factors, such as precondi-tioning.
Cattle market economics
The basic price of an agricultural commodity is determined by the sup-ply of, and demand for, the product in a
Western cattle prices vary across video markets
and value-adding programs
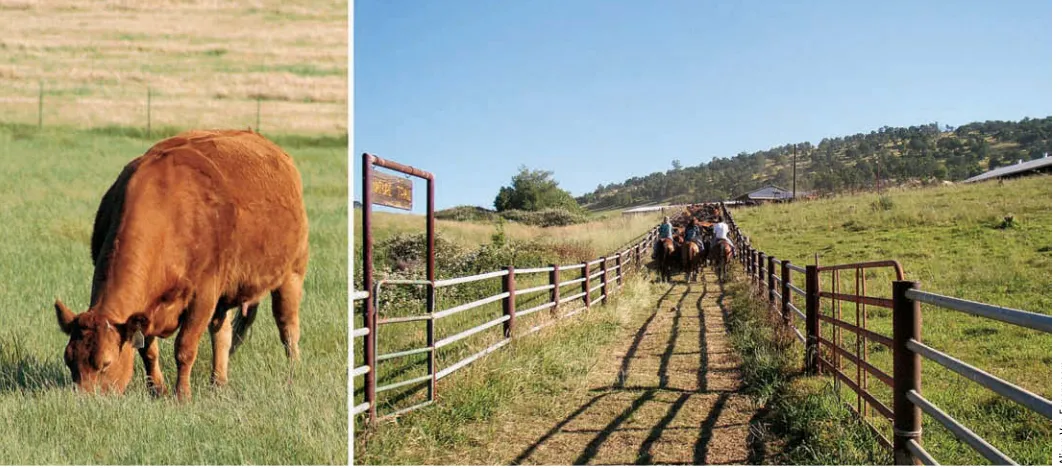
Western cattle ranchers have long suspected that they receive lower prices than ranchers located closer to Midwestern feedlots. The study showed that higher transportation costs accounted for much of this discrepancy. Above, a herd at the UC Sierra Foothill Research and Extension Center.
Alison
consumed and the costs of bringing the inputs together. The output of cattle ranches is calves and yearlings; these animals are inputs in the production of meat, which is the final consumable product. Other inputs in meat produc-tion include corn, soybean meal and other feed grains. The economics of transporting inputs make it most cost-effective to ship the most valuable input (on a per-pound basis) to the location of the least valuable (or most bulky) input. Consequently, calves should be transported to the feed grains, so facili-ties that combine the inputs — called feedlots — are mostly located near the source of feeds, the Midwest. The output of feedlots — fed cattle — is the primary input for slaughterhouses and other meat-processing operations, so those facilities are usually located near feedlots in order to reduce the costs of shipping live cattle. In general, the structure of the cattle and meat indus-tries developed to minimize total trans-portation costs (Clary et al. 1986).
These economic facts mean that the real value of a calf to a buyer is the price paid, adjusted for transportation costs. A cattle buyer for a feedlot is able to pay only up to whatever price translates into the maximum cost the feedlot can
afford for their cattle input. The real value of that price depends upon who is responsible for paying the transporta-tion costs incurred to get animals from the ranch to the feedlot. In most cases, calf sales contracts transfer ownership of the animals to the buyer at the time of the sale. This means the calves are “free on board” (FOB), from the rancher’s point of view, as soon as the animals get on the truck. In other words, the buyer is actually paying the transportation costs. However, that lowers the maxi -mum FOB price the buyer can pay to the rancher by the amount of transpor-tation costs per pound, so that the total real value of the calf does not exceed the maximum affordable to the buyer.
The bottom line for cattle ranchers is that their price received depends on their location relative to the buyer’s lo-local market. However, that basic price
must be adjusted across locations to get a more complete picture of the prices received by cattle producers. Previous economic research has found that prices observed at different locations at one point in time will differ by amounts up to the cost of transporting the product from one place to another. If price dif -ferences between locations exceed trans-portation costs per pound, it is possible for someone to buy cattle in the low-price market and immediately sell them in the high-price market after transport-ing the animals, and profit from dotransport-ing so. This “arbitrage” process reduces cattle supplies in the low-price market and increases supplies in the high-price market, pushing prices in the two loca-tions closer together until all potential for arbitrage profit is eliminated. In the highly efficient U.S. cattle market, few arbitrage opportunities appear because market participants react quickly to those opportunities, and their actions restore price differences to levels equal to or less than transportation costs.
A second issue regarding cattle prices over different locations involves the structure of the U.S. beef industry and its location. This structure is determined by the components of the final product
UC researchers (left to right) Morgan Doran, Larry Forero and John Cronin demonstrate how weaned calves are processed under a Quality Assurance Program. Such “value-added” calves often receive higher prices.
John Ev
ans
Photos:
W
estern
Video Mark
et
cation. At any point in time, a buyer can offer a higher price to ranchers located closer to the feedlot. With most feedlots located in the Midwest, ranchers there are expected to receive higher prices, on average, than those received by ranch-ers in more distant locations. Therefore, California ranchers are disadvantaged relative to their Midwestern competi -tors, because they receive discounted prices for the same product in the cur-rent cattle-market structure.
Video market study
We conducted a study with recent data from Western Video Market to see whether the dynamic cattle market discounts the prices paid to ranch-ers in Western states, as predicted by economic theory, and still values several characteristics that earlier research found received price premi-ums. Western Video Market, based in Cottonwood, Calif., is operated in a manner typical of video sales opera-tions. They hold auctions broadcast via satellite almost every month of the year (Western Video Market 2006).
Western Video Market provided us with anonymous information from 1,979 lots of steers sold in video auctions from
1997 to 2003. All lots had a flesh score of medium, a frame score of medium or medium-large, and average weights in the 500-pound to 625-pound range. This weight range was used to focus on the price effects of managing calves at weaning. The number of lots sold per year increased from 153 in 1998 to 397 in 2003. Average lot size increased from 130 head in 1997 to 146 head in 2003. In total, approximately 280,000 steers were included in our data.
We used data from video auctions because those sales operate much like a traditional auction, but have a much larger pool of potential buyers from across the country. Buyers watch the auction via satellite,
so they can be any-where. As each lot is being offered for sale, a prerecorded video taken by Western Video Market of the actual cattle is shown. Cattle sale prices observed in video auctions are often more indicative of “national” prices than local cash sales
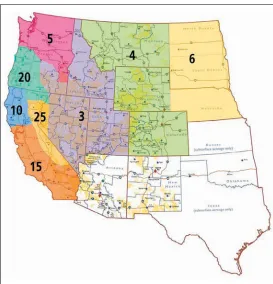
[image:3.612.342.587.306.602.2](Bailey et al. 1991). The cattle in our study were sold from ranches across most Western states (fig. 1). The data enabled us to analyze sales made at the same time at different locations. Our analysis of price differences across locations was simplified by grouping the sales data into several market regions, based on the pooling and flow of cattle observed in those locations over recent years (Bailey et al. 1995) (fig. 1). The out-of-state regions (regions 3–6) are large, covering entire states, whereas California is divided into three regions (regions 10, 15 and 25) to permit the detailed analysis of local markets. In addition, region 20 covers
[image:3.612.54.327.433.717.2]Fig. 1. Western and Midwestern market regions for video cattle sales.
TABLE 1. Average effects of factors on cattle prices, 1997–2003, and total discounts for all other regions
Factor Price effect* Significance† Total discount‡
$/cwt $/cwt
Region 10 (NW Calif.) -5.39 *** -6.66
Region 15 (S Calif.) -5.20 *** 6.47 Region 20 (W Ore., NW Nev., 4.90 *** -6.17
NE Calif.)
Region 25 (E Calif., W Nev.) -4.66 *** -5.93 Region 3 (SE Ore., Idaho, -3.97 *** -5.24 Utah, E Nev.)
Region 4 (Mont., Wyo., Colo.) -1.27
Region 5 (Wash., NE Ore.) -5.25 *** -6.52 Region 6 (N.D., S.D., Neb.) 1.27 ***
Preconditioned 0.81 ***
Quality Assurance program 0.92 ***
Implant 0.03
Bunk broke§ -0.37
Western Rancher’s Beef¶ 0.50
Weaning, time since 1.27 ***
Natural beef# 1.60 ***
Forward contracting period 0.13
Variability of animals in lot -0.63 ***
Head number in lot 0.01 *** Head number squared 0.00 * Weight (average/head) -0.17 ***
Weight squared 0.00
breed** a mixed
trend over time†† b ***
* Shows price average differences between the region indicated and region 4, the base. Negative numbers are discounts.
† Chi square for the random effects regression model is 1925.1; these variables are statistically significant (different than zero) when indicated by *, ** or *** (90%, 95% or 99% confidence level, respectively). A value with no asterisk is essentially zero, meaning there is no real price premium or discount.
‡ total discounts between region indicated and region 6. § Bunk broke = cattle accustomed to eating out of a feed bunk.
¶ Rancher marketing cooperative with set standards for product sold by members. # Certified in an affidavit from the seller.
** Breeds received different average prices within a $1.50 range.
western Oregon, the extreme north-west corner of Nevada and the extreme northeast corner of California.
Other information available for each of the lots included character-istics of the animals, such as breed, and details about each sales contract. Random effects regression models enabled us to estimate the effects on the sales price of not only location, but also other variables that commonly influence cattle prices.
Price discounts in Western markets
Our study found that Western markets consistently received a price discount (ta-ble 1). We quantified the average amount of the price discount or premium received by cattlemen in each market region after accounting for the effects on prices from the other factors listed.
For example, in market region 10 (northwestern California), the regional price effect showed an average discount of $5.39/cwt relative to the average price received for sales in region 4 (Montana, Wyoming, Colorado), which was used as the base because that region had the most sales during the entire period. Therefore, to get the total discount com-pared to the Midwest, the average pre -mium of $1.27/cwt received in region 6
(North Dakota, South Dakota, Nebraska) must be added, giving a total discount for region 10 compared to region 6 of $6.66. The total discounts for all other regions compared to average sales prices in the Midwest (region 6) are reported in the right-hand column of table 1. The regional results were consistent with the theory that the average price discounts will be larger the farther away the seller is from the Midwest.
The results for other factors listed in table 1 indicate how much the average price received was affected by the pres-ence of a particular attribute across all regions during the entire period. For example, increasing the length of time since weaning raised average prices. For every 30 days in the length of time since weaning, the average price increased about 1.3 cents per pound. Also, calves that met the requirements of the natural beef program received a premium aver-aging $1.60/cwt.
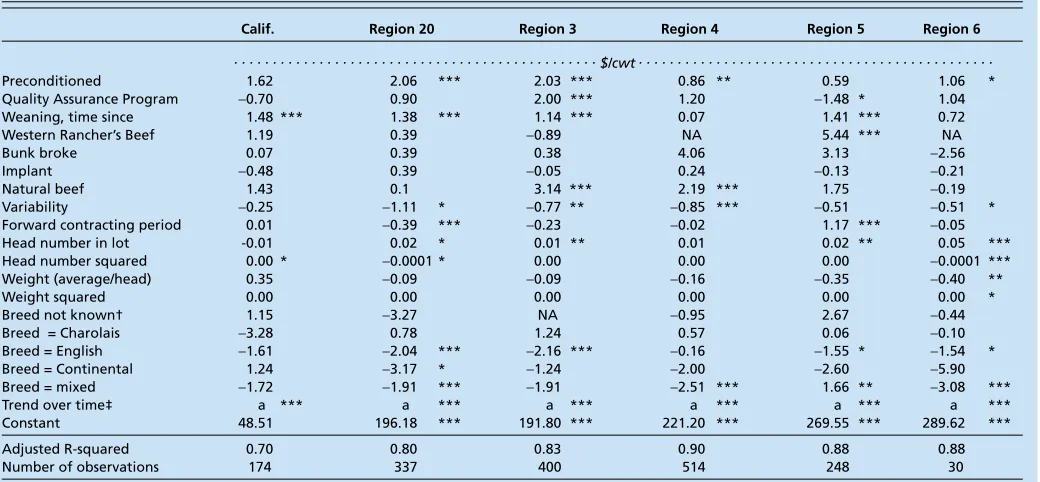
We conducted the same type of re-gression analysis for each of the
sepa-rate market regions to get more details about the effects on average prices from each of the factors, and found many dif-ferences across locations analyzed (table 2). This variability in results indicates differences in supply and demand in each market region.
The limited number of observations for region 10 led to weak statistical re-sults, prompting us to combine the data for the three main California regions (10, 15 and 25) to get enough observa-tions to generate reliable tests of the individual factors. By doing so, we got significant results for the variable “weaning, time since”; the average price received by ranchers in California was $1.48/cwt higher when they sold calves weaned at least 30 days (table 2).
Finally, location price discounts were evaluated by year to see if they changed over time (table 3). There were indeed differences in the average amounts from one year to the next in the seven sets of regression results. Those differences between years im-TABLE 2. Regression results by market region, 1997–2003*
Calif. Region 20 Region 3 Region 4 Region 5 Region 6
. . . $/cwt . . .
Preconditioned 1.62 2.06 *** 2.03 *** 0.86 ** 0.59 1.06 *
Quality Assurance program -0.70 0.90 2.00 *** 1.20 -1.48 * 1.04
Weaning, time since 1.48 *** 1.38 *** 1.14 *** 0.07 1.41 *** 0.72
Western Rancher’s Beef 1.19 0.39 -0.89 NA 5.44 *** NA
Bunk broke 0.07 0.39 0.38 4.06 3.13 -2.56
Implant -0.48 0.39 -0.05 0.24 -0.13 -0.21
Natural beef 1.43 0.1 3.14 *** 2.19 *** 1.75 -0.19
Variability -0.25 -1.11 * -0.77 ** -0.85 *** -0.51 -0.51 *
Forward contracting period 0.01 -0.39 *** -0.23 -0.02 1.17 *** -0.05
Head number in lot -0.01 0.02 * 0.01 ** 0.01 0.02 ** 0.05 ***
Head number squared 0.00 * -0.0001 * 0.00 0.00 0.00 -0.0001 ***
Weight (average/head) 0.35 -0.09 -0.09 -0.16 -0.35 -0.40 **
Weight squared 0.00 0.00 0.00 0.00 0.00 0.00 *
Breed not known† 1.15 -3.27 NA -0.95 2.67 -0.44
Breed = Charolais -3.28 0.78 1.24 0.57 0.06 -0.10
Breed = English -1.61 -2.04 *** -2.16 *** -0.16 -1.55 * -1.54 * Breed = Continental 1.24 -3.17 * -1.24 -2.00 -2.60 -5.90 Breed = mixed -1.72 -1.91 *** -1.91 -2.51 *** 1.66 ** -3.08 ***
trend over time‡ a *** a *** a *** a *** a *** a ***
Constant 48.51 196.18 *** 191.80 *** 221.20 *** 269.55 *** 289.62 ***
Adjusted R-squared 0.70 0.80 0.83 0.90 0.88 0.88
Number of observations 174 337 400 514 248 30
* Values are statistically significant (different than zero) only when indicated by *, ** or *** (90%, 95% or 99% confidence level, respectively). † Angus calves were used as the base for evaluating breed effects.
‡ a = four trend variables were used to account for the cattle cycle’s effects on regional market prices; all were statistically significant.
[image:4.612.38.558.74.315.2]ply that transportation costs are not the only source of the price discounts observed between the Midwest and other regions. These price differences across years also reflect differences in relative supply and demand in each location. However, the fact that the discount amounts are usually higher for regions farther from the Midwest supports the conclusion that transpor-tation costs are a major source of the price differences observed.
Impact of value-added programs
We evaluated the impact of several “value-added” factors on the price received for calves. For our study, we defined preconditioning as animals that had received respiratory vac-cinations prior to shipping. Those in Quality Assurance Programs (QAP) were handled according to specific guidelines (i.e., vaccinated in the neck). Implanting refers to whether or not the animal did or did not receive an im-planted growth hormone. In addition, calves weaned earlier have a lower in-cidence of sickness.
We found that both preconditioning and the QAP received a small but
statis-tically significant price premium, while implanting programs had no significant effect on the prices received by ranch-ers over the entire 1997 to 2003 period (table 1). However, many of the results varied between years (table 4). Clearly, there is much more to the story.
The explanation for the difference be-tween results of earlier studies and our results is readily apparent. The cattle industry has responded to the market (fig. 2). In particular, less than 10% of the calves were sold as preconditioned during the period covered by earlier studies, but by 2001 the majority were preconditioned.
The catalyst behind this change is the dynamics of a competitive mar-ket: sellers respond to buyers’ prefer-ences. Buyers expressed a preference for preconditioned calves during the 1990s, but few sellers were aware of this change in demand at first, so few ranchers were supplying precondi-tioned animals to the market. Buyers’ attitudes were typified by a feedyard manager in Nebraska who told a trade magazine in 1999, “I buy 4,700 calves per year, and cattle that are vaccinated are worth more to me than
nonvacci-nated cattle. In fact, I won’t buy cattle that aren’t preconditioned.” Clearly, the message got out to ranchers, and starting in 2001 they were supplying the market with mostly preconditioned calves. In other words, the market niche became the market norm.
Our study found two characteris-tics that consistently received a price premium over the data period. First, increasing the length of time since weaning increased average prices. For every 30 days since weaning, the aver-age price increased about 1.3 cents per pound (table 1). The premium varied from one year to the next (table 4), but was statistically significant each year beginning in 1998.
Second, calves that met the requiments of the natural beef program re-ceived a premium in each of the 5 years that sales of natural cattle were made in the video auctions, and that premium was statistically significant in 4 of those 5 years (table 4). To use the term “natu-ral” on a food label, the U.S. Department of Agriculture requires that the product must be minimally processed, and can-not contain any artificial ingredients or preservatives. “Natural” calves have never received growth hormones, an-tibiotics or ionophores (organic com-pounds that facilitate growth). The amount of the price premium for natu-ral beef was influenced by other factors such as breed and sale location (table 1). In our results, natural beef received a statistically significant premium in 4 of the 5 years, ranging from $1.11/cwt to $2.08/cwt (table 4). Over the entire 1997 to 2003 period, the average premium was $1.60/cwt (table 1).
[image:5.612.54.580.55.173.2]In the future, the existence of natural beef premiums and their amount will depend upon the competitive response TABLE 4. Price premiums for value-added calves*
Year Preconditioned QAP Implant Weaning, time since Natural beef
. . . $/cwt . . . .
1997 0.51 -0.33 0.29 0.64
1998 0.86 0.02 1.03 *** 2.17 *
1999 0.95 * -2.28 ** 0.13 0.80 ** 2.08 ***
2000 0.02 1.15 -0.68 * 1.13 *** 0.52
2001 0.31 1.36 *** 0.11 1.29 *** 1.11 *
2002 0.66 ** 0.30 -0.20 1.27 *** 1.20 **
2003 1.57 *** 1.73 ** -0.18 1.58 *** 1.84 *** * Values reported here were estimated using regression analysis. Positive values are price premiums for the attribute,
[image:5.612.58.399.587.697.2]negative numbers are price discounts. These values are statistically significant (different than zero) only when indicated by *, ** or *** (90%, 95% or 99% confidence level, respectively). A value with no asterisk is essentially zero, meaning there is no real price premium or discount.
TABLE 3. Regional price discounts by year*†
1997 1998 1999 2000 2001 2002 2003
. . . $/cwt . . .
region 10 -1.32 -3.44 *** -4.13 ** -8.24 *** -6.70 *** -2.84 ** -4.66 ***
Region 15 -3.30 *** -5.38 *** -4.73 *** -5.04 *** -6.00 *** -3.91 *** -4.50 ***
region 20 -5.13 *** -4.83 *** -4.21 *** -6.64 *** -6.44 *** -2.35 *** -4.58 ***
Region 25 -6.80 *** -3.87 *** -4.90 *** -6.13 *** -5.43 *** -3.13 ** -4.58 *** Region 3 -4.36 *** -4.36 *** -2.68 *** -5.65 *** -5.69 *** -2.49 *** -3.29 *** Region 5 -5.73 *** -4.81 *** -3.50 *** -6.54 *** -7.30 *** -3.94 *** -4.41 ***
Region 6 0.66 0.83 1.40 ** 1.49 ** -0.06 2.55 *** 1.67 ***
Adjusted R-squared 0.79 0.77 0.83 0.75 0.78 0.77 0.83
Number of observations 167 152 228 344 363 329 394
* regression results show average price differences between the region indicated and region 4, which was used as the base. Negative numbers are discounts, positive numbers are premiums. Thus, region 6 had the highest average prices.
within the cattle market. If buyers con -tinue to expand their demand for natu-ral beef, price premiums may continue. However, as ranchers respond and pro -vide increased supplies of natural beef to the market, the natural niche may become the norm and see its premiums competed away. During our study, natural beef sales were zero in 1997 and 1998, and steadily increased to 13% by 2003. Natural beef is still very much a niche market.
The same points can be made about the price effects of weaning-period length (fig. 2). The share of calves sold in the video market that were weaned more than 30 days was small in 1997 and 1998, but that share increased to
around 30% for sales from 2000 through 2003. Cattle producers have responded to the market and are delivering more calves weaned for a longer period and, as a result, are receiving a price pre-mium over the average price received for calves freshly weaned. However, the weaning niche could see smaller premi-ums if it grows to become a larger share of the market.
Market structure and price
In the future, the existence of location discounts and their amount will con-tinue to depend upon the cattle-market structure. As long as most feedlots and meat-processing facilities are located in the Midwest, calves raised in California will be sold at a price discount and shipped out of the state.
This leaves ranchers in California and other Western locations with few ways to raise their average price received other than value-adding in-novations, such as increasing the time between weaning and sale of a calf, or using “natural” production methods. These factors can result in higher aver-age market prices (table 1). However, whether the costs associated with those factors are lower than the price benefits is a question each rancher will have to determine individually.
The irony of our general results is that beef producers were moving toward more standard use of precondi-tioning programs involving the use of “value-adding” medications, and now buyers are beginning to reflect con
-sumers’ preferences for cattle that are free of rancher interventions. Natural beef, free of hormones and antibiotics, is a move back to the simpler produc-tion practices of the past, as illustrated by the decline in the share of animals implanted (fig. 2). The Western cattle industry’s future may involve discov-ering new market trends and quickly changing cattle management practices to produce a profitable niche product.
S.C. Blank is Extension Economist and H. Boriss was Research Assistant, Department of Agricul-tural and Resource Economics, UC Davis; L. Forero and G. Nader are Livestock Advisors, UC Coopera-tive Extension, Shasta/Trinity and Sutter/Yuba/Butte counties, respectively. The authors acknowledge and appreciate the contributions of Shasta Live-stock and Western Video Market.
References
Avent K, Ward C, Lalman D. 2004. Market valuation of preconditioning feeder calves. J Agric Applied Econ 36(1):173–83.
Bailey D, Brorsen W, Thomsen M. 1995. Identifying buyer market areas and the impact of buyer concentra-tion in feeder cattle markets using mapping and spatial statistics. Amer J Agric Econ 77:309–18.
Bailey D, Peterson M, Brorsen W. 1991. A compari-son of video cattle auction and regional market prices. Amer J Agric Econ 73:465–75.
Clary G, Dietrich R, Farris D. 1986. Effects of in-creased transportation costs on spatial price differences and optimum locations of cattle feeding and slaughter. Agribusiness: Int J 2:235–46.
King M. 2003. The Effect of Value-Added Health Programs on the Price of Beef Calves. Report prepared for Pfizer Animal Health. Pfizer Animal Health, Lincoln, Neb.
Mintert J, Blair J, Schroeder T, Brazle F. 1990. Analy-sis of factors affecting cow auction price differentials. Southern J Agric Econ 22(1):23–30.
[image:6.612.32.563.5.239.2]Western Video Market. 2006. www.wvmcattle.com.
Fig. 2. Cattle preconditioned, implanted or weaned over 30 days as a percentage of total sales.
Steve Quirt/UCCE Marin County Alison
Van Eenennaam
“Natural” beef, such as, above, grass-fed cattle in Marin County, continues to receive a price premium.