Measuring Efficiency of Statistical Methods Use in
Enterprises: Development of an Initial System
of Indicators
Berislav Žmuk
Faculty of Economics and Business, University of Zagreb, Croatia
Copyright©2017 by authors, all rights reserved. Authors agree that this article remains permanently open access under the terms of the Creative Commons Attribution License 4.0 International License
Abstract
The paper introduces an initial system of indicators for measuring statistical methods use efficiency in enterprises. The indicators are formed based on the questionnaire, which is used to inspect the attitude of employees towards statistical methods use in Croatian enterprises. With the purpose of understanding statistical methods use effectiveness better, indicators are classified into two groups: comparative and individual indicators. These indicators were used in the construction of the E-score indicator, which can be used to predict if an enterprise will achieve a positive net income due to an effective use of statistical methods or not. The system of indicators of statistical methods use efficiency developed within this research can be easily used by any enterprise. Using these indicators an enterprise can estimate its competitive position compared to other enterprises and it can predict if the difference will increase or decrease. Despite the existence of many business systems of indicators, the impact of statistical methods use used to be neglected. This paper corrects this and introduces statistical methods as a very important part of business decision making and continuous monitoring of business processes. However, this initial system of indicators has to be improved further to reach more precise conclusions.Keywords
Statistical Methods Use, Indicators, Croatia,
Enterprises, Multivariate Discriminant Statistical Analysis1. Introduction
In order to measure their performances and competitive positions, enterprises can use different benchmarks. Because only one indicator cannot provide a comprehensive insight into the business processes in an enterprise in an appropriate way, these benchmarks are regularly comprised of many different indicators. Consequently, these benchmarks are
also known as systems of indicators. By using systems of indicators an enterprise can see its position on the market regards its competition. In the same time, indicators can show if there are some potential problems in the business and if there are some possibilities for achieving better business results. It has to be emphasized that the benefits of better business results of an enterprise, except the enterprise, have employees, suppliers, investors, state and all other subjects in the surrounding. Therefore, the importance of business indicators in the modern enterprises should not be underestimated.
A system of indicators can be specialized for observing a certain aspect of business in an enterprise. By far the most used systems of indicators are those which are based on accounting data [1]. That is not surprising because enterprises have an obligation to publish certain financial statements [2]. Easy data availability is the main reason why most systems of indicators are based on accounting data. Consequently, other systems of indicators, which inspect certain aspects of business and which are not mainly based on accounting data, are not so well represented and used in practice. Therefore, there is also a lack of statistical methods use indicators.
indicators and their systems is that the process of forming a high quality system of indicators is a very demanding task. However, a system of indicators should be easy to use but, simultaneously, it also has to include all important business information.
The main aim of this paper is to address issues and to form a system of indicators for measuring the statistical methods use efficiency level in enterprises. So, the research question is whether a high quality system of indicators for measuring statistical methods use efficiency in enterprises can be formed. It has to be emphasized that under a high quality system of indicators is considered such a system of indicators which is easy to use and which includes all important information about statistical methods use in enterprises. Additionally, another research question is whether that system could be used for estimating whether an enterprise is going to achieve a positive net income or not. The research analysis, which will be applied in the paper, should be able to provide answers to these two research questions.
The paper is organized as follows. After a brief introduction of the research problem, the second chapter presents a literature review about development and characteristics of indicators systems which will be used as an example for constructing the new indicator system. In the third chapter data and methods are described, whereas in the fourth chapter the system of indicators for measuring statistical methods use efficiency in enterprises was formed and analysed. In the fifth, final, chapter conclusions, limitations and recommendations for further research are given.
2. Literature Review of Business
Indicator Systems
The indicators use in enterprises has a long tradition. Consequently, it is considered as unavoidable, inevitable, and, in some cases, the only possible knowledge source of economic phenomena and processes in the enterprise [12]. Indicators provide an insight into the current status of an enterprise and are useful tools in the processes planning, management and decision-making. Indicators are also considered as benchmarks of work and success of an enterprise. Furthermore, they are the signs of conscious shaping of a better future [13].
The indicators are, in fact, the relative sizes incurred by comparing two or more absolute values that represent the value of a particular process or phenomenon in the enterprise [14]. Popović [15] points out that there are three basic systems of expressing relative sizes: index numbers, percentage numbers, and relative numbers. In that way indicators can concisely express certain information making it comparable with other enterprises and previous values [12].
Despite its good properties, a single indicator cannot summarize and show in an appropriate way the whole business of an enterprise. Consequently, in practice different
systems of indicators, which consist of many carefully selected indicators, are used. An indicator system can be oriented towards a certain characteristic of an enterprise. So, an indicator system can be used for evaluating risk of an enterprise to go bankrupt, estimating the success of a management strategy, or for estimating the value of an enterprise.
Investors and financial-credit institutions are interested in the use of indicator systems for evaluating risk of an enterprise to go bankrupt. Among the first to test the usefulness of the financial indicators in predicting financial failure was William H. Beaver in 1966 [16]. The most famous indicators systems for predicting risk of an enterprise to go bankrupt are: Altman’s Z-score model, Kralicek’s DF indicator, Springate’s model, Fulmer’s model and CA-score [17].
Most of the developed indicators systems for predicting bankruptcy are based on the application of the statistical multivariate discriminant analysis. Likewise Edward I. Altman formed his famous indicators system based on the multivariate discriminant analysis in 1968. His indicator system is known as the Altman Z-score, where the Z-score represents the synthetic indicator that predicts bankruptcy of an enterprise within one or two years [16]. In designing his system of indicators, Altman started with 22 different financial indicators [18]. The number of indicators was reduced to five financial indicators by applying the statistical multivariate discriminant analysis. These selected indicators have been shown to be statistically significant in explaining the financial situation of an enterprise. In the process of indicators selection, apart from observing the statistical significance of the indicators, the correlation analysis was applied, the accuracy of different combinations of indicators was examined, and the additional analytical evaluation was performed [16]. The Z-score can reach a value in the interval from -4 to 8. The Z-score value higher than 2.99 indicates a low probability that an enterprise is going bankrupt in the next year. On the other side, the Z-score value lower than 1.81 indicates a high probability that an enterprise is going bankrupt in the next year. If the Z-score has a value between 1.81 and 2.99, a conclusion about the likelihood of an enterprise’s bankruptcy in the next year cannot be brought [1].
Out of the systems of indicators for evaluating business excellence mentioned above, the indicators system BEX is going to be emphasized. The indicator system BEX was developed for the assessment of business excellence of enterprises listed on the capital market [21]. In the BEX indicator system, 14 individual indicators were used as a starting point and only four of those were selected afterwards. If the BEX index has the value higher than one, an enterprise is considered to operate well. On the other hand, the value of BEX index between 0 and 1 suggests that an enterprise needs to make some improvements in its business.
In the economic literature and practice there are different approaches and methods of evaluation of an enterprise’s value. Thus the value of an enterprise can be assessed as a set of assets forms. In that case the value of an enterprise is defined by the sum of all individual assets form values. It should be noted that during this evaluation methods which are primarily focused on the present are used. So, the historical accounting values are reduced to the present value [22]. Instead of using static methods of estimating enterprises’ values, which are based on the enterprises’ assets, it is possible to use dynamic methods which are based on the expected future performance of an enterprise [22, 23]. Evaluating values of enterprises can also be done using market methods. The biggest obstacles in market methods application are difficulties in collecting all necessary data [24]. The market evaluation of an enterprise is based on the calculation of certain multipliers by which the market value of an enterprise is estimated.
3. Data and Methods
A system of indicators should consist of the smallest number of indicators as possible, but, at the same time, it should include all necessary indicators. Furthermore, in order to use a system of indicators as a management tool some requirements must be fulfilled [25]. The first requirement is that the system of indicators must quantitatively express the highest and the most important goals of an enterprise from the standpoint of the whole enterprise. The system of indicators must be adapted in a way that it includes a few indicators that highlight the essence and provide a simple overview of the whole enterprise. Nevertheless, the system of indicators must be complete and must include all the facts which are used to manage the whole enterprise. Furthermore, a high-quality indicators system should be flexible enough allowing reliable results and the use in all enterprises regardless of their specific characteristics, i.e. different sizes or main activities. Also, a high-quality system of indicators should require data that are relatively quick and easy to reach, and its use should not be too long and too complicated. Experiences from the abovementioned indicators systems are going to be used in the process of designing an indicators system for measuring the statistical methods use efficiency level in enterprises.
In order to design an indicators system for measuring the statistical methods use efficiency level in enterprises, the
data from the conducted web survey are going to be used. The target population in the research included Croatian enterprises that are registered in the Court Register of the Republic of Croatia as limited liability enterprises [2] and that are subject to the submission of annual financial statements in accordance with the Accounting Act [26]. On that way it is ensured that needed financial data for the indicators will be available because limited liability enterprises are obligatory to provide such data. The Croatian Company Directory of the Croatian Chamber of Economy has been used as the sampling frame. This sampling frame is considered to be official and because of that it is assumed that contains the most precise and up to date information about enterprises. Simple random sampling (SRS) approach was used to select which enterprises will be contacted and invited to participate in the survey by e-mail. In the e-mail it has been provided a unique hyperlink to the web questionnaire. It is believed that on that way the participation of enterprises in the survey will be the most convenient for them. In the survey period, from October 2012 to February 2013, overall 667 Croatian enterprises completely fulfilled the questionnaire.
In the survey statistical methods use was confirmed by 237 (36%) enterprises, whereas 430 (64%) enterprises in the sample admitted that they do not use statistical methods in theirs business processes. Because an indicators system for measuring the statistical methods use efficiency level in enterprises is going to be examined an enterprise’s use of statistical methods is the necessary requirement. Consequently, only enterprises which confirmed the use of statistical methods are going to be observed in the analysis. In addition to information from the survey, for the purpose of verifying new indicators, selected accounting data of enterprises related to 2011 are going to be used too.
In order to develop the indicators system for measuring the statistical methods use efficiency level in enterprises two different groups of indicators is going to be introduced. In the first group of indicators will be placed indicators which are going to be used for comparing the statistical methods use efficiency level between enterprises. In the second group of indicators it can be found indicators that measure the statistical methods use efficiency level only inside a certain enterprise. Based on the previous indicators and using the discriminative multivariate analysis, a special indicator is going to be designed for estimating whether an enterprise will achieve a positive net income or not.
4. System of Indicators for Measuring
Statistical Methods Use Efficiency
Level in Enterprises
4.1. Comparative Indicators
levels among enterprises. In this paper the comparative analysis is going to be made for all enterprises collectively, as well as for certain groups of enterprises stratified based on their size and main activity. Main activity is the most prevailing and core activity of an enterprise. According to the National Classification of Economic Activities [27] overall 21 groups of activities can be recognized in Croatia. However, due to the large number, for the purpose of the paper the number of activities will be reduced. So, the groups of activities have been merged and four large groups of activities are recognized. So, following groups are recognized: industrial enterprises (main activity is mining and quarrying, manufacturing, gas supply, electricity and water exploitation, or construction), trade enterprises (main activity is retail or wholesale trade), service enterprises (main activity is accommodation and catering services, transport, storage and communications, financial intermediation, real estate and renting, business services, education, enterprises engaged in health care and other services), other enterprises (main activity is agriculture, forestry, fisheries, arts, entertainment or recreation and enterprises engaged in activities of households as employers and other sectors). Overall three comparative indicators are developed.
The first comparative indicator is an indicator of the statistical methods use level (C1). This indicator is defined as the ratio of the number of statistical methods groups used in the observed enterprise and of the average number of statistical methods groups used in the group of enterprises with which the observed enterprise is compared. Thus, this indicator is calculated using the following equation:
AG G
C1 = i (1)
where Gi is the number of statistical methods groups used in
the observed enterprise i and AG is the average number of statistical methods groups used in the group of enterprises intended for comparison. It is assumed that there are overall 13 different statistical methods groups which an enterprise can use: descriptive statistics methods, outliers detection methods, inferential statistics methods, sampling methods, multivariate clustering methods, statistical design of experiment methods, statistical process control methods, acceptance sampling methods, indicators of dynamics, naïve forecasting models, smoothing forecast models, trend models, and regression modelling. It is assumed that an enterprise uses a particular statistical methods group in its business if it uses at least one statistical method that belongs to the group. These statistical methods groups are selected
[image:4.595.333.502.492.547.2]according to estimated usefulness criteria in enterprises. The C1 value is recommended to be higher than one because that would mean that the observed enterprise uses more statistical methods groups than its competition.
Table 1 presents the shares of enterprises in the sample which have the C1 indicator higher than one. If all enterprises are observed together, it can be concluded that 34.18% of enterprises use more different statistical methods groups than it is the average for all the enterprises together. In the group of small industrial enterprises 37.25% of enterprises from this group used more different statistical methods groups than it is the average for that group of enterprises.
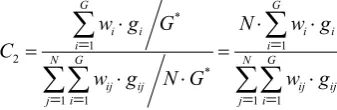
The indicator of the statistical methods frequency use is the second comparative indicator (C2). Unlike C1 indicator, C2 indicator takes into account both the number of used statistical methods groups and the frequency of their use. The C2 indicator is the ratio of the statistical methods groups average use frequency in the observed enterprise and of the average frequency of statistical methods use in the group of enterprises with which the observed enterprise is compared. The problem here is how to estimate the statistical methods group use frequency in an enterprise. In this paper, the estimation of the statistical methods group use frequency was made on time basis. So, if an enterprise chose the answer that it had used a statistical methods group in the last month, the weight value of 12 was added to this statistical group. If an enterprise used a statistical methods group in the last year, the corresponding weight value was set to 1. If an enterprise used a statistical methods group in the last three years, the corresponding weight value was set to 0.33. If an enterprise used a statistical methods group more than three years ago, the corresponding weight value was set to 0.10. Consequently, the C2 indicator is given as:
*
1 1
2
*
1 1 1 1
G G
i i i i
i i
N G N G
ij ij ij ij
j i j i
w g G N w g
C
w g N G w g
= =
= = = =
⋅ ⋅ ⋅
= =
⋅ ⋅ ⋅
∑
∑
∑∑
∑∑
(2)where wi is the i-th corresponding weight value, gi is the i-th
statistical methods group, giϵ{0,1}, G* is the maximum
number of statistical methods groups (here 13), wij is the
i-th corresponding weight value for the j-th enterprise, gij is
[image:4.595.62.547.673.744.2]the i-th statistical methods group for the j-th enterprise, N is the number of enterprises in the group with which an enterprise is being compared. The recommended C2 value is higher than one.
Table 1. The percentages of enterprises in the sample with the statistical methods use level (C1) indicator value higher than recommended
Table 2. The percentages of enterprises in the sample with the statistical methods frequency use (C2) indicator value higher than recommended
Size Main activity Total
Industrial Trade Service Other
[image:5.595.63.545.223.314.2]Small 27.45 60.38 34.29 50.00 34.88 Medium 20.00 33.33 50.00 --- 25.00 Large 40.00 50.00 33.33 --- 30.00 Total 24.59 60.34 31.25 50.00 30.80 Source: Authors’ calculations.
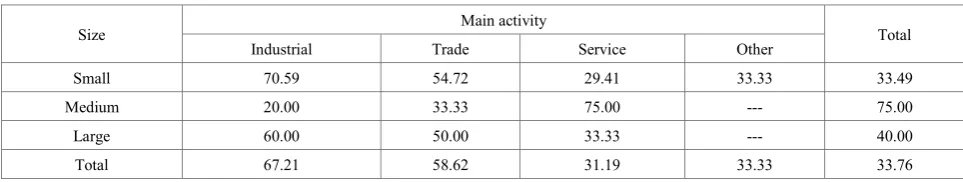
Table 3. The percentages of enterprises in the sample with the statistical methods use efficiency (C3) indicator value higher than recommended
Size Main activity Total
Industrial Trade Service Other
Small 70.59 54.72 29.41 33.33 33.49 Medium 20.00 33.33 75.00 --- 75.00 Large 60.00 50.00 33.33 --- 40.00 Total 67.21 58.62 31.19 33.33 33.76 Source: Authors’ calculations.
According to results provided in Table 2, 30.80% of enterprises in the sample use different statistical methods groups more often than it is the average. Consequently, 30.80% of enterprises have the C2 indicator higher than one.
The third comparative indicator (C3) is the indicator of the statistical methods use efficiency. The indicator C3 is defined as a ratio of statistical methods use efficiency in the observed enterprise and the average statistical methods use efficiency in the certain group of enterprises. However, the problem here is how to measure efficiency of statistical methods use. The efficiency of statistical methods use can be viewed as a ratio of benefits of statistical methods use and of costs which happened because statistical methods were used. Unfortunately, the information about total benefits and total costs connected with statistical methods use were not collected in the conducted survey. Because of that the closest approximations of benefits and costs must be introduced. Therefore, in order to estimate statistical methods use efficiency, total revenues and costs of enterprises that use statistical methods are going to be compared. Consequently, the indicator C3 is equal to:
1 3
1
N i
i i
i N
i
i i
TR
TR
C
E AE
TC
=TC
==
≈
∑
∑
(3)where E is statistical methods use efficiency in the enterprise i, which is defined as a ratio of total revenues TRi
and total costs TCi in that enterprises, AE is the average
statistical methods use efficiency in the group of selected enterprises given as total revenue of all enterprises in the group divided by total costs of all enterprises in the group.
The recommended C3 value is higher than one which means that the observed enterprise uses statistical methods more efficiently than the average enterprise in the observed group.
In order to calculate C3 indicator values, accounting data for the enterprises in the sample were collected from their balance sheets for the year 2011. Results, given in Table 3, show that overall 33.76% of enterprises had the statistical methods use efficiency level higher than was the average efficiency level.
4.2. Individual Indicators
The individual indicators for measuring the statistical methods use efficiency level in enterprises are used to compare statistical methods use levels and use efficiency levels inside an enterprise. This analysis can be made on the level of the whole enterprise or it can be used to compare different offices, departments, divisions, and similar. Overall eight individual indicators are developed.
The first individual indicator is the indicator of statistical methods groups use (I1). This indicator is given as a ratio of the number of statistical methods groups used in the observed enterprise and of the number of maximum possible statistical methods groups which the enterprise could use. In this research it is assumed that the maximum number of statistical methods groups usable by enterprises is 13. Consequently, the I1 indicator is equal to:
*
1 G G
I = i (4)
where Gi is the number of statistical methods groups used in
Table 4. The percentages of enterprises in the sample with the statistical methods groups use (I1) indicator value higher than recommended
Size Main activity Total
Industrial Trade Service Other
Small 15.69 15.09 15.24 0.00 14.88
Medium 0.00 0.00 25.00 --- 8.33
Large 40.00 0.00 66.67 --- 40.00 Total 16.39 13.79 16.96 0.00 15.61 Source: Authors’ calculations.
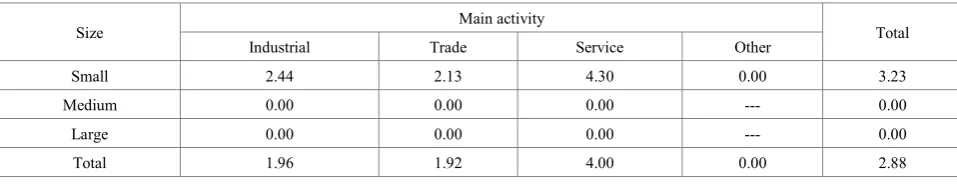
Table 5. The percentages of enterprises with the statistical methods group use with the time component (I2) indicator value higher than recommended
Size Main activity Total
Industrial Trade Service Other
Small 2.44 2.13 4.30 0.00 3.23
Medium 0.00 0.00 0.00 --- 0.00
Large 0.00 0.00 0.00 --- 0.00
Total 1.96 1.92 4.00 0.00 2.88
Source: Authors’ calculations.
The I1 indicator can take a value in the interval from 0 to 1. Three levels of statistical methods groups use are defined. If the I1 indicator is equal or lower than 0.33, the conclusion is that the observed enterprise uses a very small number of statistical methods groups in its business. So, this enterprise would be in the group of enterprises with low statistical methods groups use. The enterprises in the medium statistical methods groups use group have the I1 indicator higher than 0.33, but equal or lower than 0.66. The recommended I1 indicator value is higher than 0.66 meaning that an enterprise is highly relied on the statistical results in the process of decision making. According to the results provided in Table 4 only 15.61% of enterprises, in comparison to all the surveyed enterprises, had the recommended I1 indicator value. On the other side, there are no enterprises in categories of small other enterprises, medium industrial and trade enterprises, and large trade enterprises with the recommended I1 indicator value.
Instead of observing the number of used statistical methods groups which an enterprise has ever used, the better approach would be to observe how many statistical methods groups the enterprise has used recently. This “recent” period can be defined as statistical methods groups use in the last three years, in the last year, in the last quarter or in the last month. The choice of the observation period depends on the researcher or analyst. In order to emphasize the included time variable, the indicator of statistical methods groups use with included time component (I2) is:
*
2 G G
I t
i
= (5)
where Gt
i is the number of statistical methods groups used
in the observed enterprise i during last t periods and G* is the maximum number of statistical methods groups (here 13).
The I2 indicator can take a value in the interval from 0 to 1. Also, the higher the I2 indicator is, the more different statistical methods groups are used by an enterprise. Again, it is recommended that an enterprise has the I2 indicator higher than 0.66. If the statistical methods groups use by enterprises in the last year is observed, according to the results in Table 5 overall only 2.88% of enterprises met the recommended value. Only at small industrial, trade and service enterprises can be found enterprises with the recommended I2 indicator value.
The indicator of statistical methods groups use with the included time component and the changeable maximum number of statistical methods groups (I3) presents a further improvement of the I1 and I2 indicators. The I3 indicator as the maximum number of statistical methods groups takes the number of statistical methods groups which an enterprise has ever used. In that way the total number of statistical methods groups used is different depending on the observed enterprise. The I3 indicator is defined as:
* 3 Git Gi
I = (6)
where Gt
i is the number of statistical methods groups used
in the observed enterprise i during last t periods and Gi* is
[image:6.595.64.543.224.316.2]Table 6. The percentages of enterprises with the statistical methods groups use with the time component and the changeable total number of statistical methods groups (I3) indicator value higher than recommended
Size Main activity Total
Industrial Trade Service Other
Small 19.51 12.77 30.11 20.00 23.12 Medium 0.00 0.00 50.00 --- 16.67
Large 0.00 50.00 0.00 --- 10.00
Total 15.69 13.46 30.00 20.00 22.12 Source: Authors’ calculations.
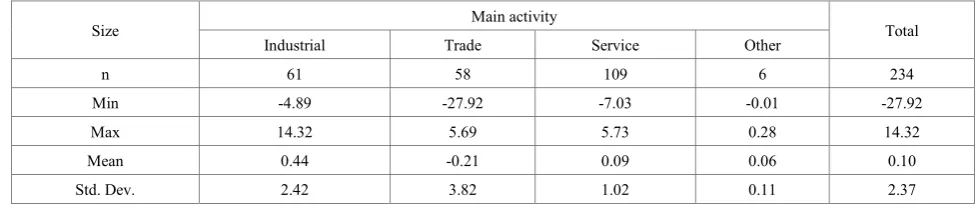
Table 7. The basic descriptive statistics results for the indicator of the value of the net income per used statistical methods group (I4), in mil. HRK
Size Main activity Total
Industrial Trade Service Other
n 61 58 109 6 234
Min -4.89 -27.92 -7.03 -0.01 -27.92
Max 14.32 5.69 5.73 0.28 14.32
Mean 0.44 -0.21 0.09 0.06 0.10
Std. Dev. 2.42 3.82 1.02 0.11 2.37 Source: Authors’ calculations.
The I3 indicator shows the potential of statistical methods use in the certain period in compare to whole business period. The higher the I3 indicator is, the higher statistical methods use level is and the higher business results could be as a result of intensive use of statistical methods. If the I3 indicator is low it can be assumed that the business results are not at their maximum and that they could be improved by more intensive use of statistical methods [28]. Because of business cycles it is recommended for the I3 indicator to be higher than 0.66. According to the table 6, overall 22.12% of enterprises had the I3 indicator higher than 0.66. Again, there are some categories of enterprises that with no enterprises with the recommended values. Such categories of enterprises are medium industrial and trade enterprises, and large industrial and service enterprises.
Unlike the previous individual indicators, the following three individual indicators observe the net income, total revenue and total costs per used statistical methods group:
i
i G
NI
I4 = (7)
i
i G
TR
I5= (8)
i
i G
TC
I6= (9)
where I4 is the indicator of the value of the net income per used statistical methods group, NIi is the net income of the
enterprise i, Gi is the number of statistical methods groups
used in the observed enterprise i, I5 is the indicator of the value of the total revenue per used statistical methods group, TRi is the total revenue of the enterprise i, I6 is the indicator of the value of the total costs per used statistical methods group, TCi is the total costs of the enterprise i. The values of
the indicators I4 and I5 are recommended to be higher than in the previous periods. The higher the values of the indicators I4 and I5 are, the higher efficiency of statistical methods use is. Namely, it is not only important how many statistical methods groups an enterprise uses, but it is also important how they are used. On the other hand, the suggested value for the indicator I6 is not so easy to determine. Namely, the increased costs can be result of an increased business activity which is a positive development. Furthermore, it should be noticed that here it has been assumed that all statistical methods groups have the same importance level. Consequently, in the equations (7)-(9) all statistical methods groups have the same weight value of one.
According to the results provided in Table 7 the lowest I4 indicator value among the observed 234 enterprises was HRK -27.92 million, whereas the highest value was HRK 14.32 million. The average I4 indicator value for all the observed enterprises was HRK 0.10 million with the standard deviation of HRK 2.37 million.
The I7 indicator shows the average costs per one statistical methods use. The frequency of statistical methods use is estimated in the same way as for the C2 indicator. Consequently, the I7 indicator is given as:
7
1
G
i j j
j
I TC w g
=
=
∑
⋅ (10)where TCi is the total costs of the enterprise i, wj is the j-th
corresponding weight value, gj is the j-th statistical methods
[image:7.595.58.548.228.332.2]Table 8. The basic descriptive statistics results for the indicator of the average costs per one statistical methods use (I7), in mil. HRK
Size Main activity Total
Industrial Trade Service Other
n 50 51 97 5 203
Min 0.001 0.002 0.001 0.181 0.001 Max 116.356 293.525 242.485 170.555 293.525 Mean 8.786 10.008 5.202 35.432 8.037 Std. Dev. 22.228 42.052 25.454 75.558 31.656 Source: Authors’ calculations.
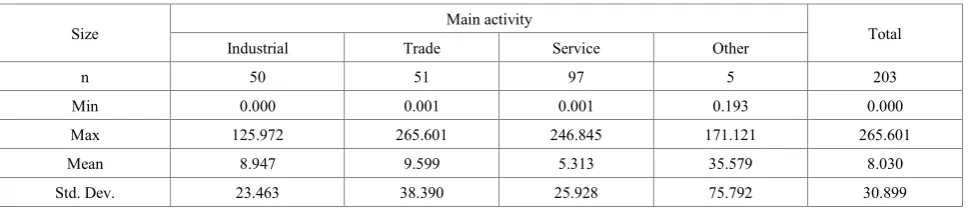
Table 9. The basic descriptive statistics results for the indicator of the average revenue per one statistical methods use (I8), in mil. HRK
Size Main activity Total
Industrial Trade Service Other
n 50 51 97 5 203
Min 0.000 0.001 0.001 0.193 0.000 Max 125.972 265.601 246.845 171.121 265.601 Mean 8.947 9.599 5.313 35.579 8.030 Std. Dev. 23.463 38.390 25.928 75.792 30.899 Source: Authors’ calculations.
According to Table 8, on average, when all 203 enterprises are observed together, the average cost per statistical method use is about HRK 8 million.
The average revenue value per one statistical methods use is shown by the I8 indicator. The I8 indicator is calculated as follows:
8
1
G
i j j
j
I TR w g
=
=
∑
⋅ (11)where TRi is the total revenue of the enterprise i, wj is the
j-th corresponding weight value, gj is the j-th statistical
methods group. Unlike the I7 indicator, the higher the I8 indicator the better.
The information that on average, when all 203 enterprises are observed together, the average revenue per statistical method use is about HRK 8 million can be taken as positive. But if this value is compared with the average cost per statistical method use, it can be concluded that the average revenue is slightly smaller than average costs.
4.3. E-score Indicator
Overall 11 different indicators are introduced and used in the analysis of usage levels and of statistical methods usage effectiveness in enterprises. However, at the end of the day, the management in an enterprise is interested in the impact of statistical methods use on the business result. So, they want to know if the current level of statistical methods use and the current efficiency level of their use would increase their probabilities to make a positive net income value in the future periods. In order to provide an answer to this question, a new indicator has to be introduced. The new indicator is going to be built on the basis of previous 11
indicators. In order to determine which of 11 indicators should be used in the new “synthetic” indicator and what impact they should have on the “synthetic” indicator value, the statistical multivariate discriminant analysis approach is going to be used. It should be noted that the “synthetic” indicator will be formed for all enterprises without taking into account their different characteristics. Accordingly, the “synthetic” indicator will not stratify enterprises according to their size or main activity. In order to make it easier to follow, the “synthetic” indicator is going to be named E-score indicator because it represents overall effectiveness of statistical methods use in an enterprise.
In order to form the E-score indicator the initial plan was to use data values of all 11 indicators for all 237 enterprises in the sample which stated that they use statistical methods. Unfortunately, for some enterprise it was not possible to calculate certain indicators. Because of that 34 enterprises are omitted from the further analysis. Finally, data from 203 enterprises were used in estimating the E-score indicator.
In the statistical multivariate discriminant analysis, the 11 indicators were used as independent variables whereas net income, with modalities “Yes” and “No”, was determined to be the dependent variable. In order to choose which independent variables will enter the model the forward stepwise selection method of the independent variables was used. It turned out that only two indicators were statistically significant for the purpose of classification. The indicators which entered the model are C3 (Wilks’ lambda=0.9214, p-value<0.0000) and I4 (Wilks’ lambda=0.6983, p-value=0.0031).
[image:8.595.64.550.238.345.2]4 3
1 16.99 30.83 C 0.00000006 I
CF =− + ⋅ − ⋅ (12)
4 3
2 10.55 22.36 C 0.0000003 I
CF =− + ⋅ − ⋅ (13)
The first classification function (CF1) is given for enterprises which achieved a positive net income whereas the second one (CF2) is given for enterprises which achieved a negative net income (loss). Depending on which classification function value is higher, the enterprise is classified in the group of enterprises which are projected to have a positive net income or in the group of enterprises which are projected not to have a positive net income. By using classification functions 86.21% of enterprises were classified into the right group. Because of this high rate it can be concluded that the model is very successful and its further use is thereby justified.
Using the canonical analysis in the multivariate discriminant analysis, the following unstandardized (raw) function was obtained:
4 3 0.0000001379 85
. 4 996 .
4 C I
CA= − ⋅ − ⋅ (14)
Standardized coefficients for canonical variables are the following: for the indicator of the statistical methods use efficiency (C3) it is equal to -0.9116 and for the indicator of the value of the net income per used statistical methods group (I4) it is -0.3600. If absolute values of these two standardized coefficients are summed up, the resulted score is equal to 1.2717. Consequently, if an enterprise has the canonical functions value lower than 1.2717, it will be put into the group of enterprises for which it is estimated that they will have a positive net income.
Because of an intuitive approach and an easier use in practice, the E-score indicator will be based on the unstandardized canonical function. In order to make the conclusion process easier, certain modifications to the unstandardized canonical function are going to be made. Firstly, the unstandardized canonical function is going to be, instead of to the value of 1.2717, benchmarked to the value of 0. Because of that the value of 1.2717 was deducted from the unstandardized canonical function constant value. Furthermore, the describing sides are going to be switched. In order to do that, all coefficients were multiplied by -1. Consequently, the final form of the E-score indicator is the following:
4 3 0.0000001379 85
. 4 72 .
3 C I
score
E− =− + ⋅ + ⋅ (15)
If the value of the E-score indicator, which is a “synthetic” indicator which represents overall effectiveness of statistical methods use in an enterprise, is positive, it is anticipated that the observed enterprise, owing to the effective statistical methods use, is going to make a positive net income in the next period. Otherwise, if the value of the E-score indicator is negative, it is assumed that the observed enterprise is going to fail to make a positive net income in the next period because of an inefficient use of statistical methods.
5. Conclusions
The existing research has recognized the importance of statistical methods use and the problem of scarce application of statistical methods is being emphasized. This paper is going a step further emphasizing the problem of an inefficient statistical methods use by introducing overall 11 different indicators. Each of the indicators covers a certain segment of measuring statistical methods use efficiency.
The intention was to construct such indicators which enterprises could very easily and quickly calculate on a monthly basis. Still, this was partially successful because in order to calculate the indicators certain data about statistical methods use must be known. Unfortunately, these data are not public and easily available. Because of that periodical surveys should be conducted, if possible each year, and a database should be formed so that enterprises can have an insight into some referent values and to be able to make comparisons. Consequently, the answer to the first research question is only partially positive. Namely, the introduced indicators can be used very easily but the lack of needed data and information present a serious shortcoming.
Further improvements of the indicators are needed and expected. The paper analysed 13 different statistical methods groups. However, it would be good to reconsider the conducted grouping of statistical methods. Also, in order to make things easier for enterprises and to facilitate data collection, maybe it would be good to reduce the number of statistical methods groups. Moreover, the measurement of statistical methods use benefits and costs must be improved. Because of the lack of information, only rough estimations were used in the paper.
The E-score indicator is introduced as a measure which shows if an enterprise is probable to achieve a positive net income in the next period due to an efficient statistical methods use or not. On that way the E-score indicator can be observed as a prediction tool. The conducted statistical multivariate discriminant analysis has shown that it would be the best for the E-score indicators to be built by only two indicators – the indicator of the statistical methods use efficiency (C3) and the indicator of the value of the net income per used statistical methods group (I4). The efficacy of classification of enterprises by using the E-score indicator is 86.21%, which could be considered as satisfactory. Consequently, the answer to the second research question is positive because the high efficacy of classification rate has shown that the system of indicators for measuring the statistical methods use efficiency level in enterprises can be used to estimate whether an enterprise is going to achieve a positive or a negative net income.
results for a certain enterprise. The reason for such underestimation of enterprises with negative net income can be found in the fact that the indicator of the statistical methods use efficiency (C3) was approximated by ratio of total revenues and total costs. Unfortunately, similar research on the topic of measuring impact of statistical methods has not been conducted yet. Consequently, comparison with previous research cannot be done. In the future research and in the future surveys the statistical methods use efficiency should be better estimated. Furthermore, the E-score indicator does not take into account specific characteristics of enterprises such as the size, the main activity and the legal form. Further research should take into account these characteristics and form special E-score indicators or indicators of statistical methods efficiency use just for them. Of course, in the further research and surveys additional necessary data should be collected. Only on that way this initial system of indicators can reach the version which in full could be used in enterprises. However, the presented initial system of indicators can already be used in enterprises but due to lack of information some indicators could not be used. On that way, by using only selected indicators, enterprises, for the time being, can only partially estimate their position in level and efficiency of statistical methods use in compare to the other enterprises.
Acknowledgements
This work has been fully supported by the Croatian Science Foundation under the project STRENGTHS (IP-2013- 9402).
REFERENCES
[1] S. M. Bragg. Business Ratios and Formulas: A Comprehensive Guide, John Wiley & Sons, New Jersey, 2007.
[2] Official Gazette. The Companies Act, Vol.20, No.152, 2011. [3] L. Kish. Survey Sampling, John Wiley & Sons, New York,
1995.
[4] B. Žmuk. Business Sample Survey Measurement on Statistical
Thinking and Methods Adoption: the Case of Croatian Small Enterprises, Interdisciplinary description of complex systems, Vol.13, No.1, 154-166, 2015.
[5] S. B. Dransfield, N. I. Fisher, N. J. Vogel. Using Statistics and Statistical Thinking to Improve Organisational Performance, International Statistical Review, Vol.67, No.2, 99-150, 1999.
[6] Z. Gogala, V. Šimičević. Korištenje statističkih metoda u
hrvatskim poduzećima, Zbornik Ekonomskog fakulteta u
Zagrebu, Vol.3, No.1, 321-338, 2005.
[7] M. Makrymichalos, J. Antony, F. Antony, M. Kumar. Statistical thinking and its role for industrial engineers and managers in the 21st century, Managerial Auditing Journal, Vol.20, No.4, 354-363, 2005.
[8] B. Bergquist, M. Albing. Statistical methods—Does anyone really use them?” Total Quality Management & Business Excellence, Vol.17, No.8, 961-972, 2006.
[9] B. Abraham. Implementation of Statistics in Business and Industry, Revista Colombiana de Estadística, Vol.30, No.1, 1-11, 2007.
[10] N. P. Grigg, L. Walls. Developing Statistical Thinking for Performance Improvement in the Food Industry, International Journal of Quality & Reliability Management, Vol.24, No.4, 347-369, 2007.
[11] M. Gjonbalaj, M. Dema, I. Miftari. The Role of Statistics in Kosovo Enterprises, Journal of Applied Quantitative Methods, Vol.4, No.3, 295-305, 2009.
[12] N. Osmanagić Bedenik. Potencijali poduzeća: Analiza i
dijagnoza potencijala u poslovanju poduzeća, Alineja, Zagreb,
1993.
[13] H. Antoine. Kennzahlen, Richtzahlen, Planungszahlen, Betriebwirtschaftliceher Verlag dr. Th. Gabler, Wiesbaden, 1956.
[14] M. Foršek. Ekonomska analiza poslovanja, Liber, Zagreb,
1985.
[15] Ž. Popović. Ekonomska analiza poslovanja, Informator,
Zagreb, 1979.
[16] K. Žager, I. Mamić Sačer, S. Sever, L. Žager. Analiza
financijskih izvještaja, Masmedia, Zagreb, 2008.
[17] R. Zenzerović. Model ocjene vremenske neograničenosti
poslovanja poslovnih subjekata u Republici Hrvatskoj, Juraj Dobrila University of Pula, Pula, 2008.
[18] E. I. Altman. Financial Ratios, Discriminant Analysis and the Prediction of Corporate Bankruptcy, The Journal of Finance, Vol.23, No.4, 589-609, 1968.
[19] Z. Hoque. Strategic Management Accounting: Concepts, Processes and Issues, Pearson Education, Frenchs Forest, 2006.
[20] R. Zenzerović. Aktivnosti interne revizije u procesu postizanja
poslovne izvrsnosti, Zbornik radova 15. savjetovanja „Interna
revizija i kontrola“, Hrvatska zajednica računovođa i
financijskih djelatnika, 61-77, 2012.
[21] V. Belak, Ž. Aljinović Barać. Tajne tržišta kapitala - BEX
indeks, analiza financijskih izvještaja, pokazatelji efikasnosti ulaganja i modeli odlučivanja, Belak Excellens, Zagreb, 2008.
[22] S. Kolačević, B. Hreljac. Vrednovanje poduzeća – novi
pristupi i upravljanje temeljeno na vrijednosti, TEB – Poslovno savjetovanje, Zagreb, 2009.
[23] D. Miloš Sprčić, O. Orešković Sulje. Procjena vrijednosti
poduzeća: Vodič za primjenu u poslovnoj praksi, Ekonomski
fakultet, Zagreb, 2012.
[24] V. Poznanić, J. M. Cvijanović. Metode vrednovanja preduzeća,
Ekonomski institute, Beograd, 2011.
[27] Official Gazette. The National Classification of Economic