Application of Structural Equation Modelling in
Construction Management Research
Sia Mal Kong1, Christy Pathrose Gomez2 and Zuhairi ABD. Hamid3
1. Building Division, School of Technology, Kolej Tunku Abdul Rahman, Kuala Lumpur 53300, Malaysia
2. Research Management & Innovation Centre, Universiti Tun Hussein Onn Malaysia, Parit Raja 86400, Johor, Malaysia 3. Construction Research Institute of Malaysia (CREAM), CIDB Malaysia, Kuala Lumpur55200, Malaysia
Abstract: This paper, based on Deming’s quality management (QM) theory embodied in ISO 9001, uses structural equation modelling
(SEM) in a construction management research. Based on 100 usable responses collected from a nationwide survey carried out from 14th
February to 30th May 2008 on all key players in the Malaysian construction value chain, this paper aims to: (a) validate the dimensions
of registration efforts to obtain and maintain ISO 9001 certifications; (b) validate the eight QM principles in ISO 9001 for quality management system (QMS) practices; (c) determine the components of organisational improvements experienced as a result of ISO 9001 certifications in terms of company competitiveness, customer satisfaction, and business performance; and (d) investigate the causal relationships among registration efforts, QMS practices, company competitiveness, customer satisfaction, business performance of ISO 9001–certified companies. The knowledge gained from the application of SEM is an important contribution to the body of theoretical literature in QM.
Key words: Causal relationships, ISO 9001, quality management system, registration efforts, structural equation modelling.
1. Introduction
There is a notable lack of literature on research methodology for construction [1, 2]. As a result, construction management research is frequently challenged in terms of its theoretical underpinnings [3]. Therefore, effective construction research requires proper application of social science research methods. To increase the ability to draw credible and convincing conclusions from their empirical research, six principles of appropriate research methodology have been suggested for construction researchers [4]. These are appropriate mixture of research approaches, explicit definitions of terms and concepts, careful measurement of theoretical concepts, explicit statements of hypothesised causal relationships, proper statistical analysis, and proper research design. Construction researchers will then be able to increase the likelihood that their research will make a
Corresponding author: Sia Mal Kong, program supervisor,
senior lecturer, research fields: quality management, service quality. E-mail: [email protected].
meaningful contribution to the literature. Only by use of appropriate methodologies and research methods, and their rigorous applications, can the body of knowledge for construction be established and advanced with confidence [1].
in Emerald e-journals produced only two articles related to construction [7, 8]. Whereas a search in Gale databases produced only one abstract related to construction [9].
The application of SEM in construction management research is increasing slowly. SEM is used to describe and quantify the fundamental factors that affect contract disputes between owners and contractors in the construction industry [5]. It is used to examine the relationship between the safety climate and safe work behaviour in construction site environments [10], and the modelling of international technology transfer in Thai construction projects [11]. SEM has also been used in the development and empirical testing of a structural equation model of construction safety culture [8, 12], and in the study of influence of psychological climate on safety behaviour in construction industry [13]. As a statistical software, SEM is used in the four-phase study on IT enhanced communication protocols for building project management by small and medium enterprises in the Indian construction industry [14], and the effect of project characteristics on project performance in construction projects [15].
2. Literature Review
The first academic paper on TQM (total quality management) in Malaysia [16], published in journal of international status, attempted to capture the thinking and development of TQM [17]. This paper presented the findings carried out by the Japan International Cooperation Agency, the approaches to QM (quality management) adopted by the Malaysian SMIs (Small and Medium Industries), the key elements of TQM philosophy, and the SIRIMEX Excellence model practised by Malaysian companies to improve customer satisfaction through TQM. It was mentioned then that very few textbooks or reference works on QM were written, thereby obstructing its promotion [16]. The lack of coverage on quality-related research was echoed by [17] as not much has been written and published internationally about TQM as practised in
Malaysian construction industry [20]. Moreover, the lack of theory and research in QM warrants the study of QM as a valid topic for research in order to increase its existing body of knowledge [23].
The ISO 9000 family of standards, first issued by the International Organisation for Standardisation (ISO) as a quality assurance standard in 1987, has been revised in 1994 and upgraded to become a standard for QMS in December 2000 [24]. In November 2008, it was revised again. The eight QM principles and the five clauses for ISO 9001 certification remain intact in the ISO 9001: 2008 version [25]. Though ISO 9000: 2000 borrows heavily from TQM, there is no specific acknowledgement of this [26]. No empirical research has been carried out so far to validate the eight QM principles of ISO 9000: 2000 even though TQM has been extensively investigated. It has been proposed that future research to examine ISO 9000: 2000 might involve the development and testing of model concerning the systematic and effective implementation of ISO 9001: 2000 [27]. It has also been recommended that the research on the relationships among ISO 9000: 1994 registration efforts, TQM practices, organisational competitiveness, customer satisfaction and business performance be replicated in other industries or even in other countries [28].
Application of the eight QM principles in ISO 9001:2000 standard provides potential benefits as given in ISO 9004: 2000 [29], and contributes to managing costs and risks, which are important considerations for the overall performance of an organisation. These considerations may impact, among others, customer loyalty, repeat business and referral, operational results such as revenue and market share, flexible and fast responses to market opportunities, and competitive advantage through improved organisational capabilities. To improve productivity and quality in the Malaysian construction industry, Construction Industry Development Board (CIDB) Malaysia is actively promoting the adoption of ISO
9000: 2000 [30]. All players within the construction industry, especially the G7 contractors, are encouraged to adopt the ISO 9001 standard as a QMS. It is claimed that effective implementation of ISO 9001 standard would result in improved client’s satisfaction, increased profitability and shareholder’s value, increased competitiveness and improved motivation to the workforce [30].
To address the gaps revealed above and to confirm the contentions made by IS 9000 family of standards and CIDB Malaysia, the model proposed by [28, 31] is adapted to investigate the causal relationships among ISO 9001:2000 registration efforts, QMS practices in ISO 9000: 2000 family of standards, company competitiveness, customer satisfaction and business performance of ISO 9001-certified companies in the Malaysian construction industry. Using AMOS 16.0 as a structural equation modelling software, this paper also aims:
(1) to investigate the dimensions of registration efforts to obtain and maintain ISO 9001 certifications;
(2) to validate the eight quality management principles in ISO 9000: 2000 family of standards as constructs for quality management system practices; and
(3) to investigate the components of organisational improvements experienced as a result of ISO 9000 certifications in terms of company competitiveness, customer satisfaction, and business performance of the company.
manufacturing companies in the United States [28, 31]. The competitiveness model to measure competitive- ness in construction industry [37], consisting of competitive assets or resources, competitive processes and competitive performance, is adapted to measure the company competitiveness construct. With this reclassification, competitive processes and competitive performance encompass operational results, and competitive assets encompass results related to workers.
Review of extant literature reveals that causal relationships exist between motivations for accreditation and benefits of ISO 9001 certification [38-40]. To explain the causal relationship between ISO 9001 certification and improved business performance, Ref. [41] proposes a causal model of improvement, arising from accreditation to ISO 9001 to improved business performance. Various conceptual models have also been proposed by other researchers to investigate the causal effects of ISO 9001 certifications on business performance by SEM [27, 28, 31, 42-47].
3. Methodology
Ref. [48] proposes a 6-stage process for SEM. This is incorporated into the research process shown in Fig. 1 to investigate the causal effects of ISO 9001 registration efforts on business performance of ISO9001-certified companies in the Malaysian construction industry.
Fig. 1 The research process [49].
3.1 Theory
A strong theoretical base is necessary for SEM analyses [48]. ISO 9000: 2000 family of standards is formulated based on the accumulated knowledge and collective experience of quality experts with Deming’s QM theory encapsulated. The process-based QMS of ISO 9000, shown in Fig. 2 with the eight QM principles incorporated [50], is based on four parts: management responsibility; resource management; product realisation; and measurement, analysis and improvement. It is structured in theory around the Deming loop (the “Plan-Do-Check-Act” or PDCA model) [51]. Thus, Deming’s PDCA cycle is the operating principle of ISO 9000 family of standards [52].
Due to the requirements to attain and maintain certifications, ISO 9001-certified companies are recommended to practise the eight QM principles. As a result of time sequence effect [53], there are indications that the registration efforts taken for ISO 9001 certification are causes of the eight QM principles being practised in ISO 9001-certified companies, in addition to the consequential benefits or improvements, namely, company competitiveness, customer satisfaction and business performance. Five constructs, which are facets of the ISO 9001 standard, are thus identified in the causal relationships. They are registration efforts, QMS practices, company competitiveness, customer satisfaction and business performance. Hypotheses in the form of relationships among the five constructs are deduced.
3.1.1 Conditions for Causality
In order to establish the causal relationships among the five latent constructs through SEM, four types of evidence are needed [6, 48] for the quantitative data collected from questionnaire survey. They are: (a) co-variation; (b) time sequence effect; (c) non-spurious relationship between the constructs; and (d) theoretical support for the relationship between the cause and effect.
Selection of respondents or participants Theory
Hypotheses
Operationalisation of concepts
Survey design
Collect data
Analyse data
[image:4.595.80.262.464.715.2]
Fig. 2 ISO 9001 process-based model of QMS with eight QM principles incorporated.
Fig. 3 Conceptual structural model. Source: [28, 31].
3.2 Hypotheses
To illustrate the causal relationships among the five constructs, the structural model shown in Fig. 3 is adopted and subjected to empirical evidence collected from questionnaire survey. The causal relationships, depicted by arrows, are investigated by using AMOS 16.0 of SPSS. There are ten arrows in the path diagram, representing the ten hypotheses to be tested in this research.
3.2.1 Theoretical Supports
The theoretical bases of the relationships among the five latent constructs are summarised below. A number of studies have revealed that ISO 9001 registration efforts have significant positive relationship with QMS practices [28, 31, 54], enhance company competitiveness [28, 55], have significant positive effect on customer satisfaction [56], and enhance business performance [57-59]. There is also a significant positive relationship between QMS practices and company competitiveness [28, 60, 61], between QMS practices and customer satisfaction [42, H9
QMS Practices
Customer Satisfaction Company
Competitiveness
ISO 9001 Registration
Efforts
Business Performance H1
H2 H7
H4 H3 H5
H8 H6
H10
Measurement, analysis and improvement Resource
management
Management responsibility
Product Input
Continuous Improvement of the Quality Management System
Product
Realisation Output
Factual approach to Decision Making Continual Improvement
Involvement of People
Process Approach
System Approach to Management Leadership
Mutual Beneficial
Supplier Relationships
Cus
tomer
s
atis
fact
ion
Cus
tomer fo
cus
Custome
r
requ
irem
ents
Custome
r f
oc
[image:5.595.75.534.93.394.2]
62], and between QMS practices and business performance [63]. Similarly, company competitiveness has significant positive effect on customer satisfaction [28], and enhances business performance [64, 65]. Finally, customer satisfaction is also found to enhance business performance [28, 66].
3.3 Conceptualisation of Variables
SEM consists of two components: firstly, a measurement model linking a set of observed variables to a usually smaller set of latent constructs; and secondly, a structural model linking the latent constructs through a series of recursive relationships. To verify a structural model, two conditions must be met [53], namely, the constructs must be defined conceptually, and the constructs must be defined operationally through a measurement instrument. The registration efforts are operationalised by using the five clauses in ISO 9001:2000 for accreditation. The QMS practices are operationalised by using the eight QM principles which form the basis of the ISO 9000: 2000 family of standards. According to [48], theory is the ultimate criterion in deciding to form the measurement models for the five latent constructs.
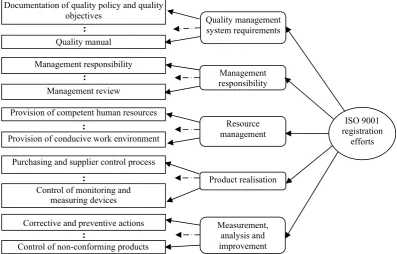
3.3.1 Measurement Model for Registration Efforts Construct
A set of minimum requirements for accreditation is specified a priori in ISO 9001 standard. Therefore, the ISO 9001 standard contains measurement items that cover all aspects of the registration efforts to be measured. It is hypothesised that the ISO 9001 registration efforts construct is explained by the five clauses for accreditation. Registration efforts construct is thus a second-order measurement model, as shown in Fig. 4, consisting of one second-order factor and five first-order factors which are measured by 29 observed variables extracted directly from ISO 9001:2000. The five clauses for accreditation of ISO 9001:2000 QMS are termed the first-order factors. These five first-order factors indicate a second-order factor, namely registration efforts. The factor structure of registration
efforts construct will be identified by exploratory factor analysis (EFA) and the measurement model will be confirmed through confirmatory factor analysis (CFA) from the dataset collected through questionnaire survey.
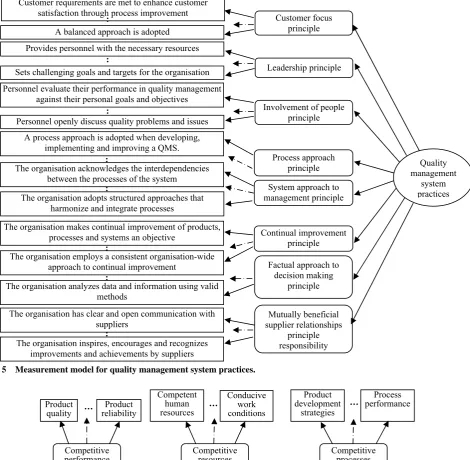
3.3.2 Measurement Model for QMS Practices Construct
Eight QM principles are specified a priori in the ISO 9000 family of standards for QMS practices. As they are integrated into the clauses in ISO 9004 standard, the ISO 9000 family of standards has measurement items that cover all aspects of the QMS practices to be measured [56]. It is hypothesised that the QMS practices construct is explained by the eight QM principles. QMS practices construct is thus a second-order measurement model, as shown in Fig. 5, consisting of one second-order factor and eight first-order factors which are measured by 56 observed variables extracted directly from the ISO 9000: 2000 family of standards. The eight QM principles are termed first-order factors. These eight first-order factors indicate a second-order factor, namely QMS practices. The factor structure of QMS practices construct will be identified by EFA and the measurement model will be confirmed through CFA from the dataset collected through questionnaire survey.
3.3.3 Measurement Model for Company Competitiveness Construct
Fig. 4 Measurement model for registration efforts construct.
Fig. 6, consisting of one second-order factor and three first-order factors which are measured by 18 observed variables identified and selected through literature review [29, 37, 67]. The three facets for company competitiveness are termed first-order factors. These three first-order factors indicate a second-order factor, namely company competitiveness. The factor structure of company competitiveness construct will be identified by EFA and the measurement model will be confirmed through CFA from the dataset collected through questionnaire survey.
3.3.4 Measurement Model for Customer Satisfaction Construct
It is hypothesised that the customer satisfaction construct is explained by five observed variables identified and selected from literature review [28-29, 42]. Customer satisfaction construct is thus a first-order measurement model, as shown in Fig. 7, consisting of one first-order factor which is measured by five observed variables. The factor structure of customer satisfaction construct will be identified by EFA and the measurement model will be confirmed through CFA from the dataset collected through questionnaire survey.
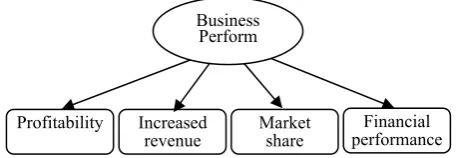
3.3.5 Measurement Model for Business Performance Construct
It is hypothesised that the business performance construct is explained by four observed variables identified and selected from literature review [21, 28, 42]. Business performance construct is thus a first-order measurement model, as shown in Fig. 8, consisting of one first-order factor which is measured by five observed variables. The factor structure of business performance construct will be identified by EFA and the measurement model will be confirmed through CFA from the dataset collected through questionnaire survey.
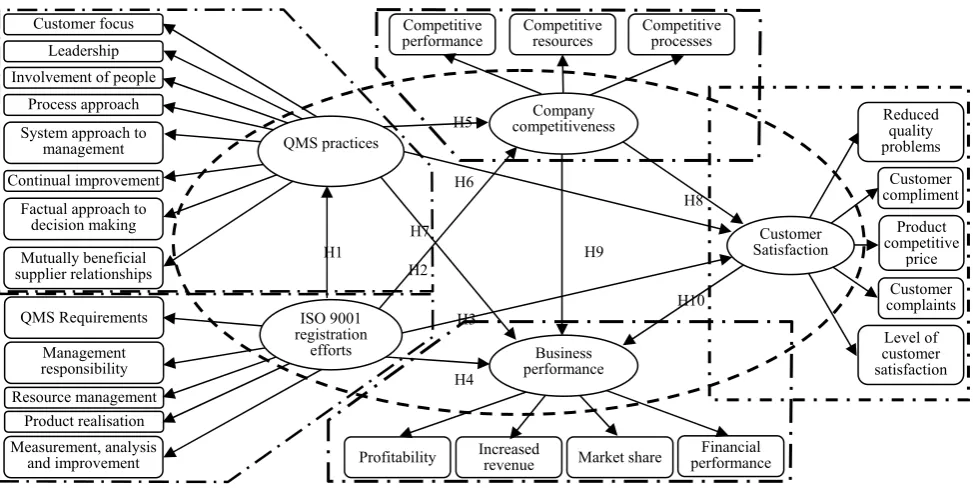
3.3.6 Structural Model
Fig. 9 is the full structural model obtained by incorporating the measurement models for registration efforts, QMS practices, company competitiveness, customer satisfaction and business performance into Fig. 3. In SEM, the latent constructs are indicated by ovals. The observed variables are indicated by rectangles, and the causal relationships are represented by arrows. Due to space constraints, the observed variables for registration efforts, QMS practices and
Management responsibility
Resource management
Product realisation
Measurement, analysis and improvement Quality management system requirements
ISO 9001 registration
efforts Documentation of quality policy and quality
objectives
Quality manual :
Management responsibility
Management review :
Provision of competent human resources
Provision of conducive work environment :
Purchasing and supplier control process
Control of monitoring and measuring devices
:
Corrective and preventive actions
[image:7.595.110.508.101.355.2]
Fig. 5 Measurement model for quality management system practices.
Fig. 6 Measurement model for company competitiveness construct.
company competitiveness constructs are not shown. Using goodness-of-fit indices, the fit of the structural model with the raw dataset collected from questionnaire survey will be determined by SEM 3.3.7 Goodness of Fit (GOF) Indices.
The measurement and structural models are evaluated by the chi-square significance tests supplemented by other GOF indices [48], including: (a) the χ2 value at p > 0.05 and the associated degree of freedom df, with χ2/df ≤ 3; (b) one absolute fit index
Product
quality reliability Product
Competent human resources
Conducive work conditions
Process performance Product
development strategies
… …
…
Competitive
resources Competitive processes Competitive
performance
Company competitiveness
Customer focus principle
Process approach principle
System approach to management principle
Continual improvement principle
Factual approach to decision making
principle Involvement of people
principle Leadership principle
Mutually beneficial supplier relationships
principle responsibility Personnel evaluate their performance in quality management
against their personal goals and objectives
A process approach is adopted when developing, implementing and improving a QMS.
The organisation acknowledges the interdependencies between the processes of the system Personnel openly discuss quality problems and issues
:
: :
Customer requirements are met to enhance customer satisfaction through process improvement
The organisation analyzes data and information using valid methods
The organisation has clear and open communication with suppliers
The organisation makes continual improvement of products, processes and systems an objective
The organisation employs a consistent organisation-wide approach to continual improvement
A balanced approach is adopted
:
Provides personnel with the necessary resources
Sets challenging goals and targets for the organisation
The organisation adopts structured approaches that harmonize and integrate processes
:
The organisation inspires, encourages and recognizes improvements and achievements by suppliers
:
: :
Quality management
[image:8.595.72.543.105.565.2][image:9.595.140.471.97.194.2]
Fig. 7 Measurement model for customer satisfaction construct.
Fig. 8 Measurement model for business performance construct.
such as RMSEA ≤ 0.06; (c) one incremental fit such as TLI > 0.95 or CFI > 0.95; (d) one GOF index such as TLI > 0.95 or CFI > 0.95; and (e) one badness-of-fit index such as RMSEA ≤ 0.06. In the report on the GOF statistics for each measurement model being analysed, Cronbach’s α is determined to show the internal reliability of the measurement scale used in the survey questionnaire; and standardised loadings weights, which measure item loadings on each construct, are also included to show the convergent validity of the construct. A minimum value of 0.5 has been suggested [48, 68]. In SEM, because the specified model represents the theoretical expectations about the data structure, the null hypothesis is that the model fits the data [28]. Therefore, SEM models can never be accepted, they can only fail to be rejected.
3.4 Research Design
To operationalise the variables, a questionnaire is developed to collect quantitative data in order to assess the conceptualised research variables used for testing the research hypotheses. Based on the premise that ISO 9001: 2000 is a model for QMS, the eight QM principles embedded in it are used to develop a questionnaire to measure the practice of ISO 9001 in
ISO 9001-certified companies. Based on the five clauses for accreditation, the questionnaire being developed contains also items to measure the amount of registration efforts put in by companies to obtain and maintain ISO 9001 certifications. The questionnaire also requests respondents to indicate the improvements experienced by companies as a result of ISO 9001 certifications, in terms of customer satisfaction, company competitiveness, and business performance. Five-point Likert-type ordinal scales are used.
The population of this study is the ISO 9001-certified companies within the construction value chain in the Malaysian construction industry, irrespective of their scope of registrations as ISO 9001 is a generic standard for all industries. The key respondent of the research is chosen to be the “person to contact” as listed in the CIDB Malaysia directory, or QM representative, managing director, director, or general manager of the ISO 9001-certified companies since these key personnel are expected to be the most knowledgeable people who are involved with the QMS of the company. From 14th February to 30th May 2008, a total of 456 questionnaires were sent out. Out of the 338 ISO 9001-certified contractors which were registered with CIDB Malaysia as at 14th April 2008, a total of 303 contractors were identified. They are mainly Grade 7 contractors. Care was taken so that no multiple sets of survey questionnaire were sent to companies registered under the same address or in the same group of companies. The remainder was trawled from the search engine Google. The target population nearly represents all the ISO 9001-certified companies in the Malaysian construction industry as at 14th April
Customer complaints Customer
compliment Reduced
quality problems
Level of customer satisfaction Product
competitive price Customer satisfaction
Increased
revenue performanceFinancial Profitability Market
share Business
[image:9.595.59.288.222.301.2]
Fig. 9 Structural model of causal relationships with five measurement models for registration efforts, QMS practices, company competitiveness, customer satisfaction and business performance constructs.
Table 1 Details of questionnaire survey.
Locations Peninsular Malaysia, Sabah and Sarawak
Number of questionnaires returned unanswered 12 Telephone calls received on non-certification status 2 CIDB malaysia directory Contractors of all trades 303 Contractors and developers 99 Civil and structural engineering firms 28 Quantity surveying firms 17 ISO 9001-
Certified
Companies Trawled from Google
Architectural firms 9
Number of questionnaires received 108
Incomplete questionnaires 8
Useable questionnaires for data analysis 100
2008. Table 1 gives the full details of the survey. 100 usable questionnaires were received, which is considered acceptable for SEM [48, 69].
3.5 Validation of Survey Questionnaire
To successfully bridge the conceptual and operational domains, it is necessary to examine the validity and reliability of the questionnaire to ensure that the questionnaire is really capable of providing accurate and meaningful answers to the research questions raised in the study [70]. Three types of validity are considered in this research: content,
construct and convergent validity. It is necessary to establish the unidimensionality and reliability of the scales before their convergent validity and discriminant validity are assessed [71].
(1) Content validity: The questionnaire used in the formal survey has strong content validity as it is developed based on scales from prior research [48], such as the questionnaire in [72], the questionnaire in [32], the questionnaire in [28], and the recommend- ations in the ISO 9000 family of standards. A pilot survey was carried out to avoid ambiguity in instructions and poorly prepared questions in the H1
H2 H7
H4 H3 H5
H9
H8 H6
H10 complaintsCustomer Customer compliment Reduced
quality problems
Level of customer satisfaction
Product competitive
price
Increased
revenue performance Financial Profitability Market share
Competitive
resources Competitive processes Competitive
performance Customer focus
Leadership Involvement of people
Process approach System approach to
management
Continual improvement Factual approach to
decision making
Mutually beneficial supplier relationships
Management responsibility Resource management
Product realisation Measurement, analysis
and improvement QMS Requirements
Company competitiveness
ISO 9001 registration
efforts Business performance
[image:10.595.55.542.385.533.2]
questionnaire for formal survey. The questionnaire for formal survey has also been forwarded to the Mian and Co-Supervisors for their expert comments and opinions.
(2) Reliability: Cronbach’s Coefficient Alpha is the most widely and commonly method used for assessing the reliability of a measurement scale with multi-point items. According to [69], reliability coefficients around 0.90 can be considered as excellent, values around 0.80 as very good, and values around 0.70 as adequate; those below 0.50 should be avoided or improved before use in research. The minimum generally acceptable Alpha value is 0.70 [73].
(3) Unidimensionality: To establish the unidimensionality of the measurement scale, an exploratory factor analysis using principal component extraction with a varimax rotation is performed separately for each latent construct [39]. Evidence of unidimensionality of each construct include appropriate items with a loading of at least 0.50 on their respective hypothesised components and with a loading not exceeding 0.30 on other components in the factor analysis [74]. In this paper, the criteria for factor purification and improvement [75] are: (a) a factor loading of +0.50 or greater is chosen as the cut-off; and (b) variables with cross loadings of 0.40 or greater are eliminated.
(4) Construct validity: To achieve construct validity, the measurement should demonstrate convergent validity and discriminant validity. For convergent validity, the items purporting to measure the same construct should correlate positively with one another. A test of the factor loading of each item can be used to assess convergent validity [44], where items are expected to have standardised loadings greater than 0.70, implying that the indicators share more variance with their respective latent variables than with error variance. However, this guideline may be readjusted to higher or lower values depending on the research area. A minimum value of 0.5 has been suggested [68, 76].
To address the discriminant validity, the unconstrained structural model is compared with the
constrained models [28]. In the final unconstrained structural model, the correlation between all the ten paths of the five latent constructs is allowed to vary. In the constrained models, the structural paths for each one of the constructs are eliminated separately, thus allowing a test of each construct’s importance to the model. This is similar to eliminating separately the measurement model for each one of the latent constructs from the structural model. In this paper, the importance of each construct to the model is tested by eliminating separately the measurement model for each latent construct from the structural model. The chi-square value for the unconstrained model is then compared to the chi-square values for the other four constrained models. If the chi-square value for the unconstrained model is significantly different from the chi-square values for each of the four constrained models, than each construct is a necessary component of the full model. According to [28], the discriminant validity for company competitiveness, customer satisfaction and business performance constructs should be examined too. For this paper, these three constructs are not correlated as they are obtained from exploratory and confirmatory factor analyses. Therefore, test for discriminant validity for these three constructs is not necessary.
4. Results and Data Analyses
4.1 Descriptive Statistics
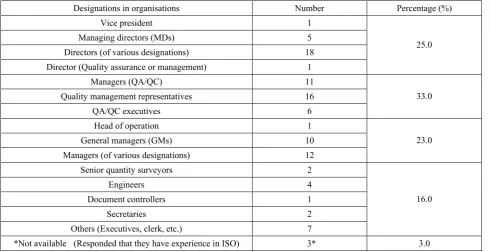
The designations of respondents in their organisations are given in Table 2. 25% of the respondents are directors or of higher designations, 33% are managers, QM representatives or QA/QC executives who are directly involved with the QMSs, and 23% are in the managerial or higher positions. From these percentages, it appears that the management of these companies places a high emphasis on the ISO 9001 certifications in their organisations.
Table 2 Designations of respondents in their organisations.
Designations in organisations Number Percentage (%)
Vice president 1
Managing directors (MDs) 5
Directors (of various designations) 18 Director (Quality assurance or management) 1
25.0
Managers (QA/QC) 11
Quality management representatives 16
QA/QC executives 6
33.0
Head of operation 1
General managers (GMs) 10
Managers (of various designations) 12
23.0
Senior quantity surveyors 2
Engineers 4
Document controllers 1
Secretaries 2 Others (Executives, clerk, etc.) 7
16.0
*Not available (Responded that they have experience in ISO) 3* 3.0
* The respondents highlighted that their organisations are ISO 9001-certified, but the names of the organisations were not mentioned.
The data collected are screened before they are analysed. The process is an integral part of any multivariate analysis, and is fundamental to an honest analysis of the data [68], as careful analysis of data will lead to better prediction and more accurate assessment of dimensionality [76]. Cases with missing data are not rejected. Instead, the missing data are replaced with the means [28] for further confirmatory factor analysis. This is because dropping incomplete cases could result in sacrificing information from the sample and could lead to biased estimates when the data were not missing completely at random [77].
4.2.1 Checking Research Assumptions
Four key assumptions must be met to use SEM. They are:
(1) Independence of observations: Since the data is cross-sectional in nature and individual respondents complete the questionnaires independently within a four-month period, a time-ordered effect does not exist [56]. The assumption that each predictor variable is independent is not violated. The observations are
independent as the survey is individually administered [59].
[image:12.595.56.547.107.359.2]
(3) Absence of outliers: Assessments of univariate outliers are performed through SPSS DESCRIPTIVES, where the data values of each variable are converted to standard z scores. For this research, the z scores of ±3.29 are selected, which represents one chance in a million [68]. For multivariate outliers, a critical χ2 value with degrees of freedom equal to the number of independent variables and a probability of p < 0.001 is compared [68]. Though outliers are detected, the data values of these outliers were retained for further analyses as excluding them will affect generalisability to the population of this study. The presence of multivariate outliers is examined during the assessments of second-order measurement models and structural model for this research. There is one multivariate outlier, with its mahalanobis distance-squared just slightly above the critical value. The case is not deleted as it is a segment of the same population. It is retained to ensure generalisability of the entire population.
(4) Linearity: The causal relationships among the latent constructs shown in Fig. 3 are assumed to be linear [76]. According to [68], if there is multivariate normality in ungrouped data, then each variable is itself normally distributed and the relationships between pairs of variables, if present, are linear and homoscedastic.
4.2.2 Exploratory Factor Analysis (EFA)
The first component in SEM is specification of the measurement model, which is concerned with the confirmation of indicators that define each latent construct. This can be performed by a two-step approach [71]. First, EFA is conducted to assess the underlying factor structure of the scaled items. Subsequently, CFA is performed to confirm the indicators which load onto each identified factor. The goodness-of fit measures are the major criteria to test the hypothesised model. Absolute fit measures are used to determine the degree to which the measurement models and hypothesised model fit the sample dataset collected. EFA is used to determine the factor
structures of QMS practices and registration efforts in ISO 9001, and company competitiveness. ISO 9001 family of standards specify a priori eight QM principles and five clauses for registration purposes. Using Kaiser’s criterion, only components with eigenvalues of more than 1.0 are selected for further confirmatory factor analysis [28, 59]. Varimax orthogonal rotation is used to determine the pattern of loadings for easy interpretation, which assumes that the variables are not correlated and helps to maximize the variance of factor loadings by making high scores higher and minimizing the low ones. Items that load higher than 0.4 are retained. Missing values are replaced by means for analysis. The following criteria are used for factor purification and improvement: (a) a factor loading of +0.50 or greater is chosen as the cut-off, and (b) variables with cross loadings of 0.40 or greater are eliminated [59].
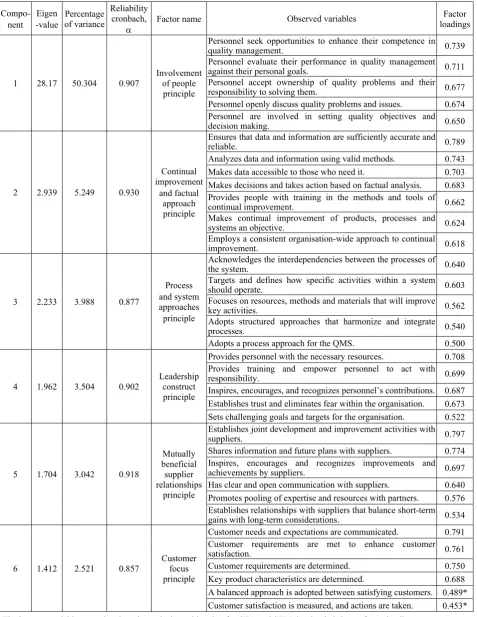
(1) Factor structure of QMS practices construct: Using principal component analysis with varimax orthogonal rotation, ten components are initially extracted. Factor purification and improvement are then carried out, where components with only one loaded variable were rejected, observed variables which cross-loaded on more than one component are also rejected, and the observed variables for leadership principle which loaded on three components are forced to load on one component. EFA is carried out again to extract six factors only. The names of the six components, their factor loadings, percentage of variance and reliability of each component are given in Table 3, showing that the eight QM principles are clearly in existent as mentioned in the ISO 9000 family of standards, with process approach principle and system approach to management principle loaded together as one component, and continual improvement principle and factual approach to decision making principle loaded together on another component.
analysis with varimax orthogonal rotation. The names of the five components, their factor loadings, percentages of variance and reliability of each component are given in Table 4, showing clearly that five factors are present in the process-based model of ISO 9001 standard.
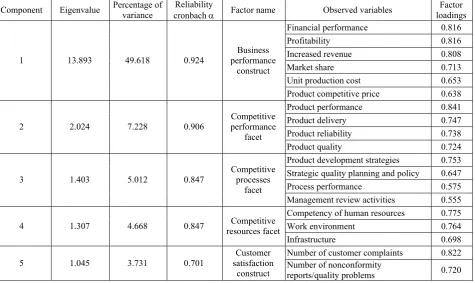
(3) Factor structure of company competitiveness construct: EFA is carried out to determine the factor structure of the observed variables used to assess organisational improvements in the questionnaire. Five components are identified, with three components for company competitiveness construct, one component for customer satisfaction, and one component for business performance. The names of the five components, their factor loadings, percentages of variance and reliability of each component are given in Table 5, showing clearly that there are three facets in the competitiveness model [37]. From the percentage of variance, it is found that business performance is the main factor of organisational improvements experienced as a result of ISO 9001 certifications.
4.2.3 Confirmatory Factor Analysis (CFA)
Based on the components extracted from EFA, AMOS 16.0 is used to carry out CFA to assess the fit of the measurement models to the empirical dataset. Assessments of model fit for the following are conducted, namely: (a) first-order measurement models for each of the five components for registration efforts construct with their respective observed variables, and the second-order measurement model for registration efforts constructed from the five components for registration; (b) first-order measurement models for each of the six components of QMS practices construct with their respective observed variable and the second-order measurement model for QMS practices constructed from the six components; (c) first-order measurement models for each of the three facets of company competitiveness construct with their respective observed variables, and the second- order measurement model for company competitiveness constructed from the three facets; (d)
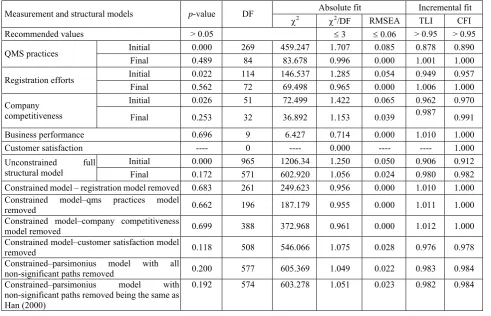
first-order measurement model for customer satisfaction construct with its observed variables; and (e) first-order measurement model for business performance construct with its observed variables. The measurement models are then combined to form the hypothesised model to assess the fit of the structural model to the empirical dataset. Table 6 summarizes the GOF statistics for the second-order measurement models.
4.2.4 Structural Equation Modelling
The initial structural model for this research is constructed from the three second-order measurement models for QMS construct, registration efforts construct and company competitiveness construct; and the two first-order measurement models for business performance and customer satisfaction constructs. The initial model does not fit well because its probability level is significant at 0.000 (< 0.05). Moreover, due to the occurrence of a standardised coefficient exceeding 1.0 between company competitiveness and business performance constructs, the offending estimate needs to be fixed at 1.0 [28]. The model is evaluated again by looking at the modification indices to remove constraints on certain model parameters in order to improve the overall model fit [77]. The final structural model fits well. The χ2 test yields a value of 1.056 (≤ 3) [69], when evaluated with 571 degrees of freedom, has a corresponding p-value of 0.172. This p-value is too high to reject the null hypothesis of a good fit [77]. Corroborating evidence is provided by the RMSEA fit statistic- the obtained value of 0.024 is well below the desired 0.06 cut-off. Similarly the Tucker-Lewis index (TLI) of 0.98 and comparative fit index (CFI) of 0.982 are above the 0.95 threshold. These tests suggest that the model is a good fit to the data. These results are shown in Table 6. The proportion of variance that is explained in business performance is 0.56, in company competitiveness is 0.62, in customer satisfaction is 0.36, and in QMS practices is 0.58.
4.2.5 Testing of Hypotheses
Table 3 Factor structure for QMS practices construct.
Compo- nent
Eigen -value
Percentage of variance
Reliability cronbach,
α Factor name
Observed variables Factor loadings Personnel seek opportunities to enhance their competence in
quality management. 0.739
Personnel evaluate their performance in quality management
against their personal goals. 0.711
Personnel accept ownership of quality problems and their responsibility to solving them. 0.677 Personnel openly discuss quality problems and issues. 0.674 1 28.17 50.304 0.907
Involvement of people
principle
Personnel are involved in setting quality objectives and
decision making. 0.650
Ensures that data and information are sufficiently accurate and
reliable. 0.789
Analyzes data and information using valid methods. 0.743 Makes data accessible to those who need it. 0.703 Makes decisions and takes action based on factual analysis. 0.683 Provides people with training in the methods and tools of
continual improvement. 0.662
Makes continual improvement of products, processes and
systems an objective. 0.624
2 2.939 5.249 0.930
Continual improvement
and factual approach principle
Employs a consistent organisation-wide approach to continual
improvement. 0.618
Acknowledges the interdependencies between the processes of
the system. 0.640
Targets and defines how specific activities within a system
should operate. 0.603
Focuses on resources, methods and materials that will improve
key activities. 0.562
Adopts structured approaches that harmonize and integrate
processes. 0.540
3 2.233 3.988 0.877
Process and system approaches
principle
Adopts a process approach for the QMS. 0.500 Provides personnel with the necessary resources. 0.708 Provides training and empower personnel to act with
responsibility. 0.699
Inspires, encourages, and recognizes personnel’s contributions. 0.687 Establishes trust and eliminates fear within the organisation. 0.673 4 1.962 3.504 0.902 Leadership construct
principle
Sets challenging goals and targets for the organisation. 0.522 Establishes joint development and improvement activities with
suppliers. 0.797
Shares information and future plans with suppliers. 0.774 Inspires, encourages and recognizes improvements and
achievements by suppliers. 0.697
Has clear and open communication with suppliers. 0.640 Promotes pooling of expertise and resources with partners. 0.576 5 1.704 3.042 0.918
Mutually beneficial supplier relationships
principle
Establishes relationships with suppliers that balance short-term gains with long-term considerations. 0.534 Customer needs and expectations are communicated. 0.791 Customer requirements are met to enhance customer
satisfaction. 0.761
Customer requirements are determined. 0.750 Key product characteristics are determined. 0.688 A balanced approach is adopted between satisfying customers. 0.489* 6 1.412 2.521 0.857
Customer focus principle
[image:15.595.61.539.106.724.2]
Table 4 Factor structure for registration efforts construct.
Component Eigenvalue of variance Percentage
Reliability cronbach
coefficient, α Factor name Observed variables
Factor loadings Determination and review of requirements related to
product 0.740
Provision of conducive work environment to achieve
product conformance 0.727
Planning of product realization 0.722 Collection of data and information 0.706 Provision of adequate infrastructure to achieve product
conformance 0.672
Customer focus 0.624
Customer communication 0.579
Internal communication 0.539
1 13.482 46.489 0.920 managementResource
Provision of competent human resources/Training 0.526 Corrective and preventive actions 0.725
Continual improvement 0.687
2 1.715 5.914 0.802 Measurement, analysis and
improvement Monitoring and measurement of product to achieve
planned results 0.606
Quality manual 0.725
Control of monitoring and measuring devices 0.687 3 1.608 5.545 0.759 requirementsQMS
Internal audits 0.606
Purchasing and supplier control process 0.719 Control of monitoring and measuring devices 0.628 4 1.235 4.260 0.757 realizationProduct
Control of production 0.516
Design and development planning and review 0.685 5 1.056 3.642 0.522 Management
responsibility Management review 0.526
Table 5 Factor structure for company competitiveness, customer satisfaction and business performance constructs.
Component Eigenvalue Percentage of variance cronbach Reliability α Factor name Observed variables loadingsFactor Financial performance 0.816
Profitability 0.816
Increased revenue 0.808
Market share 0.713
Unit production cost 0.653
1 13.893 49.618 0.924
Business performance
construct
Product competitive price 0.638 Product performance 0.841
Product delivery 0.747
Product reliability 0.738 2 2.024 7.228 0.906 performance Competitive
facet
Product quality 0.724
Product development strategies 0.753 Strategic quality planning and policy 0.647 Process performance 0.575
3 1.403 5.012 0.847
Competitive processes
facet
Management review activities 0.555 Competency of human resources 0.775
Work environment 0.764
4 1.307 4.668 0.847 resources facetCompetitive
Infrastructure 0.698 Number of customer complaints 0.822
5 1.045 3.731 0.701
Customer satisfaction
[image:16.595.57.542.101.431.2] [image:16.595.65.541.454.737.2]
Table 6 Goodness-of-fit statistics of measurement and structural models.
Absolute fit Incremental fit Measurement and structural models p-value DF
χ2 χ2/DF RMSEA TLI CFI
Recommended values > 0.05 ≤ 3 ≤ 0.06 > 0.95 > 0.95
Initial 0.000 269 459.247 1.707 0.085 0.878 0.890 QMS practices
Final 0.489 84 83.678 0.996 0.000 1.001 1.000
Initial 0.022 114 146.537 1.285 0.054 0.949 0.957 Registration efforts
Final 0.562 72 69.498 0.965 0.000 1.006 1.000
Initial 0.026 51 72.499 1.422 0.065 0.962 0.970 Company
competitiveness Final 0.253 32 36.892 1.153 0.039 0.987 0.991
Business performance 0.696 9 6.427 0.714 0.000 1.010 1.000
Customer satisfaction ---- 0 ---- 0.000 ---- ---- 1.000
Initial 0.000 965 1206.34 1.250 0.050 0.906 0.912 Unconstrained full
structural model Final 0.172 571 602.920 1.056 0.024 0.980 0.982 Constrained model – registration model removed 0.683 261 249.623 0.956 0.000 1.010 1.000 Constrained model–qms practices model
removed 0.662 196 187.179 0.955 0.000 1.011 1.000
Constrained model–company competitiveness
model removed 0.699 388 372.968 0.961 0.000 1.012 1.000
Constrained model–customer satisfaction model
removed 0.118 508 546.066 1.075 0.028 0.976 0.978
Constrained–parsimonius model with all
non-significant paths removed 0.200 577 605.369 1.049 0.022 0.983 0.984 Constrained–parsimonius model with
non-significant paths removed being the same as Han (2000)
0.192 574 603.278 1.051 0.023 0.982 0.984
Table 7 Hypotheses testing–analysis from R-square values.
Proportion of variance explained
Models QMS
practices performance Business competitiveness Company satisfaction Customer
Final structural model 0.583 0.559 0.620 0.355
Constrained model with model for registration efforts
construct removed --- 0.563 0.605 ↓ 0.354
Constrained model with model for qms practices construct
removed --- 0.560 0.459 ↓ 0.352
Constrained model with model for company
competitiveness construct removed 0.582 0.352 ↓ --- 0.181 ↓ Constrained model with model for customer satisfaction
construct removed 0.582 0.557 0.620 ---
Parsimonius model with all non-significant paths removed 0.600 0.558 0.613 0.345 Parsimonius, non-significant paths removed being the
same as Han (2000) 0.583 0.560 0.617 0.342
Note: ↓ shows that there is a drop in the proportion of variance explained with removal of the measurement model.
first method involves R-square values and the change in R-square values when one of the measurement models is left out from the structural model [28]. The GOF statistics are shown in Table 6 and the R-square results are given in Table 7. The second method uses
[image:17.595.55.547.107.423.2] [image:17.595.58.544.442.635.2]
Table 8 Hypotheses testing–analysis from standardised regression weights.
Hypotheses Parsimonious model(1) Full Unconstrained model
0.763*** 0.764*** H1: ISO 9001 registration efforts enhance quality management
system practices Supported
0.211ns 0.208ns
H2: ISO 9001 registration efforts enhance company
competitiveness Not supported
--- 0.050ns
H3: ISO 9001 registration efforts enhance customer
satisfaction Not supported
– 0.033ns – 0.059ns H4: ISO 9001 registration efforts enhance company business
performance Not supported
0.613*** 0.618***
H5: Quality management system practices of ISO 9000 family
of standards enhance company competitiveness Supported
--- – 0.122ns H6: Quality management system practices enhance customer
satisfaction Not supported
--- 0.037ns H7: Quality management system practices enhance business
performance Not supported
0.585*** 0.653**
H8: Company competitiveness enhances customer satisfaction
Supported
0.738*** 0.731***
H9: Company competitiveness enhances company business
performance Supported
0.052ns 0.044ns
H10: Customer satisfaction enhances company business
performance Not supported
(1) Non-significant paths being removed in the parsimonius model were the same as that in Han (2000) ns Not-significant; ***
Significance level at p < 0.001; ** Significance level at p < 0.01
structural relationships among the latent constructs. The results are given in Table 8. From Table 7 and Table 8, this empirical research supports the following hypotheses: (a) H1: registration efforts enhance QMS practices, (b) H5: QMS practices enhance company competitiveness, (c) H8: company competitiveness enhances customer satisfaction, and (d) H9: company competitiveness enhances business performance. The other six hypotheses are not supported, as the causal relationships indicated by the arrows are not significant. This is confirmed by hypotheses testing using parsimonius model with all the non-significant paths removed (see Table 6), as the difference between its chi-square value with that of unconstrained final structural model is not significant [28, 31].
5. Conclusions
This research has successfully evaluated the research objectives set out earlier, namely:
(1) to classify the benefits gained into three categories, namely, company competitiveness, customer satisfaction and business performance; and
(2) to investigate the causal relationships among registrations efforts taken for ISO 9001 certification, quality management system practices, company competitiveness, customer satisfaction and business performance of ISO 9001-certified companies.
The findings from structural equation modelling reveal the following:
(1) The existence of three components of orgainsational improvement experienced by ISO 9001- certified companies in the Malaysian construction industry.
[image:18.595.59.539.106.392.2]
orthogonal components representing the five clauses for accreditation of ISO 9001 certifications.
(3) The factor structure of company competitiveness construct: From CFA, there appear to be three orthogonal components for company competitiveness construct.
The empirical results from structural equation modelling confirm:
(1) that registration efforts for ISO 9001 certifications enhance the practices of QMS embedded in ISO 9001; and QMS practices enhance company competetiveness, which in turn enhances customer satisfaction and business performance,
(2) the claim made in ISO 9000 family of standards that the application of the eight QM principles may impact the competitive advantage of ISO 9001 certified companies through improved organisational capabilities, in terms of competitive resources or assets, competitive processes and competitive performance; and financial results such as increased revenue, market share and profitability, and
(3) the contentions made by CIDB Malaysia that effective implementation of ISO 9001 as a QMS will result in improved client’s satisfaction, increased profitability and increased competitiveness.
The standardised regression weights between the latent constructs and the measurement indicators; and between the measurement indicators and the observed variables are shown in Table 9, where the R-square values for the measurement indicators and observed variables are also given.
This research is grounded on the QM theory underpinning the ISO 9000: 2000 family of standards. From Tables 7 and 9, some strategic implications of these findings are:
(1) ISO 9001-certified companies, in order to obtain and maintain ISO 9001 certifications, practise the QMS embodied in it more significantly. This is indicated by the high R2 value in the QMS practices construct.
(2) As QMS practices are positively associated with competitiveness, the following conclusions can be made:
a. ISO 9001-certified companies which practise QM principles will be more competitive (R2 = 0.62) than those ISO 9001-certified companies which do not practise QM principles (R2 = 0.459) in their processes;
b. ISO 9001-certified companies which practise QM principles (R2 = 0.62) will be more competitive than those non ISO 9001-certified companies which practise QM principles (R2 = 0.605); and
c. Non ISO 9001-certified companies which practise QM principles (R2 = 0.605) will be more competitive than those ISO 9001-certified companies which do not practice QM principles (R2 = 0.459).
(3) ISO 9001-certified companies which practise the QMS are more competitive in terms of resources, processes and performance. The work environment and competency of human resources have been identified as the competitive resources of ISO 9001-certified companies. Product development strategies and process performance have been identified to influence competitive processes, and product reliability and product quality have been identified to be associated with competitive performance. ISO 9001-certified companies are more competitive because they practice continual improvement in their operations, and have higher efficiency in their operations because of improved internal performance appraisal systems. Their relationships with suppliers are better.
(4) Through the mediating effect of company com- petitiveness, the business performance of ISO 9001-certified companies is better in terms of profitability, revenue and market share. This is because productivity is higher and they have better risk management. Moreover, it is a valuable marketing tool to be ISO 9001-certified and their clients perceive higher quality in the work carried out. As a result, they have better access to domestic markets. In fact, 90% of the respondents opined that ISO 9001 certifications are important to their companies’ continued success.
Table 9 Model constructs and observed variables in final hypothesised model.
Model constructs (R2 values)
Regression weights
Measurement indicators (R2 values)
Regression
weights Observed variables
(R2
values)
0.78 Personnel evaluate their performance in quality management against their personal goals. (0.61) 0.90 Involvement of people(0.80)
0.75 Personnel openly discuss quality problems and issues. (0.56) 0.77 Organisation analyzes data and information using valid methods. (0.60)
0.79 Organisation makes continual improvement of products, processes and systems an objective. (0.63) 0.91 Continual improvement and factual approach
(0.83)
0.86 Organisation employs a consistent organisation-wide approach to continual improvement. (0.75)
0.78 Organisation acknowledges the interdependencies between the processes of the system. (0.62)
0.79 Organisation adopts structured approaches that harmonize and integrate processes. (0.62) 0.95
Process and system approaches
(0.91)
0.73 Organisation adopts a process approach for the quality management system. (0.53) 0.72 Provides personnel with the necessary resources. (0.51) 0.91 Leadership (0.82)
0.76 Sets challenging goals and targets for the organisation. (0.58)
0.81 Organisation inspires, encourages & recognizes improvements and achievements by suppliers. (0.65) 0.82
Mutually beneficial supplier relationships
(0.68) 0.83 Organisation has clear and open communication with suppliers. (0.69)
0.65 Customer requirements are met to enhance customer satisfaction. (0.43) QMS practices
(0.58)
0.87 Customer focus (0.75)
0.71 A balanced approach is adopted between satisfying customers. (0.50)
0.80 Provision of conducive work environment to achieve product conformance (0.64)
0.82 Provision of adequate infrastructure to achieve product conformance. (0.68) 0.82 Resource management(0.67)
0.74 Provision of competent human resources / Training (0.55) 0.81 Corrective and preventive actions. (0.66) 0.95 Measurement, analysis and improvement
(0.91) 0.75 Continual improvement. (0.57)
0.65 Documentation of quality policy and quality objectives. (0.43) 0.90 QMS requirements (0.81)
0.64 Internal audits (0.41)
0.68 Purchasing and supplier control process (0.46) 0.82 Product realization (0.67)
0.75 Control of monitoring and measuring devices (0.57) 0.50 Design and development planning and review (0.25) Registration
efforts
0.89 responsibility (0.79)Management
0.71 Management review (0.50)
0.85 Profitability (0.73)
0.89 Increased revenue (0.80)
Business performance (0.56)
0.74 Market share (0.54)
0.83 Product reliability (0.69)
0.81 Competitive performance
(0.66) 0.87 Product quality (0.76)
0.77 Product development strategies (0.59) 0.95 Competitive processes (0.91)
0.77 Process Performance (0.59)
0.82 Competency of human resources (0.68) Company
competitiveness (0.62)
0.84 Competitive resources (0.71)
0.86 Work environment (0.74)
0.59 Number of customer complaints (0.35) Customer satisfaction
[image:20.595.57.541.107.730.2]
customer complaints, rework or repair, and noncomformity reports or quality problems. The client satisfaction is greater because they are more customer-focused. With more systematic record keeping, they have better internal and external communication.
Due to the nature of this research and the target population, the following limitations can be identified:
(1) This survey was based on a cross-sectional sample at one specific point in time which does not permit examination of trends due to time constraint.
(2) This study lacks objective measures [28] as the responses given by the respondents are based on their perceptions through their experiences and involvement with ISO 9001 certifications and implementations. It would be more reliable to have multiple respondents, where the customer satisfaction data had come directly from the customers instead of only the ISO 9001-certified companies in the Malaysian construction industry.
(3) Due to the small target population, some of the respondents are in fact just being accredited with ISO 9001 certifications. This is clearly evident from the responses they gave with regard to the motivators for pursuing ISO 9001 certifications, where at least six respondents put as “to satisfy the requirement of CIDB Malaysia for G7 contractors”. The perceptual responses from new registrants might be biased as compared to those who have obtained the ISO 9001 certifications much longer.
(4) The results from SEM provide information regarding the plausibility of causal hypothesis, but not the conclusions about causality [1]. The results only confirmed that the proposed structural model is one of several possible acceptable models to explain the causal relationships among the five latent construct [48].
With regard to future research, the following are the recommendations:
(1) The ISO 9000: 2000 family of standards is a QMS which is recently updated from ISO 9000: 1994.
One way to strengthen the conclusions of this research is to repeat the survey with an improved questionnaire in other industries in Malaysia or even in other countries.
(2) A research can be carried out to investigate the causal relationships between motivations for certifications, depth of ISO 9000 implementation and business performance of ISO 9001-certified companies in the Malaysian construction industry.
(3) This research uses the model-generating models approach to SEM, which uses the initial model to generate further models. The model selected is done on the basis of best fit to theory and data, along with the goal of parsimony. As a longitudinal research, it is recommended that the model generated from this research be tested on additional dataset collected by using the improved questionnaire when the number of ISO 9001-certified companies in the Malaysian construction industry is larger.
(4) As ISO 9004: 2000 is a standard for performance improvements, a model for performance excellence in the Malaysian construction industry can be constructed from the QM principles.
ISO 9001 standard. In conclusion, the findings from this empirical research are significant and relevant to the top management of ISO 9001-certified companies in Malaysian construction industry as the QMS practices contribute positively to company competitiveness. ISO 9001 certification can be used as an innovative administration tool to enhance company competitiveness; consisting of competitive assets or resources, competitive processes and competitive performance; which in turn enhances customer satisfaction and business performance. This invariably depends on effective implementation of ISO 9001 certification in the company. The study is significant for the following reasons: (a) from the theoretical standpoint, the proposed model has attempted to elucidate the link between existing theory and the requirements for systematic and effective implementation of ISO 9001 as a QMS; and (b) from the practical standpoint, the proposed model is aimed at the tactical and strategic implications of effective implementation of ISO 9001 certifications on increased company competitiveness and improved business performance of ISO 9001-certified companies. Therefore, the knowledge gained from the application of SEM is an important contribution to the body of theoretical literature in QM.
References
[1] R. Fellows and A. Liu, Research Methods for Construction (3rd ed.), Wiley-Blackwell Ltd, 2008. [2] S. G. Naoum, Dissertation Research and Writing for
Construction Students (2nd ed.), Butterworth Heinemann, 2007.
[3] S. D. Green and C. Hart, Towards A co-production research agenda for construction competitiveness, Joint 2008 CIB W065/W055 International Symposium, Dubai, 2008.
[4] T. M. Toole, A primer on social science research methods in construction, Proceedings of the 2006 ASCE-CIB Joint Conference on Leadership in Construction, Bahamas, May 4-6, 2006.
[5] K. Molenaar, S. Washington and J. Diekmann, Structural equation model of construction contract dispute potential, Journal of Construction Engineering and Management 126 (2000) 268–277.
[6] K. Yang and J. Trewn, Multivariate Statistical Methods in Quality Management, McGraw-Hill, 2003.
[7] N. Chileshe and C. T. Haupt, Modelling critical success factors of construction project management (CPM), Journal of Engineering Design and Technology 3 (2005) 140-154.
[8] T. Chinda and S. Mohamed, Structural equation model of construction safety model, Engineering, Construction and Architectural Management 12 (2008) 114-131.
[9] M. Y. Leung, Y. S. Chan and J. Yu, Integrated model for the stressors and stresses of construction project managers in Hong Kong, Journal of Construction Engineering and Management 126 (2009).
[10] S. Mohamed, Safety climate in construction site environments, Journal of Construction Engineering and Management (2002) 375–384.
[11] T. Waroonkun, Modelling international technology transfer in thai construction projects, PhD Thesis, Griffith School of Engineering, Griffith University, Gold Coast Campus, Australia, 2007.
[12] T. Chinda and S. Mohamed, Causal relationship between enablers of construction safety culture, in: Fourth International Conference on Construction in the 21st
Century (CITC-IV): Accelerating Innovation in Engineering, Management and Technology, Gold Coast, Australia, July 11-13, 2007.
[13] S. Larsson, A. Pousette and M. Torner, Psychological climate and safety in the construction industry-mediated influence on safety behavior, Safety Science 46 (2008) 405-408.
[14] V. Ahuja, IT enhanced communication protocols for building project management by small and medium enterprises in the indian construction industry, PhD Thesis, Queensland University of Technology, Australia, 2007. [15] K. M. Cho, T. H. Hong and C. T. Hyun, Effect of project
characteristics on project performance in construction projects based on structural equation model, Expert Systems with Applications36 (2009) 10461–10470. [16] A. Hamzah and S. Ho, TQM training for small and
medium industries in Malaysia, Training for Quality 2 (1994) 27–35.
[17] Z. Ahmad and Z. Mohd Zain, Total Quality Management Practice in Malaysia: How Much Is Written? Malaysian Management Review, 2000, available online at: http://mgv.mim.edu.my/MMR/0006/0000607.Htm, 2005. [18] Abdul-Rashid Abdul-Aziz, The realities of applying total
quality management in the construction industry, Structural Survey 20 (2002) 88–96.
![Fig. 1 The research process [49].](https://thumb-us.123doks.com/thumbv2/123dok_us/8780630.904014/4.595.80.262.464.715/fig-the-research-process.webp)
![Fig. 3 Conceptual structural model. Source: [28, 31].](https://thumb-us.123doks.com/thumbv2/123dok_us/8780630.904014/5.595.75.534.93.394/fig-conceptual-structural-model-source.webp)