Corrigendum (September 2014)
Mesenchymal high-grade glioma is maintained
by the ID-RAP1 axis
Francesco Niola, … , Antonio Iavarone, Anna Lasorella
J Clin Invest.
2013;123(1):405-417. https://doi.org/10.1172/JCI63811.
High-grade gliomas (HGGs) are incurable brain tumors that are characterized by the
presence of glioma-initiating cells (GICs). GICs are essential to tumor aggressiveness and
retain the capacity for self-renewal and multilineage differentiation as long as they reside in
the perivascular niche. ID proteins are master regulators of stemness and anchorage to the
extracellular niche microenvironment, suggesting that they may play a role in maintaining
GICs. Here, we modeled the probable therapeutic impact of ID inactivation in HGG by
selective ablation of
Id
in tumor cells and after tumor initiation in a new mouse model of
human mesenchymal HGG. Deletion of 3
Id
genes induced rapid release of GICs from the
perivascular niche, followed by tumor regression. GIC displacement was mediated by
derepression of
Rap1gap
and subsequent inhibition of RAP1, a master regulator of cell
adhesion. We identified a signature module of 5 genes in the ID pathway, including
RAP1GAP
, which segregated 2 subgroups of glioma patients with markedly different
clinical outcomes. The model-informed survival analysis together with genetic and
functional studies establish that ID activity is required for the maintenance of mesenchymal
HGG and suggest that pharmacological inactivation of ID […]
Research Article
Oncology
Find the latest version:
Mesenchymal high-grade glioma
is maintained by the ID-RAP1 axis
Francesco Niola,1 Xudong Zhao,1 Devendra Singh,1 Ryan Sullivan,1 Angelica Castano,1 Antonio Verrico,1 Pietro Zoppoli,1 Dinorah Friedmann-Morvinski,2 Erik Sulman,3 Lindy Barrett,4
Yuan Zhuang,5 Inder Verma,2 Robert Benezra,4 Ken Aldape,3 Antonio Iavarone,1,6,7 and Anna Lasorella1,7,8
1Institute for Cancer Genetics, Columbia University Medical Center, New York, New York, USA. 2Laboratory of Genetics, Salk Institute for Biological Studies,
La Jolla, California, USA. 3Department of Pathology, MD Anderson Cancer Center, Houston, Texas, USA. 4Cancer Biology and Genetics Program,
Memorial Sloan-Kettering Cancer Center, New York, New York, USA. 5Department of Immunology, Duke University Medical Center, Durham, North Carolina,
USA. 6Department of Neurology, 7Department of Pathology, and 8Department of Pediatrics, Columbia University Medical Center, New York, New York, USA.
High-grade gliomas (HGGs) are incurable brain tumors that are characterized by the presence of
glioma-ini-tiating cells (GICs). GICs are essential to tumor aggressiveness and retain the capacity for self-renewal and
multilineage differentiation as long as they reside in the perivascular niche. ID proteins are master regulators
of stemness and anchorage to the extracellular niche microenvironment, suggesting that they may play a role
in maintaining GICs. Here, we modeled the probable therapeutic impact of ID inactivation in HGG by selective
ablation of Id in tumor cells and after tumor initiation in a new mouse model of human mesenchymal HGG.
Deletion of 3 Id genes induced rapid release of GICs from the perivascular niche, followed by tumor regression.
GIC displacement was mediated by derepression of Rap1gap and subsequent inhibition of RAP1, a master
reg-ulator of cell adhesion. We identified a signature module of 5 genes in the ID pathway, including RAP1GAP,
which segregated 2 subgroups of glioma patients with markedly different clinical outcomes. The
model-in-formed survival analysis together with genetic and functional studies establish that ID activity is required for
the maintenance of mesenchymal HGG and suggest that pharmacological inactivation of ID proteins could
serve as a therapeutic strategy.
Introduction
High-grade gliomas (HGGs) are the most common brain tumors in humans and are essentially incurable (1). The defining hall-mark of HGG is the presence within the tumor mass of highly tumorigenic cellular subpopulations, which fuel tumor aggres-siveness. These cell populations hijack several features of neural stem cells (NSCs), such as self-renewal and multilineage differen-tiation capacity, and are commonly defined as glioma-initiating cells (GICs) (2, 3). GICs reside in a perivascular niche, a microen-vironment that is critical to preserve the cancer stem cell state and tumor aggressiveness, and adhesion of GICs to endothelial cells is essential to support the stem cell–like characteristics of GICs (2, 4–7). Disruption of the intimate contacts established by GICs with tumor endothelial cells abrogates self-renewal and tumor-initiating capacity of GICs (4, 6, 8). It has been suggested that targeting the mechanisms driving the GIC state and main-taining the anchorage of these cells to the perivascular niche may provide important therapeutic value. However, the molecular identification of those mechanisms remains elusive.
ID proteins are generally viewed as inhibitors of differentiation and enhancers of proliferation and stemness (9). However, they
can exert different roles depending on the cellular context and the particular biological system (10). During normal development of the brain, ID proteins prevent premature cell fate determina-tion and differentiadetermina-tion (11–13). Recently, we discovered that ID proteins preserve anchorage of NSCs to the extracellular niche microenvironment by repressing basic helix loop helix–mediated (bHLH-mediated) transcriptional activation of the gene coding for the RAP1-GTPase inhibitor Rap1GAP, thus precluding premature detachment of NSCs from the ventricular surface and initiation of differentiation (13). Accumulation of ID proteins is detected in a variety of tumor types, including HGG, in which the highest lev-els of ID proteins have been associated with the most aggressive form of the disease, the glioblastoma multiforme (GBM) (14). The redundant activity of ID proteins toward their intracellular targets (the bHLH transcriptional activators) suggests that combined inac-tivation of multiple Id genes may be required to uncover signifi-cant phenotypic changes (15). Expression of ID1 and ID3 has been associated with the tumor-initiating capacity of GICs, and recent work has established that overexpression of ID proteins is suffi-cient to reprogram Ink4a/Arf–/– astrocytes to cells with GIC features
(16–18). However, ablation of Id1 alone or in combination with Id3
has minimal effect on tumor growth and animal survival in mouse models of HGG displaying a proneural phenotype (19). High lev-els of ID1 identify glioma cells with high self-renewal capacity but lower tumorigenic ability relative to that of cells with low expres-sion of ID1 possessing limited self-renewal capacity. Accordingly, the high expression of ID1 in human HGG with a proneural pheno-type is associated with more favorable clinical outcome (19).
To determine whether ID proteins are essential for glioma main-tenance and ascertain the potential therapeutic impact of
target-Authorship note: Francesco Niola and Xudong Zhao contributed equally to this work.
Conflict of interest: The authors have declared that no conflict of interest exists.
Note regarding evaluation of this manuscript: Manuscripts authored by scientists associated with Duke University, The University of North Carolina at Chapel Hill, Duke-NUS, and the Sanford-Burnham Medical Research Institute are handled not by members of the editorial board but rather by the science editors, who consult with selected external editors and reviewers.
ing ID activity in this disease, we generated a new mouse model of malignant glioma that recapitulates mesenchymal tumors, the most aggressive subtype of HGG (20). This model has allowed us to address the significance of concurrent genetic inactivation of 3 Id genes (Id1, Id2, Id3) exclusively in brain tumor cells and after tumor initiation. The time-controlled deletion of Id genes in this mouse glioma model led to marked extension of survival, with rapid loss of GICs from the perivascular niche and tumor regres-sion, an effect mediated by derepression of the RAP1-GTPase inhibitor, Rap1GAP. This finding is consistent with the strong prognostic value that emerged from the segregation of glioma patients into 2 subgroups, with divergent clinical outcome based on the activity of a 5-gene set, including ID genes and RAP1GAP.
Results
Suppression of ID function impacts tumor maintenance of HGG. To ask whether the consequences of Id deletion on tumor growth affect the cell-intrinsic properties of GICs, including the competence to adhere to the perivascular niche, we set out to develop a mouse model of malignant glioma in which Id deletion could be selec-tively targeted to glioma cells after tumor initiation without the confounding effects that might derive from Id deletion in other
Id-expressing populations, such as endothelial cells, tumor stroma, or immune cells. Transduction of NSCs in the hippocampus, a neurogenic area of the adult brain, with a lentivirus that expresses oncogenic ras (HrasV12) and shRNA against the tumor suppres-sor Tp53 (shp53) generates HGG (21). Although oncogenic muta-tions affecting ras genes are uncommon in human GBM, Ras is frequently activated in HGG by aberrant signaling from multiple receptor tyrosine kinases (22). When we tested the same lentivi-ral vector expressing GFP instead of HrasV12 to identify infected cells, most of the GFP-positive cells costained with the radial glia and astrocytic marker GFAP and were negative for the neuronal marker NeuN (Supplemental Figure 1A; supplemental material available online with this article; doi:10.1172/JCI63811DS1). In order to temporally control deletion of Id selectively in tumor cells, we linked an IRES-Cre-ER cassette to HrasV12 cDNA and
shp53, thus achieving Cre-recombinase activation by tamoxifen in vivo in the mouse (Supplemental Figure 1B). To create a condi-tional Id-null mouse, we crossed mice harboring floxed alleles of
Id1 (Id1L/L) and Id2 (Id2L/L) with constitutive Id3 knockout (Id3–/–)
mice to generate Id1L/LId2L/LId3–/– (Id conditional triple-knockout;
Id-cTKO) mice (13). HrasV12-Cre-ER-shp53 lentiviral particles were injected in the hippocampi of 4-week-old Id-cTKO mice, and tumor initiation/progression was examined. Definite tumor lesions were detected as early as 12 days after lentiviral transduction in 86% of the infected mice (6 out of 7; Figure 1A, top panels). At this stage, tumors consisted of highly proliferative Ki67+ cells, showing
reac-tivated expression of ID1 and ID2 (largely absent in the adult hip-pocampus) and robust positivity for nestin and oligodendrocyte transcription factor 2 (Olig2) (Figure 1A and Supplemental Figure 1C). Advanced tumors analyzed at the time of mouse euthanasia manifested features of HGG, such as multinucleated giant cells, necrosis and pseudo-palisades, mitotic figures, and propensity to invade the normal brain (Figure 1B). Tumors remained strongly positive for ID1, ID2, Olig2, and nestin; expressed glial fibrillary acidic protein (GFAP); and included individual entrapped β III-tu-bulin–positive neurons. The high positivity for Ki67 and the endothelial marker CD31 were indicative of rapid growth and ram-pant tumor angiogenesis, respectively (Figure 1C). Together, these
elements reflect those found in the human counterpart of the dis-ease (glioma grade III–IV). Interestingly, double immunostaining experiments for ID1 and ID2 showed that the 2 ID proteins are frequently coexpressed in glioma cells (Figure 1D).
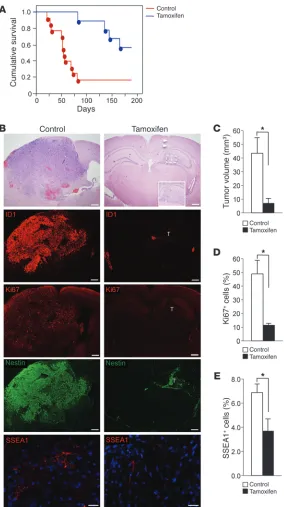
To ascertain the therapeutic potential of Id deletion in brain tumors, tumor-bearing Id-cTKO mice were treated with tamoxifen or vehicle (corn oil). First, we documented efficient loss of ID1 and ID2 expression and reduced positivity for Ki67 in advanced tumors analyzed by immunofluorescence 7 days after a single 4-day cycle of tamoxifen treatment (Supplemental Figure 2, A–C). The residual cells staining positive for ID1 (but not ID2) in tamox-ifen-treated gliomas were, for the vast majority, tumor endothelial cells, as shown by the nuclear morphology and costaining for CD31 (Supplemental Figure 2, A and B, and data not shown). Glioma cells that stained positive for the HrasV12 oncoprotein also expressed ID proteins. However, the expression of HrasV12 was unaffected by Id deletion (Supplemental Figure 2D). This finding indicates that the tamoxifen-mediated ablation of Id genes in glioma cells does not impact retention of the tumor-initiating HrasV12 protein. Therefore, this mouse model allows selective and specific deletion of Id genes in glioma cells. Then, we evaluated survival in mice treated with tamoxifen or vehicle 12 days after lentiviral transduction and at biweekly intervals thereafter. Eighty-five percent of oil-treated mice (11 out of 13) succumbed because of intracranial tumors within an average of 10 weeks from len-tiviral transduction. However, Id ablation resulted in significant extension of survival, with 64% of the mice (7 out of 11) alive after an average of 20 weeks (P = 0.002; Figure 2A). Tumor suppression was not merely an effect of tamoxifen, as tamoxifen treatment of wild-type animals infected with HrasV12-Cre-ER-shp53 lentivirus did not affect tumor growth (data not shown). The tumors that eventually developed and caused death of tamoxifen-treated mice accumulated high levels of ID1 and ID2, thus suggesting that Id
expression by glioma cells is required for tumor growth in this model (Supplemental Figure 3A).
ID proteins preserve GICs and are required for association of GICs with endothelial cells. To identify the defining features precipitated by deletion of Id genes in glioma, we sacrificed controls and tamox-ifen-treated mice 6 weeks after tumor initiation. The majority of tumors (80%) in the tamoxifen-treated cohort displayed dramatic reduction of tumor volume compared with that of carrier-treated tumors and consisted of clusters of tumor cells confined to the hippocampus that had not progressed relative to tumors detected 12 days after viral infection (Figure 2, B and C, also compare Fig-ure 2B with FigFig-ure 1A). As expected, these tumors either lacked or expressed negligible levels of ID proteins. Id-deleted glioma lesions showed a marked reduction in the proliferation rate (4 fold, as measured by Ki67 immunoreactivity) and a striking decrease of the stem cell markers nestin and SSEA1 compared with that of control tumors (Figure 2, B–E, and Supplemental Figure 3B). It is impor-tant to emphasize that expression of nestin in tamoxifen-treated tumors was lower at this stage than in the controls at the earliest time point (compare Figure 2B with Figure 1A), suggesting that nestin downregulation was independent of tumor size and spe-cifically implemented by Id loss. The decrease of nestin expression was recapitulated in vitro when tumor explants established from
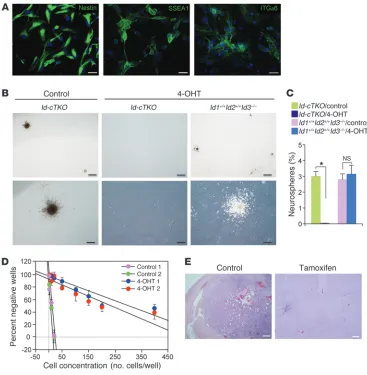
To analyze the consequences of Id ablation on GIC-enriched populations, we isolated cells from HrasV12-Cre-ER-shp53 glioma. We selected GICs based upon their ability to self-renew as tumor spheres in stem cell–permissive culture conditions (23); retain expression of the NSC and GIC markers SSEA1, integrin α6,
[image:4.585.78.494.80.539.2]and nestin; and display robust glioma-initiating capacity when orthotopically transplanted into the brains of immunodeficient mice (Figure 3). Treatment of GICs isolated from Id-cTKO mice with tamoxifen abolished the tumor sphere-forming capac-ity, but the same treatment had no effect on GICs derived from
Figure 1
HGG arising in mice injected with Ras-V12-IRES-Cre-ER-shp53 lentivirus. (A) H&E staining and immunophenotype of a representative tumor
lesion in the hippocampi of Id-cTKO mice 12 days after stereotaxic injection with Ras-V12-IRES-Cre-ER-shp53 lentivirus. Adjacent sections were immunostained using the indicated antibodies. Scale bars: 500 μm. (B) Representative microphotographs of H&E staining of advanced
Ras-V12-IRES-Cre-ER-shp53–generated tumors showing histological features of HGG. The arrow indicates a multinucleated glioblastoma giant cell. Arrowheads point at clusters of tumor cells infiltrating the normal brain. N, necrotic foci. Scale bars: 500 μm (top left panel); 100 μm (top right and bottom panels). (C) Immunofluorescence staining of representative brain sections from mice injected with Ras-V12-IRES-Cre-ER-shp53 lentivirus
sacrificed after the manifestation of neurological symptoms. Glioma and stem cell markers (Nestin, Olig2, and GFAP), ID1, ID2, the proliferation marker Ki67, and vascular endothelial cell marker CD31 are widely expressed. βIII-Tubulin is present in scattered cells. The arrow indicates the soma of a neuron. Arrowheads point at clusters of tumor cells infiltrating the normal brain. Scale bars: 100 μm (Nestin, Olig2, βIII-tubulin, GFAP, and Ki67); 200 μm (ID1, ID2, and CD31). (D) Double immunofluorescence staining for ID1 (green) and ID2 (red) shows coexpression of ID1
Id1+/+Id2+/+Id3–/– mice (Figure 3, B and C). To accurately determine
the frequency of glioma cells that self-renew and generate spheres within the glioma cell population, we performed limiting dilution analysis using cells from freshly dissociated tumors (24). Based on the Poisson distribution and the intersection at the 37% level, we estimated the minimal frequency of glioma cells endowed with stem cell capacity to be 0.29% ± 0.02% and 3.84% ± 0.51% in tumors derived from tamoxifen-treated animals and controls, respectively (P = 0.006) (Figure 3D). Finally, following orthotopic implantation of HrasV12-Cre-ER-shp53-Id-cTKO GICs into the brains of immuno-deficient mice, tamoxifen efficiently blocked tumor formation (0 out of 5 mice developed tumors), whereas highly aggressive glial
tumors developed in the control group (5 out of 5 mice developed tumors; Figure 3E). The concordant phenotypes in vivo and in vitro, as well as across multiple experimental systems, support the view that ID proteins play a key role in maintaining self-renewal and the tumorigenic capacity of GICs.
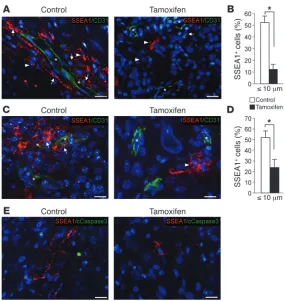
Next, we tested whether loss of Id impacts the interaction between GICs and endothelial cells in the tumor perivascular niche. First, we determined that a substantial fraction of SSEA1-positive tumor cells were also positive for ID immunostaining, thus indicating that GICs express ID proteins in vivo (Supplemental Figure 4). Then, we asked whether deletion of Id genes in GICs from estab-lished tumors influenced the residency of GICs in the
perivas-Figure 2
Ablation of Id in cancer cells affects tumor maintenance in Ras-V12-IRES-Cre-ER-shp53 HGG. (A) Kaplan-Meier
survival curves of Id-cTKO mice injected intracranially with Ras-V12-IRES-Cre-ER-shp53 lentivirus that had received systemic tamoxifen or oil. Points on the curves indicate deaths (n = 13 for oil and n = 11 for tamoxifen). P = 0.002. (B) H&E staining and immunophenotype on adjacent
sec-tions of representative brains from Id-cTKO mice treated with tamoxifen or oil and sacrificed 6 weeks after stereo-taxic injection with Ras-V12-IRES-Cre-ER-shp53 lenti-virus. The boxed tumor is shown at higher magnification in the inset. Arrowheads indicate injection track. T, tumor. Scale bars: 500 μm (H&E, ID1, Ki67, and Nestin); 20 μm (SSEA1). Original magnification, ×10 (inset). (C)
Quanti-fication of tumor volume in mice as in B (n = 3 per each treatment group). *P = 0.0381. (D) Quantification of Ki67+
cells in tumors as in B. (n = 3 per each treatment group). *P = 0.0024. (E). Quantification of SSEA1+ cells in tumors
[image:5.585.44.328.81.588.2]cular niche. To examine the spatial relationship between GICs and endothelial cells in tumor blood vessels, we quantified the fraction of GICs in close proximity to CD31-positive endothelial cells (≤10 μm) in tamoxifen- and vehicle-treated tumors. GICs were independently identified using SSEA1 and integrin α6, 2 well-characterized GICs markers previously assigned to GICs in the perivascular niche (6, 25). Compared with controls, tumors carrying deletion of Id genes had a significantly reduced (5-fold) fraction of GICs residing within 10 μm from CD31-positive cells
[image:6.585.41.408.82.457.2](Figure 4, A and B, and Supple-mental Figure 5, A and B). This effect was detectable as early as 7 days after treatment with tamoxifen, without changes of cell survival measured either in the entire glioma tumor mass or selectively in the SSEA1-pos-itive population of GICs (Fig-ure 4, C–E, and Supplemental Figure 5, C and D). These find-ings indicate that a direct con-sequence of lowering ID dosage in GICs is the disruption of the supportive interaction between GICs and endothelial cells in the perivascular niche, and this effect is implemented without impairing cell survival.
Integrity of the glioma perivascu-lar niche and glioma aggressiveness require RAP1 activity. To eluci-date the molecular phenotype of HrasV12-Cre-ER-shp53 glioma and the changes triggered by
Id ablation in glioma cells, we obtained gene expression pro-files of HrasV12-Cre-ER-shp53
tumors treated with tamox-ifen or vehicle for 6 weeks. Several studies have identified gene expression subgroups in human malignant glioma, with the 2 most robust and alternative categories defined as proneural and mesenchymal and linked to better and worse clinical outcome, respectively (20, 26, 27). Thus, we sought to determine whether the Hras-V12-Cre-ER-shp53 mouse glioma display a global gene expression profile that resembles one of the 2 key human glioma sub-types. To do this, we first gener-ated a training set of 70 human glioma samples from The Cancer Genome Atlas (TCGA) that were reliably classified as proneural and mesenchymal and then applied a linear dis-criminant analysis (LDA) to compare the expression profiles from 4 control (ID-proficient) and 4 tamoxifen-treated (ID-deficient)
HrasV12-Cre-ER-shp53 mouse gliomas to the human glioma clas-sifier data set (see Methods). The analysis revealed that glioma from control mice belong to the mesenchymal subclass (overall probability for mesenchymal classification: 0.995 ± 0.005). Loss of Id genes did not significantly modify the tumor phenotype, although 2 out of the 4 tamoxifen-treated tumors could not be classified as mesenchymal, since they had slightly moved toward
Figure 3
The effect of Id ablation in Ras-V12-IRES-Cre-ER-shp53 GICs in vitro and after orthotopic transplantation in vivo. (A) Cells isolated from Ras-V12-IRES-Cre-ER-shp53 gliomas generated in Id-cTKO mice were cul-tured in medium containing EGF and FGF-2 for 3 passages and immunostained using antibodies against Nestin, SSEA1, and integrin α6 (ITGα6). Scale bars: 20 μm. (B) Microphotographs of tumor spheres from
GICs 14 days after plating at <1 cell per μl in semiadherent conditions. GICs isolated from advanced Ras-V12-IRES-Cre-ER-shp53 gliomas in Id-cTKO or wild-type control mice were cultured in medium containing EGF and FGF-2 for 2 passages and then subjected to treatment with vehicle or 4-OHT for 5 days. Disso-ciated cells were assayed by microscopic analysis for sphere formation. Scale bars: 500 μm (top panels); 250 μm (bottom panels). (C) Quantification of gliomaspheres as a percentage of plated cells from
cul-tures with the indicated genotypes and treatments. Data represent the mean ± SD of triplicate samples; *P = 0.003. (D) Regression plot for cells isolated from controls or tamoxifen-treated tumors. Cells from 2
independent tumors per treatment were plated at limiting dilution (1–400 cells per well) in triplicate plates. Data represent the mean ± SD; P = 0.006. Experiments were repeated twice. (E) H&E staining of
the proneural class (overall probability for mesenchymal classifica-tion: 0.895 ± 0.11) (Table 1). This finding was corroborated by the robust positivity of the tumor cells for fibronectin and connective tissue growth factor, 2 markers of mesenchymal GBM that did not show significant changes after Id deletion (refs. 26, 28, and Fig-ure 5A). However, knowledge-based pathway analysis applied to the genes differentially expressed between control and Id-depleted tumors revealed regulation by ID proteins of functional gene cat-egories linked to plasma membrane, extracellular matrix, cell-cell signaling, cell adhesion, etc. (Supplemental Table 1). These cate-gories are very similar to those acutely perturbed by Id deletion in NSCs through direct regulation of the bHLH target gene Rap1gap, the inhibitor of RAP1-GTPase (13). Interestingly, Rap1gap mRNA was markedly elevated in HrasV12-Cre-ER-shp53 glioma following tamoxifen-mediated deletion of Id genes (Figure 5B).
Depending on the cellular contexts, RAP1 can act as a key reg-ulator of cell-cell or cell-ECM adhesion or both. The function of RAP1 for cell-ECM adhesion is implemented through its ability to operate as intracellular mediator of integrin signaling (29–32). Recently, integrin signaling emerged as an essential determinant for the anchorage of GICs to the perivascular brain tumor niche and tumor aggressiveness (6). Therefore, we asked whether the adhesion defect manifested by Id-depleted GICs depends on the derepression of Rap1GAP and consequent inhibition of RAP1- GTPase. First, we established that Rap1GAP was expressed in the normal mouse brain but was barely detectable in control tumors (Figure 6A). In tumors from tamoxifen-treated mice, the Rap1GAP protein was derepressed to levels comparable to those found in the normal brain (Figure 6A). These effects occurred without changes of the expression of IL-6, a cytokine abundantly expressed in this glioma model (Supplemental Figure 6 and ref. 18). Having
[image:7.585.42.327.80.381.2]determined that Id deletion restored the normal expression of Rap1GAP in glioma, we examined the role of Rap1GAP in GICs and determined whether RAP1 is the significant target of Rap1GAP activity. To do this, we took advantage of a widely used cellular system developed to study the mechanistic events deter-mining the glioma stem cell state. In this system, primary astro-cytes are reprogrammed to a transformed stem cell phenotype (induced glioma-initiating cells [iGICs]) by the expression of a mutant form of the EGFR, EGFRvIII, concurrently with silencing of key tumor suppressor genes frequently deleted in human glioma
Figure 4
Ablation of Id disrupts adhesion of GICs to endothelial cells in the perivascular niche. (A) Immunostaining for
SSEA1 (red) and CD31 (green) on a representative Ras-V12-IRES-Cre-ER-shp53 HGG in Id-cTKO mice 6 weeks after treatment with tamoxifen or oil. Nuclei were coun-terstained with DAPI (blue). (B) Quantification of the
per-centage of SSEA1+ cells from A within 10 μm from CD31+
cells (n = 4 per each treatment group). *P = 0.0005. (C)
Immunostaining for SSEA1 (red) and CD31 (green) on representative Ras-V12-IRES-Cre-ER-shp53 HGG tumors collected from Id-cTKO mice 7 days after treatment with tamoxifen or oil. Nuclei were counterstained with DAPI (blue). (D) Quantification of the percentage of SSEA1+
cells from C within 10 μm from CD31+ cells (n = 4 per each
treatment group). *P = 0.0005. (E) Immunostaining for
SSEA1 (red) and cleaved caspase-3 (green) on represen-tative Ras-V12-IRES-Cre-ER-shp53 HGG from Id-cTKO
mice 7 days after treatment with tamoxifen or oil. Nuclei were counterstained with DAPI (blue). Data represent the mean ± SD. Asterisks in images indicate the lumen of blood vessels; arrows indicate SSEA1+ cells within 10 μm from
CD31+ cells; arrowheads indicate SSEA1+ cells >10 μm
from CD31+ cells. Scale bars: 20 μm.
Table 1
LDA classifies mouse HrasV12-Cre-ER-shp53-Id-cTKO tumors as mesenchymal glioma
Tumor Predicted group
sample Treatment Proneural Mesenchymal
M137 Control 0.01 0.99 M139 Control 0.01 0.99 M140 Control 0.00 1.00 M141 Control 0.00 1.00 M142 Tamoxifen 0.02 0.98 M143 Tamoxifen 0.15 0.85 M144 Tamoxifen 0.00 1.00 M146 Tamoxifen 0.24 0.76
[image:7.585.308.529.582.695.2](33, 34). We engineered astrocytes derived from Id1L/LId2L/LId3L/L
mice to express EGFRvIII-IRES-CreER and shp53 and treated the resulting neurospheres with vehicle or tamoxifen to delete Id genes. Loss of Id in iGICs induced the bHLH-ID targets Rap1gap and
Cdkn1c (13, 35) and led to morphological and molecular changes indicative of multilineage neural differentiation (Supplemen-tal Figure 7, A–C). These effects occurred in the absence of signs of apoptosis (Supplemental Figure 7D). Therefore, we used this system to ask whether the ID/RAP1 pathway controls adhesion
[image:8.585.45.314.82.249.2]of GICs to endothelial cells, a property that mirrors adhesion of GICs to the perivascular niche in vivo (4). Loss of Id genes induced by tamoxifen inhibited the ability of iGICs to adhere to brain endothelial cells and compromised their self-renewal capacity as gliomaspheres (Figure 6, B–D, and Supplemental Figure 7F). How-ever, when Id genes were deleted but RAP1 activity was preserved by expressing a constitutively active RAP1 mutant resistant to Rap1GAP inhibition (RAP1-G12V;Q63E, Supplemental Figure 7E and refs. 36, 37), adhesion to endothelial cells was rescued (Figure 6,
Figure 5
Expression of mesenchymal markers and Rap1gap mRNA in HGG arising in mice injected with Ras-V12-IRES-Cre-ER-shp53 lentivirus. (A) Immunofluorescence staining for
fibronectin and connective tissue growth factor (CTGF) (red) of representative glioma sections from mice treated with oil or tamoxifen and sacrificed 6 weeks after lentiviral transduction of the dentate gyrus. Nuclei were counterstained with DAPI (blue). Scale bars: 50 μm. (B) Normalized values of Rap1gap
mRNA from microarray gene expression profiles of glioma from mice treated with oil or tamoxifen and sacrificed 6 weeks after lentiviral transduction. Data represent the mean ± SD;
n = 4 mice for each condition.
Figure 6
Active RAP1 rescues the loss of iGIC adhesion caused by Id ablation. (A) Immunostaining for Rap1GAP (red)
of representative tumor lesions in Id-cTKO mice treated with tamoxifen or oil and sacrificed 6 weeks after ste-reotaxic injection of Ras-V12-IRES-Cre-ER-shp53 len-tivirus. Nuclei were counterstained with DAPI (blue). Scale bars: 100 μm. (B) Two hundred glioma spheres
from Id1L/LId2L/LId3L/L iGICs coinfected with lentiviral
vectors expressing EGFRvIII-IRES-Cre-ER-shp53 and pLOC-RAP1A-G12V;Q63E-GFP or pLOC-GFP were treated with vehicle (control [CTR]) or 4-OHT for 4 days and assayed for adhesion to brain-derived endothelial cells for 24 hours. Scale bars: 100 μm. (C) Quantification
of the percentage of glioma spheres from B adhering
to a monolayer of brain endothelial cells after an adhe-sion period of 24 hours, as determined by fluorescent microscopy review. Data represent the mean ± SD of quadruplicate samples. *P = 0.00184, vector/control vs. vector/4-OHT; #P = 0.00524, vector/4-OHT vs.
RAP1A-G12V;Q63E/4-OHT. (D) Id1L/LId2L/LId3L/L iGSCs
coin-fected with lentiviral vectors expressing EGFRvIII-IRES-Cre-ER-shp53 and pLOC-RAP1A-G12V;Q63E-GFP or pLOC-GFP were treated with vehicle or 4-OHT for 4 days. Gliomaspheres were dissociated, and single cells were plated at density of <1 cell per μl in 96-well plates in tripli-cates. The number of gliomaspheres was scored 10 days later. Data represent the mean ± SD. *P = 1.541 × 10⁻⁶,
vector/control vs. vector/4-OHT; #P = 9.6489 × 10⁻⁵,
[image:8.585.44.336.388.738.2]B and C, and Supplemental Figure 7F). Expression of RAP1-G12V; Q63E rescued also the gliomasphere-forming capacity of iGICs depleted of Id genes, albeit less efficiently than their adherence (Fig-ure 6D). Thus, inhibition of RAP1 is the crucial event precipitated by recombination of Id genes in tumor cells, which leads to the dis-ruption of the physical contact between GICs and endothelial cells. Next, we asked whether upregulation of Rap1GAP is sufficient to alter adhesion of GICs to endothelial cells. To this aim, we used early-passage, patient-derived GICs that, under serum-free culture conditions, retain phenotypes and genotypes closely mirroring primary tumor profiles as compared to serum-cultured glioma cell lines that have largely lost their developmental identities (23). Enforced Rap1GAP expression in human GICs inhibited RAP1 activity and severely compromised the adhesion of human GICs to endothelial cells (Figure 7, A–C). The frequency of glioma cells that self-renew as gliomaspheres was drastically decreased by enforced expression of Rap1GAP (0.275% ± 0.035% in Rap1GAP-expressing
GICs versus 8.417% ± 0.752% in controls; P = 0.003) (Figure 7D). Rap1GAP also decreased the size of tumor spheres, thus under-scoring the glioma suppressor function of Rap1GAP (Figure 7, E and F). To ask whether the effects of Rap1GAP in GICs are indirect consequences of changes of cell cycle and/or cell viability, we deter-mined the fraction of BrdU-positive cells (to measure entry into S phase) and analyzed cleaved caspase-3 (to assay cell viability) of human GICs expressing Rap1GAP. These experiments showed that Rap1GAP prevented the adhesion of GICs to brain endothelial cells and compromised their self-renewing capacity as tumor spheres, without changing their ability to progress through S phase and in the absence of marks of apoptosis (Figure 8 and Supplemental Fig-ure 8). Conversely, expression of the cell cycle inhibitor p27Kip1 in
GICs inhibited S phase progression (and consequently the growth of GICs as spheres) but did not affect the competence of GICs to establish interactions with brain endothelial cells in the same assay (Figure 8 and Supplemental Figure 8). Taken together, these
find-Figure 7
Expression of Rap1GAP impacts human GIC properties. (A) Analysis of RAP1 activity in human GICs transduced with pLOC-Rap1GAP-GFP or
pLOC-GFP lentivirus. Proteins from pull-down assay were analyzed by immunoblotting using RAP1 antibody (RAP1-GTP). Total cell lysates were analyzed by immunoblotting using the indicated antibodies. α-Tubulin is shown as loading control. The asterisk indicates a nonspecific band. (B)
Microphotographs of human GICs treated as in A and assayed for adhesion to endothelial cells. Scale bars: 200 μm. (C) The number of
adher-ent GFP+ cells was determined by high-power microscopy review. Data represent the mean ± SD of quadruplicate samples from 2 independent
experiments. *P = 0.001. (D) Regression plot for GICs transduced with pLOC-Rap1GAP-GFP or pLOC-GFP lentivirus. Cells from 2 independent
infections were plated at limiting dilution (1–500 cells per well). Each data point represents the mean ± SD; n = three 96-well plates for each condition. P = 0.003. Experiments were repeated twice. (E) The size of tumor spheres obtained from cells treated as in A was determined by
microscopy review. Data represent the mean ± SD; n = 60 spheres from triplicates for each condition. *P = 0.0012. (F) Microphotographs of
[image:9.585.80.495.82.417.2]ings establish that the primary consequence of enforced Rap1GAP expression in GICs is to disrupt cell adhesion.
Prognostic potential of a 5-gene signature in human HGG. We sought to determine whether reduced Rap1GAP expression is also asso-ciated with human glioma tumorigenesis. First, we used the ONCOMINE database, which contains gene expression data com-piled from the microarray analysis of 23 nontumor human brain samples compared to 81 GBM samples. Interestingly, GBM sam-ples showed a highly significant (P = 3.8 × 10⁻²²) downregulation
of RAP1GAP mRNA in comparison with that of the corresponding brain tissues (Figure 9A). In this GBM cohort, the RAP1GAP gene ranked in the top 2% of downregulated genes. The analysis of gene expression data from other types of human glioma (anaplastic astrocytoma, astrocytoma, oligodendroglioma) revealed that the expression of RAP1GAP was similarly decreased (Supplemental Figure 9, A–C). Therefore, downregulation of RAP1GAP is a gen-eral event associated with glial tumor
development in the human brain. The in vivo genetic modeling studies and the in silico transcriptional anal-ysis along with the tumor biological and functional characterizations col-lectively point to ID-mediated inac-tivation of a bHLH-dependent tran-scriptional program as a key element driving the aggressiveness of HGG. The underlying prediction from our model stipulates that any gene expression pro-file that includes reduced expression of bHLH transcription factors (TCF3, also known as E2A; TCF12, also known as HEB; TCF4, also known as E2-2) and their targets (RAP1GAP, CDKN1C) and elevated expression of ID genes (ID1,
ID2, ID3, ID4) carries negative prog-nostic values for patients with HGG. Equally, the opposite expression pat-terns (high expression of bHLH
tran-scription factors and their targets and reduced expression of ID
genes) should predict a more favorable prognosis. Therefore, we built a data set of 1,043 patients with HGG that combined 4 mul-tiple independent microarray data sets (see Methods) (20, 38–40). From this newly constructed and highly representative collection of human HGGs, we assessed how robustly any of the possible combinations of the 9 key genes in the pathway can stratify risk of death. Each tumor was ranked according to an integrated score that takes into account the direction of the survival association (opposite between the bHLH transcription factors and their tar-gets versus the ID genes), with equal weighting for each gene. When each possible combination of bHLH genes, bHLH target genes, and
ID genes was recursively analyzed, the proportional hazards regres-sion analysis revealed that a 5-gene set, including TCF12, ID2, ID3,
[image:10.585.49.544.87.220.2]RAP1GAP, and CDKN1C, was strongly predictive of survival and, using hazard ratios to determine effect size, outperformed any
Figure 8
Loss of cell adhesion by Rap1GAP in GICs is independent of proliferation. (A) Western blot analysis for Rap1GAP and p27Kip1 expression in GICs
transduced with pLOC-Rap1GAP-GFP, pLOC-p27Kip1-GFP, or pLOC-GFP. β-Actin is shown as loading control. (B) Microphotographs of human
GICs transduced with pLOC-Rap1GAP-GFP, pLOC-p27KIP1-GFP, or pLOC-GFP and assayed for adhesion to endothelial cells. Scale bars: 100 μm.
(C) The number of adherent GFP+ cells was determined by high-power microscopy review. Data represent the mean ± SD of triplicate samples
from 2 independent experiments. *P = 2.4069 × 10⁻⁵. (D) The number of tumor spheres obtained from human GICs treated as in B and seeded
[image:10.585.208.541.521.646.2]at <1 cell per μl was determined by microscopy review. Data represent the mean ± SD of triplicate samples. *P = 5.05863 × 10⁻⁵.
Figure 9
The ID/RAP1 pathway carries prognostic value in human malignant glioma. (A) The expression of RAP1GAP is significantly downregulated in 81 samples from human glioblastoma (class 2, dark blue) compared with 23 samples from nontumor human brain (class 1, light blue). P = 3.83 × 10⁻²². In
box-and-whisker plots, horizontal bars indicate the medians, boxes indicate 25th to 75th percentiles, and whiskers indicate 10th and 90th percentiles. (B) Kaplan-Meier analysis comparing survival of
patients carrying HGG expressing high TCF12, RAP1GAP, and CDKN1C and low ID2 and ID3
other gene combination from the defined pathway (hazard ratio, 0.318; P < 0.0001) (Supplemental Table 2). Comparing the sam-ples at both extremes of this 5-gene signature categorizes patients in 2 subgroups, with either high or low activity of the ID/bHLH/ RAP1GAP/CDKN1C pathway and opposite clinical outcomes (P = 0.00483, log-rank test; Figure 9B). High levels of ID1 could not contribute to the poor-prognosis ID-based pathway, because high ID1 expression was individually associated with better clinical outcome in the proneural subgroup and the overall population of patients with HGG (Supplemental Table 2 and Supplemental Fig-ure 10). This notion is consistent with results from a recent study that reported a significant survival benefit of high expression of
ID1 in mouse and human glioma of the proneural subclass (19). Conversely, the HGG subgroup that displays high activity of the
ID2/ID3/TCF12/RAP1GAP/CDKN1C pathway is markedly enriched for glioma with a mesenchymal phenotype (Table 2; P < 0.0001, Fisher’s exact test). Thus, high or low activity of the ID/bHLH/ RAP1GAP/CDKN1C pathway defines prognostically distinct sub-classes of glioma patients and validates the role of this pathway as a functional regulator of glioma progression in humans.
Discussion
In this study, we report the generation of a novel mouse model to explore the impact of temporally controlled deletion of Id genes exclusively in glioma tumor cells. By combining a lentivirus-based model of HGG with a conditionally active Cre recombinase, we have deleted Id genes selectively in glioma cells following the
period of cancer initiation. We have demonstrated that Id genes are required for the maintenance of HGG. The profile of tumor regres-sion after Id inactivation is dominated by loss of the interactions of GICs with endothelial cells in the glioma perivascular niche, which results in loss of self-renewal and tumor-forming capacity by GICs. The mouse model described here will be of general use for the in vivo identification of other oncogenic pathways to which specific tumor types may be addicted.
We have shown that ID proteins function in a cell-intrinsic man-ner in GICs to preserve the intimate interactions of GICs with endothelial cells in the perivascular niche and maintain self-renewal, two properties that have been consistently associated with the most aggressive features of glioma cells (2–6). The selective ablation of Id
[image:11.585.205.543.553.740.2]genes in glioma cells has allowed us to define a GIC-intrinsic role of ID proteins for the communication with the perivascular tumor niche. Loss of Id genes in glioma cells leads to rapid and concur-rent loss of perivascular anchorage and self-renewal of GICs, with-out appreciable changes of cellular viability. The effect of Id loss on the adhesion properties of GICs is mediated by derepression of the bHLH target gene Rap1gap, resulting in RAP1-GTPase inactivation. Consistent with the role of Rap1GAP as mediator of the effects trig-gered by Id loss in GICs, the interactions of GICs with endothelial cells are impaired when Rap1GAP is ectopically introduced into GICs (Figure 10). The consequent loss of self-renewal matches impaired self-renewal and loss of tumor-forming capacity of GICs after tar-geted inhibition of integrin signaling (6). Conversely, preventing inactivation of RAP1-GTPase through a constitutively active RAP1 protein rescues Id-depleted GICs from the inhibitory effects of Rap-1GAP. Interestingly, RAP1GAP has recently emerged as a candidate tumor suppressor gene in other tumor types (41–44). Besides repress-ing Rap1GAP, the expression of ID proteins in malignant glioma is essential to prevent expression of cyclin-dependent kinase inhibitors (e.g., p57Kip2), thus explaining the proliferative arrest precipitated by
acute Id ablation in GICs. We suggest that loss of GICs at the glioma perivascular niche results from the suppression of the dual function of ID proteins as enhancers of proliferation and essential factors for the adhesion of GICs to the glioma perivascular niche. Recruitment of ID proteins as drivers of glioma malignancy is critical to enforce repression of RAP1GAP and CDKN1C in GICs and constitutes the molecular basis for the strong association between activity of the ID/ bHLH/RAP1GAP/CDKN1C pathway and survival in human glioma.
Table 2
Contingency table showing the association between the unfavor-able score of the ID/bHLH/RAP1GAP/CDKN1C pathway and the mesenchymal subtype of HGG
Unfavorable scoreA
Yes No
Mesenchymal Yes 39 483
subtype No 10 511
AThe unfavorable score is defined by the high expression of ID2 and ID3 in
association with the low expression of TCF12, RAP1GAP, and CDKN1C.
Figure 10
Histology and immunostaining. Tissue preparation and immuno histo-chemistry on brain tumors and immunofluorescence staining were per-formed as previously described (26, 50, 51). Antibodies used in immuno-staining are listed in Supplemental Table 3. In histograms, values represent the mean values; error bars are SD or SEM, as indicated in figure legends. Statistical significance was determined by t test (2 tailed) using GraphPad Prism 4.0 software (GraphPad Inc.). Quantification of the IL-6 intensity staining was performed using NIH ImageJ software (http://rsb.info.nih. gov/ij/). The histogram of the intensity of fluorescence of each point of a representative field for each condition was generated. The fluorescence intensity of 3 fields from 3 independent tumors was scored and standard-ized to the number of cells in the field.
Cell culture conditions and cell culture–based assays. Human embryonic kid-ney 293T and bEnd3 cells (ATCC) were grown in DMEM containing 10% FBS (Invitrogen). GBM-derived GICs were grown as spheres in Neurobasal media containing N2 and B27 supplements and human recombinant FGF-2 and EGF (50 ng/ml each; Peprotech). EGFRvIII-shp53 iGICs were obtained by infecting Id1L/LId2L/LId3L/L astrocytes with
EGFRvIII-Cre-ER-shp53 lentivirus. After infection, cells were cultured in Neurobasal media (Invitrogen) containing N2 and B27 supplements (Invitrogen) and human recombinant FGF-2 and EGF (50 ng/ml each).
For adhesion assay of pLOC-GFP or pLOC-RAP1-G12V;Q63E-GFP
EGFRvIII-Cre-ER-shp53 iGICs spheres were generated by plating cells in low-attachment plates (Corning). Cells were treated for 96 hours with 500 nM tamoxifen or vehicle, and an equal number of iGSC spheres (200 per 18-mm coverslip) were plated on bEND3 cells that had been cultured on coverslips for 36 hours in iGSC-defined medium. After 24 hours, cultures were washed with PBS-1% BSA 4 times, fixed in 4% PFA for 10 minutes, and examined by fluorescent microscopy. The number of GFP-positive spheres was scored by scanning the entire coverslip. Triplicate samples for each infection and treatment were analyzed, and data are presented as the per-centage of plated spheres. In histograms, values represent the mean values and error bars are SDs.
Adhesion of pLOC-GFP–, pLOC-Rap1GAP-GFP–, or pLOC-p27Kip1
-GFP–transduced human GICs to endothelial cells was performed by plat-ing bEnd3 cells on 18-mm coverslips and allowplat-ing them to adapt to GSC medium for 36 hours. Dissociated pLOC-GFP–, pLOC-Rap1GAP-GFP–, or pLOC-p27Kip1-GFP–transduced glioma spheres were plated at a density
of 25,000 cells per coverslip in quadruplicates. After 30 minutes, plates were vigorously washed with PBS-0.1% BSA 4 times to remove nonadher-ent cells. Cells were fixed with 4% PFA for 10 minutes and stained with anti-GFP antibody to identify GFP-positive, lentivirus-infected GICs, and the number of GFP-positive cells per field was scored. At least 2,000 GFP-positive cells were counted in each coverslip by scanning multiple fields. Results are presented as the mean ± SD of quadruplicates samples. The assay was repeated twice.
For BrdU incorporation analysis, GICs transduced with GFP, pLOC-Rap1GAP-GFP, or pLOC-p27Kip1-GFP were plated on coverslips and cultured
in the presence of 10 μM BrdU for 2 hours. Cells fixed in 4% PFA were stained with anti-BrdU antibody, and the number of BrdU-positive cells was scored as a percentage of the total number of cells counterstained with DAPI.
For human and mouse glioma sphere formation, cells were infected with lentiviral particles. Three days later, single cells were plated at density of ≤3 cells per well in triplicate in low-attachment 96-well plates. The number and the size of spheres were scored after 10 to 14 days. Limiting dilution assay was performed as described previously (24). Spheres were dissociated into single cells and plated in 96-well plates in 0.2 ml of medium contain-ing growth factors. Cultures were left undisturbed for 10 days, and then the percentage of wells not containing spheres for each cell dilution was calculated and plotted against the number of cells per well. Linear
regres-Combined with the findings recently reported on the role of ID1 in HGG (19), our study provides a clearer picture of how ID pro-teins operate in malignant glioma. In proneural HGG and those initiated with a Kras mutation, high expression of ID1 marks a highly self-renewing population of tumor cells that does not coexpress ID2 and ID4, is associated with poorer tumor-initiating capacity relative to that of the population with low ID1 expres-sion, and correlates with better survival of patients with proneural glioma (19). It will be interesting to test the effects of combined loss of 3 Id genes in these mouse models, therefore addressing the con-sequences of inactivating multiple Id genes when they are expressed by different types of tumor cells. Conversely, the mesenchymal glio-mas generated here coexpress multiple ID proteins, and the com-bined ablation of 3 Id genes in tumor cells has dramatic negative impact on self-renewal, tumor-initiating capacity, and residency in the perivascular niche of glioma cells. In future work, it will be important to address whether deletion of 1 or 2 Id genes in the mesenchymal mouse model of malignant glioma reported here will also lead to a similar dissociation of self-renewal and tumor growth, as observed in the other tumor models (19).
Activation of the ID/bHLH/RAP1GAP/CDKN1C pathway identi-fies HGG with poor clinical outcomes that are enriched in mesen-chymal tumors. The identification of the 5-marker, ID-based signa-ture predicting clinical outcome of patients with HGG will facilitate the identification of molecularly based subgroups of patients with HGG, who might benefit from targeted therapeutic approaches aimed at extinguishing ID activity in cancer cells. In breast cancer, Oncotype DX is a widely used test that predicts likelihood of recur-rence and guides treatment (45, 46). As anti-ID targeting therapies become available, the identification of the high-risk group of glioma patients, with aberrant activity of the ID pathway reported in this study, will be useful for discerning the subset of patients who may receive substantial the subset of patients who may receive substan-tial benefit from anti-ID approaches.
The mouse model reported in this study, in which Id genes were selectively ablated in glioma cells, has allowed us to define a GIC-in-trinsic role of ID proteins for the communication with the perivas-cular niche. However, any therapeutic approach to target ID in human cancer will also target ID functions in nontumor cells (e.g., the tumor endothelium) in which ID inactivation is also expected to generate beneficial antitumor effects (11). It has been suggested that one of the reasons for the limited success of targeted cancer therapies is that they fail to target the key features of cancer stem cells, among which retention of self-renewal and anchorage to the extracellular niche are probably the two most important functional properties (47). Both the cell intrinsic machinery that maintains GICs and the mechanisms orchestrating adhesion of GICs to the niche microenvironment have been independently proposed as promising targets for new therapeutic approaches. The dual mas-ter regulatory function of ID proteins unraveled here lends strong support to pharmacological strategies aimed at countering ID function in HGG and other malignancies sustained by cancer stem cells and their interaction with extracellular niches.
Methods
Animals. The Id2L/L mouse was used to generate conditional Id2 knock-out mice and has been described previously (13). In this floxed mouse, loxP sites flanked the entire protein-coding region of the Id2 gene. These mice were crossed with Id1L/L and Id3–/– or Id3L/L mice to generate
analysis on Illumina MouseRef-8 version 2.0 expression BeadChip. The raw array data were normalized using the Bioconductor package Lumi using quantile normalization. In order to classify mouse samples according to the human GBM phenotypes, we used data obtained from TCGA Data Por-tal (54). Description of TCGA data, platforms, and analyses are available at http://tcga-data.nci.nih.gov/. The specific data sources were (according to “Data Levels and Data Types”) as follows: expression data, “Level 2” normalized signals per probe set (Affymetrix HT_HG-U133A). First, we analyzed data to select samples that could be categorized as mesenchymal or proneural according to 3 published GBM phenotypic signatures (20, 26, 27). Differentially expressed genes were selected based on fold change ≥2 and P > 10–5. Using these stringent criteria, we identified 29 proneural and
41 mesenchymal samples. Then, we applied the R package (55) to the raw array data to normalize mouse and human data and remove batch effects. Finally, we applied the LDA implemented in the MASS package (56) to classify the mouse samples. LDA is a well-established method to obtain a reduced-dimension representation of the data. LDA computes an opti-mal transformation (projection) by minimizing the within-class distance and maximizing the between-class distance simultaneously, thus achiev-ing maximum class discrimination. In our study, class labels are available (proneural and mesenchymal), and supervised approaches such as LDA are more effective than unsupervised ones such as principal component analysis for classification. In this analysis, the 70 human GBM samples were treated as the training set. LDA returns a value ranging between 0 (not belonging) and 1 (belonging) to each sample in a data set, indicating the membership in each class. Thus, the values returned provide an indication of the likelihood of a sample belonging to each class. Each mouse tumor was then allocated to the class to which it most belongs. Probability equal to 1 indicates the maximum probability. The complement of the proba-bility (1-p) can be interpreted as a P value of the test to indicate how data are consistent with the null hypothesis (the sample does not belong to the predicted subgroup). Significant functional annotation clusters enriched in differentially expressed genes between control and tamoxifen-treated
HRasV12-shp53-Cre-ER-IdcTKO tumors were predicted using the Database for Annotation, Visualization and Integrated Discovery (DAVID; Bioinfor-matics Resources at the National Institute of Allergy and Infectious Dis-eases, NIH). The microarray expression data have been deposited in the ArrayExpress database (accession no. E-MTAB-1303).
Statistics. Results are expressed as mean ± SD or mean ± SEM, as indi-cated in figure legends, for the indiindi-cated number of observations. Statis-tical significance was determined by the unpaired 2-tailed Student’s t test using GraphPad Prism 4.0 software (GraphPad Inc.). P values are indi-cated in figure legends.
Study approval. All animal studies were reviewed and approved by the IACUC at Columbia University.
Acknowledgments
We thank Stefano M. Pagnotta and Michele Ceccarelli for their help with computational analyses. This work was sup-ported by National Cancer Institute grants R01CA101644 and R01CA131126 (to A. Lasorella) and R01CA085628 and R01CA127643 (to A. Iavarone) and National Institute of Neuro-logical Disorders and Stroke grant R01NS061776 (to A. Iavarone). F. Niola and P. Zoppoli are supported by a fellowship from the Italian Ministry of Welfare/Provincia di Benevento. A. Verrico is a visiting scientist from the Department of Pediatrics, University Federico II, Naples, Italy.
Received for publication March 12, 2012, and accepted in revised form October 11, 2012.
sion lines were plotted, and the number of cells required to generate at least 1 sphere in every well (the stem cell frequency) was calculated. The experiment was repeated twice.
Lentiviral production. pLKO.1 lentiviral expression vectors carrying shRNAs were purchased from Sigma-Aldrich. The hairpin sequence targeting the
RAP1GAP gene is CCTGGTATTCTCGCTCAAGTA. pLOC-GFP lentiviral expression vectors carrying RAP1A or Rap1GAP cDNA were purchased from Open Biosystems. The RAP1-G12V;Q63E mutant was generated using the Phusion Site Direct Mutagenesis Kit (New England Biolabs). Lentivirus preparation and infections were performed as described previously (26).
Clinical outcome analysis. Expression profiles and clinical information for 1,043 newly diagnosed patients with HGG from the data sets were analyzed (20, 38–40). The platform for all 4 data sets was Affymetrix based and used 2 different chip types: U95Av2 and U133A. Microarray data sets were batch normalized using a previously described method (52). Following batch normalization, we calculated the median value of the bHLH transcription factors and categorized the data for each sample as “0” (if below the median) or “1” (if at or above the median). Since the direction of the survival asso-ciation was opposite between the bHLH transcription factors and targets compared with the ID genes, we categorized the ID gene expression as “1” if it was below the median and “0” if it was above the median. Gene combina-tions were then added, with equal weightings for each gene, for each sample. Proportional hazards regression analysis with the 5-gene signature was used to calculate the effect of the integrated tumor score on survival.
Biochemical methods. The levels of active GTP-bound RAP1 were deter-mined using the Active RAP1 Pull-Down and Detection Kit (Pierce) accord-ing to the manufacturer’s instruction. Proteins were analyzed by immuno-blotting using an anti-RAP1 antibody. RAP1 activity in Id1L/LId2L/LId3L/L astrocytes, transformed by the expression of EGFRvIII-Cre-ER-shp53 and transduced with a pLOC-GFP-RAP1AG12V;Q63E or pLOC-vector-GFP lentivirus, was measured as described above.
RNA preparation and real-time quantitative PCR. RNA preparation and real-time quantitative PCR were performed as described previously (26, 51). Primers used in real-time quantitative PCR are listed in Supplemental Table 4. The relative amount of specific mRNA was normalized to 18S. Results are presented as the mean ± SD of triplicate amplifications.
Intracranial injections, tamoxifen treatment, and tumor volume evaluation. Intracranial injection of Ras-V12-IRES-Cre-ER-shp53 lentivirus was performed in 4-week-old Id-cTKO mice in accordance with guidelines of the International Agency for Research on Cancer’s Animal Care and Use Committee. Briefly, 1.3 μl purified lentiviral particles in PBS (1 × 10⁹/ml)
were injected 1.45 mm lateral and 1.6 mm anterior to the bregma and 2.3 mm below the skull using a stereotaxic frame (Kopf Instruments). Ortho-topic implantation of mouse glioma cells was performed as described previously using 50,000 cells in 2 μl phosphate buffer (26). Tamoxifen was administered using a feeding needle for 4 days at 9 mg/40 g of mouse weight, starting 12 days after surgery and at biweekly intervals thereafter for 3 additional cycles. Mice were monitored daily and sacrificed when neurological symptoms appeared. Tumor volume was obtained using 3-dimensional measurements in the formula for an ellipsoid: (length ×
width × height × [π/6]). The dimensions were derived from a complete, H&E-stained, histological sectioning of the mouse brain. The length was determined by counting the number of sections containing tumor cells and multiplying it by the section thickness. The width and height mea-surements were taken from the section that showed the largest tumor area (53). Kaplan-Meier survival curve was generated using the DNA Statview software package (AbacusConcepts).
Xudong Zhao’s present address is: Kunming Institute of Zoology, Chinese Academy of Sciences, Kunming, Yunnan, China.
Francesco Niola’s present address is: Neuroscience and Brain Technologies, Italian Institute of Technology, Genoa, Italy. Address correspondence to: Antonio Iavarone or Anna Lasorella,
1130 Saint Nicholas Avenue, New York, New York 10032, USA. Phone: 212.851.5245; Fax: 212.851.5267; E-mail: ai2102@colum-bia.edu (A. Iavarone). Phone: 212.851.5240; Fax: 212.851.5267; E-mail: al2179@columbia.edu (A. Lasorella).
1. Ohgaki H, Kleihues P. Population-based studies on incidence, survival rates, and genetic alterations in astrocytic and oligodendroglial gliomas. J Neuro-pathol Exp Neurol. 2005;64(6):479–489.
2. Park DM, Rich JN. Biology of glioma cancer stem cells. Mol Cells. 2009;28(1):7–12.
3. Stiles CD, Rowitch DH. Glioma stem cells: a mid-term exam. Neuron. 2008;58(6):832–846. 4. Calabrese C, et al. A perivascular niche for brain
tumor stem cells. Cancer Cell. 2007;11(5):69–82. 5. Charles N, et al. Perivascular nitric oxide activates
notch signaling and promotes stem-like character in PDGF-induced glioma cells. Cell Stem Cell. 2010; 6(2):141–152.
6. Lathia JD, et al. Integrin alpha 6 regulates glioblas-toma stem cells. Cell Stem Cell. 2010;6(5):421–432. 7. Venere M, Fine HA, Dirks PB, Rich JN. Cancer
stem cells in gliomas: identifying and understand-ing the apex cell in cancer’s hierarchy. Glia. 2011; 59(8):1148–1154.
8. Lathia JD, Heddleston JM, Venere M, Rich JN. Deadly teamwork: neural cancer stem cells and the tumor microenvironment. Cell Stem Cell. 2011; 8(5):482–485.
9. Perk J, Iavarone A, Benezra R. Id family of helix- loop-helix proteins in cancer. Nat Rev Cancer. 2005; 5(8):603–614.
10. Wu Y, Richard JP, Wang SD, Rath P, Laterra J, Xia S. Regulation of glioblastoma multiforme stem-like cells by inhibitor of DNA binding proteins and oligodendroglial lineage-associated transcription factors. Cancer Sci. 2012;103(6):1028–1037. 11. Lyden D, et al. Id1 and Id3 are required for
neuro-genesis, angiogenesis and vascularization of tumour xenografts. Nature. 1999;401(6754):670–677. 12. Nam HS, Benezra R. High levels of Id1 expression
define B1 type adult neural stem cells. Cell Stem Cell. 2009;5(5):515–526.
13. Niola F, et al. Id proteins synchronize stemness and anchorage to the niche of neural stem cells. Nat Cell Biol. 2012;14(5):477–487.
14. Vandeputte DA, et al. Expression and distribution of id helix-loop-helix proteins in human astrocytic tumors. Glia. 2002;38(4):329–338.
15. Massari ME, Murre C. Helix-loop-helix proteins: regulators of transcription in eucaryotic organ-isms. Mol Cell Biol. 2000;20(2):429–440.
16. Anido J, et al. TGF-beta receptor inhibitors target the CD44(high)/Id1(high) glioma-initiating cell population in human glioblastoma. Cancer Cell. 2010;18(6):655–668.
17. Jeon HM, et al. Inhibitor of differentiation 4 drives brain tumor-initiating cell genesis through cyclin E and notch signaling. Genes Dev. 2008; 22(15):2028–2033.
18. Jin X, et al. EGFR-AKT-Smad signaling promotes formation of glioma stem-like cells and tumor angiogenesis by ID3-driven cytokine induction. Cancer Res. 2011;71(22):7125–7134.
19. Barrett LE, et al. Self-renewal does not predict tumor growth potential in mouse models of high-grade glioma. Cancer Cell. 2012;21(1):11–24. 20. Phillips HS, et al. Molecular subclasses of
high-grade glioma predict prognosis, delineate a pattern of disease progression, and resemble stages in neu-rogenesis. Cancer Cell. 2006;9(3):157–173.
21. Marumoto T, et al. Development of a novel mouse glioma model using lentiviral vectors. Nat Med. 2009; 15(1):110–116.
22. Guha A, Feldkamp MM, Lau N, Boss G, Pawson A. Proliferation of human malignant astrocyto-mas is dependent on Ras activation. Oncogene. 1997;5(23):2755–2765.
23. Lee J, et al. Tumor stem cells derived from glioblas-tomas cultured in bFGF and EGF more closely mirror the phenotype and genotype of primary tumors than do serum-cultured cell lines. Cancer Cell. 2006;9(5):391–403.
24. Tropepe V, Sibilia M, Ciruna BG, Rossant J, Wagner EF, van der Kooy D. Distinct neural stem cells prolif-erate in response to EGF and FGF in the developing mouse telencephalon. Dev Biol. 1999;208(1):166–188. 25. Son MJ, Woolard K, Nam DH, Lee J, Fine HA.
SSEA-1 is an enrichment marker for tumor-initi-ating cells in human glioblastoma. Cell Stem Cell. 2009;4(5):440–452.
26. Carro MS, et al. The transcriptional network for mesenchymal transformation of brain tumours. Nature. 2010;463(7279):318–325.
27. Verhaak RG, et al. Integrated genomic analysis iden-tifies clinically relevant subtypes of glioblastoma characterized by abnormalities in PDGFRA, IDH1, EGFR, and NF1. Cancer Cell. 2010;17(1):98–110. 28. Bhat KP, et al. 2011. The transcriptional coactivator
TAZ regulates mesenchymal differentiation in malig-nant glioma. Genes Dev. 2011;25(24):2594–2609. 29. Boettner B, Van Aelst L. Control of cell adhesion
dynamics by Rap1 signaling. Curr Opin Cell Biol. 2009; 21(5):684–693.
30. Bos JL, et al. The role of Rap1 in integrin-mediated cell adhesion. Biochem Soc Trans. 2003;31(pt 1):83–86. 31. Caron E. Cellular functions of the Rap1 GTP-bind-ing protein: a pattern emerges. J Cell Sci. 2003; 116(pt 3):435–440.
32. Vuchak LA, Tsygankova OM, Meinkoth JL. Rap-1GAP impairs cell-matrix adhesion in the absence of effects on cell-cell adhesion. Cell Adh Migr. 2011; 5(4):323–331.
33. Endersby R, Zhu X, Hay N, Ellison DW, Baker SJ. Nonredundant functions for Akt isoforms in astrocyte growth and gliomagenesis in an ortho-topic transplantation model. Cancer Res. 2011; 71(12):4106–4116.
34. Bachoo RM, et al. Epidermal growth factor recep-tor and Ink4a/Arf: convergent mechanisms govern-ing terminal differentiation and transformation along the neural stem cell to astrocyte axis. Cancer Cell. 2002;1(3):269–277.
35. Rothschild G, Zhao X, Iavarone A, Lasorella A. E Proteins and Id2 converge on p57Kip2 to reg-ulate cell cycle in neural cells. Mol Cell Biol. 2006; 26(11):4351–4361.
36. Arthur WT, Quilliam LA, Cooper JA. Rap1 promotes cell spreading by localizing Rac guanine nucleotide exchange factors. J Cell Biol. 2004;167(1):111–122. 37. Sebzda E, Bracke M, Tugal T, Hogg N, Cantrell
DA. Rap1A positively regulates T cells via integrin activation rather than inhibiting lymphocyte sig-naling. Nat Immunol. 2002;3(3):251–258. 38. Freije WA, et al. Gene expression profiling of
glio-mas strongly predicts survival. Cancer Res. 2004; 64(18):6503–6510.
39. Gravendeel LA, et al. Intrinsic gene expression pro-files of gliomas are a better predictor of survival than histology. Cancer Res. 2009;69(23):9065–9072. 40. Petalidis LP, et al. Improved grading and survival
prediction of human astrocytic brain tumors by artificial neural network analysis of gene expres-sion microarray data. Mol Cancer Ther. 2008; 7(5):1013–1024.
41. Zhang L, et al. Identification of a putative tumor suppressor gene Rap1GAP in pancreatic cancer. Cancer Res. 2006;66(2):898–906.
42. Zhang Z, et al. Rap1GAP inhibits tumor growth in oropharyngeal squamous cell carcinoma. Am J Pathol. 2006;168(2):585–596.
43. Zheng H, Gao L, Feng Y, Yuan L, Zhao H, Corne-lius LA. Down-regulation of Rap1GAP via pro-moter hypermethylation promotes melanoma cell proliferation, survival, and migration. Cancer Res. 2009;69(2):449–457.
44. Zuo H, et al. Downregulation of Rap1GAP through epigenetic silencing and loss of heterozygosity pro-motes invasion and progression of thyroid tumors. Cancer Res. 2010;70(4):1389–1397.
45. Paik S, et al. A multigene assay to predict recur-rence of tamoxifen-treated, node-negative breast cancer. N Engl J Med. 2004;351(27):2817–2826. 46. Paik S, et al. Gene expression and benefit of
che-motherapy in women with node-negative, estrogen receptor-positive breast cancer. J Clin Oncol. 2006; 24(24):3726–3734.
47. Ablain J, Nasr R, Bazarbachi A, de Thé H. The drug-induced degradation of oncoproteins: an unexpected Achilles’ heel of cancer cells? Cancer Discov. 2011;1(2):117–127.
48. Guo Z, Li H, Han M, Xu T, Wu X, Zhuang Y. Mod-eling Sjogren’s syndrome with Id3 conditional knockout mice. Immunol Lett. 2011;135(1–2):34–42. 49. Pan L, Sato S, Frederick JP, Sun XH, Zhuang Y.
Impaired immune responses and B-cell prolifer-ation in mice lacking the Id3 gene. Mol Cell Biol. 1999;19(9):5969–5980.
50. Zhao X, et al. The N-Myc-DLL3 cascade is sup-pressed by the ubiquitin ligase Huwe1 to inhibit proliferation and promote neurogenesis in the developing brain. Dev Cell. 2009;17(2):210–221. 51. Zhao X, et al. The HECT-domain ubiquitin ligase
Huwe1 controls neural differentiation and prolif-eration by destabilizing the N-Myc oncoprotein. Nat Cell Biol. 2008;10(6):643–653.
52. Scherer A, ed. Batch Effects And Noise In Microarray Experiments: Sources And Solutions. Chichester, United Kingdom: J. Wiley Publisher; 2009. 53. Tomayko MM, Reynolds CP. Determination of
subcutaneous tumor size in athymic (nude) mice. Cancer Chemother Pharmacol. 1989;24(3):148–154. 54. Cancer Genome Atlas Research Network.
Compre-hensive genomic characterization defines human glioblastoma genes and core pathways. Nature. 2008;455(7216):1061–1068.
55. R Development Core Team, ed. R: A Language And Environment For Statistical Computing. Vienna, Aus-tria: R Foundation for Statistical Computing Pub-lisher; 2011.