© 2017, IRJET | Impact Factor value: 5.181 | ISO 9001:2008 Certified Journal | Page 3350
CFD Analysis and Melting Performance of PCMs in two dimensional
sphere
Sudha Tripathi
1, Archit Tomar
2Mechanical Engineering Department
Noida International University, Greater Noida, India -203201
---***---Abstract - Present days the demand of energy is increasingcontinuously because of high consumption of energy in transport, domestic and industrial sectors. Fossil fuel was only the source of energy that has fulfilled the needs of energy for long time. The high consumption of fossil fuel leads to decrease in availability of reserves and its effect is reflected on the price of fuel which is continuously increases and expected to continue for upcoming years. Solar energy is one of the most important, renewable and clean source of energy that can fulfill all the needs.
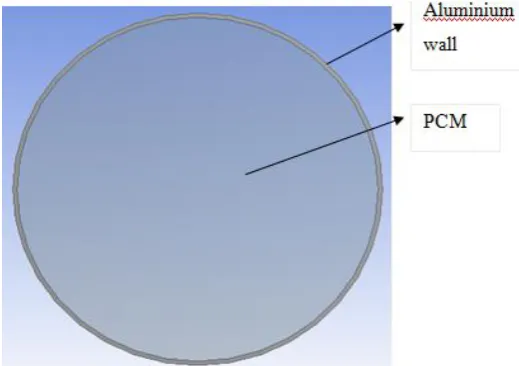
In the present numerical study and analysis a two dimensional sphere with hallow section is considered as test section. The grid independent test and time independent test are performed and chosen the appropriate grid size for numerical study. The diameter of hallow section of sphere is 84 mm. The aluminum wall thickness is 1 mm. The isothermal boundary condition is taken for numerical simulation. The three different PCMs (Paraffin wax, Sodium acetate tri-hydrate and Lauric acid) are tested for energy storage and for performance analysis. The energy stored by PCMs is compared. The melt fraction contour and temperature contour are also analyzed at different time of simulation.
Key Words: 2 D sphere, phase change materials, thermal
energy storage, CFD simulations, melting fraction.
Nomenclature
Symbol Parameter Cpl Specific heat (Liquid)
Cps Specific heat (Solid)
h Enthalpy
Kl Thermal Conductivity (Liquid)
Ks Thermal Conductivity (Solid)
L Latent heat
li liquid
Si Source term
s solid
T Temperature
Tm Melting Point
β Thermal expansion coefficient
γ Liquid fraction
μ Viscosity
ρl Density (Liquid)
ρs Density (Solid)
Abbreviations
LHTSS Latent heat thermal storage system
PCMs Phase changing materials
SAT Sodium acetate Trihydrate
SHS Sensible heat storage
LHS Latent heat storage
1. INTRODUCTION
Nowadays the demand of energy is increasing continuously because of high consumption of energy in transport, domestic and industrial sectors. Fossil fuel was only the source of energy that has fulfilled the needs of energy for long time. The high consumption of fossil fuel leads to decrease in availability of reserves and its effect is reflected on the price of fuel which is continuously increases and expected to continue for upcoming years. These fuels are harmful for environment as they are producing CO2 which is main constituent for causing green house effect, global warming etc. Solar energy is one of the most important, renewable and clean source of energy that can fulfill all the needs. Solar energy is intermittent in nature and not continuous, it depends upon weather, seasons, and climate conditions, that is the main drawback of Solar power but the problem of discontinuity can be solve by storing the energy. Thermal energy can be stored by two methods, Sensible heating and Latent heating. In sensible heat storage system thermal energy is stored by raising the temperature of material without change in phase and it is depends on mass, specific heat, temperature difference but in latent heat storage system the energy is stored by absorbing latent heat of material.
Y.chen. et al. [1] did numerical analysis using finite element simulation scheme in a rectangular enclosure filled with gallium as a phase change material including natural convection effect and compared with experimental data obtained by Gau and Vishkanta [2]. They chose gallium because its low melting point and its material properties which are available in literature
© 2017, IRJET | Impact Factor value: 5.181 | ISO 9001:2008 Certified Journal | Page 3351 melting of a pure metal(gallium) on a vertical wall. The
measurements of the position of the interface as well as distributions of temperature and temperature fluctuations were used as a qualitative indication of the natural convection flow regimes and structure in the melt during phase transformation taking place in a rectangular test cell heated or cooled from one of the vertical walls.
C.Gau et. al. [3] did an experimental investigation of both temperature distributions and temperature fluctuations of Lipowitz metal filled in a rectangular as well as analyzed the role of natural convection on solid-liquid interface motion during solidification and melting of Lipowitz metal. The measured and predicted solid-liquid interface positions during solidification from above and below, as well as melting from below and above, show reasonably good agreement.
B. Zivkovic et.al. [4] did an Numerical analysis of isothermal phase change of phase change material within rectangular and cylindrical containers, he mathematical model was based on an enthalpy formulation in which PCM temperature is only unknown variable. They used slightly modified enthalpy method, which enables decoupling of temperature and liquid fraction fields. Derivation of discretization equations is straight forward and the method itself is very easy to implement. The performance of this method was first verified with a one-dimensional phase change test problem explained in Voller (1990).The difference between this result and the result of X=0.8415 [m] obtained by Voller (1990) is nearly 0.12%. Therefore, it could be concluded that the accuracy of this model for conduction controlled isothermal phase change is satisfactory.
F.L Tan et.al. [5] investigated experimental and computational of constrain melting of a phase change material (PCM) in a spherical capsule. Paraffin wax n-octadecane was constrained during melting inside a transparent glass sphere through the use of thermocouples installed inside the sphere. The melting phase front and melting fraction of the PCM are analyzed and compared with numerical solution obtained from the CFD code Fluent and they observed that the nature of variation of temperature are same but small difference in the measured temperature data, melt fraction data and computational results along the centre line of sphere.
A. D. Brentet.al. [6] used the enthalpy-porosity approach melting of pure gallium in a rectangular cavity has been numerically investigated. In this work, they considered the influence of laminar natural-convection flow on the process of melting in two-dimensional dynamic model. Good agreement exists between the numerical predictions and experimental results available in the literature.
Vasiliosalexiades et.al. [7] analyzed the effect of grid size and scheme on Numerical solution and found that when the grid size is very fine and discretization scheme order is high the number of rolls of stream function increase.
S.D.Sharma et. al [8] make an effort to gather the data and information from the previous works on latent heat storage systems and phase change materials. The paper contains a list of about 250 PCMs and more than 220 references. This review will help to find the suitable PCM for various applications, different techniques for the measurement of thermo physical properties of phase change materials, suitable heat exchanger with ways to enhance the heat transfer and provide the various designs to store the heat using PCM for different applications i.e. heating, cooling, cooking, greenhouse, water heating and waste heat recovery systems. Recent innovations on PCM applications are included for the awareness about new applications. More applications are yet to be discovered.
Atul Sharma et.al [9] presented a review paper, In this paper they focused on the different thermal energy storage technology based on PCMs, also discussed about various method used for measuring the thermo physical properties of different phase change materials. This paper consists of brief disruption of different solar heating system like solar water-heating systems, solar cooking, solar air heating systems, solar green house, and space heating and cooling application for buildings, That paper also presents the melt fraction studies of the few identified PCMs used in various heat storage applications with different heat exchanger container materials.
From the literature survey, it is noticed that the PCMs overcome the energy demand. It is one of the safest sources of energy. There are few works [8-9] that have discussed property enhancement of PCMs. There is some review works PCMs [8]. The heat storage capacity of PCMs can be improved by adding some additives in PCM [8].
The objectives of the present numerical work are (i) to develop a numerical model for CFD analysis of PCMs in a two dimensional sphere (ii) to estimate melt fraction and temperature contours(iii) to compare the energy storage at a given time of simulation.
2. Methodology
2.1. Geometry
© 2017, IRJET | Impact Factor value: 5.181 | ISO 9001:2008 Certified Journal | Page 3352
2.2 Mesh generation
[image:3.595.35.295.169.352.2]The uniform structured meshing of test section is shown in Fig. 2. The element size of aluminum wall is 0.5 mm and the element size of PCM test section (cavity) is 1.0 mm.
Fig. 1 Geometry of 2 D sphere test section
Fig. 2 Meshing of 2 D sphere test section
2.3 Governing Equations
The enthalpy is used as a dependent variable along with temperature in enthalpy-porosity models. Tracking of melt interface explicitly is very difficult. So, a quantity called the liquid fraction comes in to play, which indicates the ratio of volume of liquid in a cell to the volume of cell in the domain. The liquid fraction is computed at each iteration, based on an enthalpy balance. The values of liquid fraction in mushy zone are always lies between 0-1. When the material is fully solid in cell the liquid fraction becomes 0 and velocity of particle drop to 0. The basic equation of the enthalpy-porosity model is:
Continuity Equation:-
( 1) Momentum Equation:-
(2) Energy Equation:-
(3)
Where,
ρ = density of liquid. V= velocity of fluid. H= enthalpy of material
The enthalpy of the material is written as the sum of the sensible enthalpy, h, and the latent heat, ΔH:
H=h+ΔH (4) Where,
(5) and
href = reference enthalpy Tref = reference temperature
Cp= specific heat at constant pressure
The liquid fraction γ can be defined as: γ= 0 if T <Tsolidus
γ=1 if T >Tliquidus
if Tsolidus< T <Tliquidus (6)
The latent heat content ΔH in equation 3.14 can now be written in terms of the latent heat of the material L:
ΔH=γL (7)
Si = source term used in momentum equation.
(8) Where,
C= mushy zone constant.
[image:3.595.62.261.389.572.2]© 2017, IRJET | Impact Factor value: 5.181 | ISO 9001:2008 Certified Journal | Page 3353
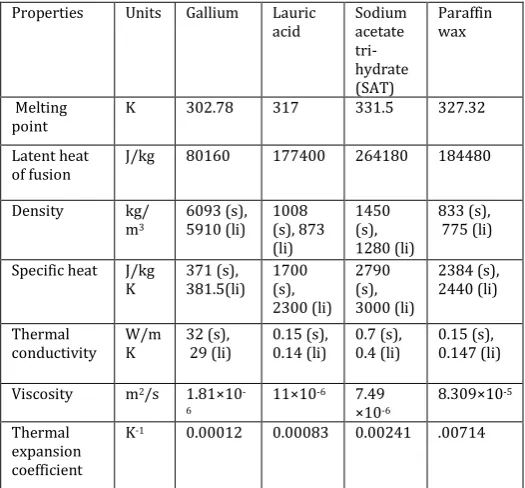
Table 1 Thermo-physical properties of paraffin wax, lauric acid and Sodium acetate tri-hydrate
Properties Units Gallium Lauric
acid Sodium acetate tri-hydrate (SAT) Paraffin wax Melting
point K 302.78 317 331.5 327.32
Latent heat
of fusion J/kg 80160 177400 264180 184480
Density kg/
m3
6093 (s),
5910 (li) 1008 (s), 873 (li) 1450 (s), 1280 (li) 833 (s), 775 (li)
Specific heat J/kg
K 371 (s), 381.5(li) 1700 (s), 2300 (li) 2790 (s), 3000 (li) 2384 (s), 2440 (li) Thermal
conductivity W/m K 32 (s), 29 (li) 0.15 (s), 0.14 (li) 0.7 (s), 0.4 (li) 0.15 (s), 0.147 (li)
Viscosity m2/s 1.81×10
-6
11×10-6 7.49
×10-6
8.309×10⁻⁵
Thermal expansion coefficient
K-1 0.00012 0.00083 0.00241 .00714
The following assumptions are used for solving the equations.
There exists unsteady state heat transfer condition. The effect of buoyancy-driven convection is
considered in the liquidphase PCMs. PCM is homogeneous and isotropic. The outer wall of sphere is insulated.
2.4 Boundary condition
The isothermal boundary condition is applied at aluminum wall. The temperature is 353 k assumed at boundary wall.
2.5 Computational procedure
2-D geometry is created in ANSYS FLUENT 2016. It is considered that the outer wall of 2 D sphere isothermal and properties PCMs are entered in fluid region. The pressure based and absolute velocity formulation SIMPLE algorithm is used to solve the momentum and continuity equations. Transient simulations were conducted to capture the velocity, temperature, melting and solidification fractions. Solidification and melting model based on enthalpy-porosity technique is used.
The first order upwind scheme is used for solving momentum and energy equations, simple scheme is used for pressure-velocity coupling and PRESTO scheme is used for pressure value at each control volume. Under relaxation
factors of 0.5, 0.6, and 0.9 were used for the solution of the momentum equations, the pressure correction equation, and the energy equation, respectively. A finite volume based ANSYS Fluent 2015 tool was used for running the CFD simulations. The liquid fraction was computed and recorded. Liquid fraction region lies in the range 0 to 1 and it is known as mushy zone (discussed later). Modeling of mushy zone is based on ‘pseudo’ porous medium and it decreases from 1 to 0 while the material solidifies.
3. Results and discussion
3.1 Grid independent test
Grid independent test was carried out on three different element sizes 1.25 mm, 1.0 mm and 0.75 mm. The results were compared in terms of temperature vs radial distance from x = 0 to 84 mm at time 500 s at isothermal temperature 353 K. It was observed that the nature of curve is similar for all the element sizes, but the average error between 1.0 mm and 0.75 mm was minimum (0.0132 %) comparatively the average error between the element sizes 1.25 mm and 1.00 mm (0.141 %). Therefore, for the remaining simulations, the element size 1.0 mm were selected in order to reduce the computational time.
3.2 Time independent test
Time independent test was carried out at different time steps. The optimized element size 1.0 mm was used for this test. This test was carried out at t = 600s at 353 K on different time steps size 1, 0.75, 0.5 and 0.25 so the total number of time step are 600, 800, 1200 and 2400. The maximum error between the number of time steps 600 and 800 are 0.346% and between 800 and 1200 is 0.206%. The error between the number of time steps 1200 and 2400 were very less (0.0361%). Therefore, 1200 was used as the time step for the remaining simulations.
3.3 Melting PCMs
3.3.1 Temperature contour of PCMs
© 2017, IRJET | Impact Factor value: 5.181 | ISO 9001:2008 Certified Journal | Page 3354 compared to other PCMs. Thus melting rate is also high for
[image:5.595.35.295.215.360.2]Sodium acetate tri-hydrate. The observed temperature distributions at 25 minute (1500s) are 324.79 K, 334.02 K and 336.84 K in Lauric acid, Paraffin wax and Sodium acetate tri-hydrate respectively. The melting completion time is discussed in further paragraph. The observed temperature distributions at 40 minute (2400s) are 336.28 K, 35.91 K and 349.89 K in Lauric acid, Paraffin wax and Sodium acetate tri-hydrate respectively.
Fig. 3 Comparison of average temperature of PCMs with time
(a)
(b) (c)
Fig. 4 Comparison of Temperature contour of PCM at time 600s (a) Lauric acid, (b) Paraffin wax and (c) Sodium
acetate tri-hydrate
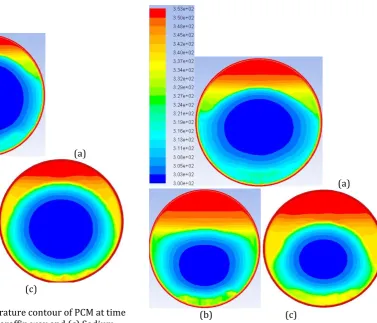
The comparison of temperature contour at 600s is shown in Fig. 4. A common color code scale is attached near Fig. 4a. The temperature distribution in Lauric acid, Paraffin wax and Sodium acetate tri-hydrate can be seen by color on surface of 2 D sphere. It can be observed from temperature contour the temperature distribution (red and yellow) in Sodium acetate tri-hydrate is more compared to other PCMs. The blue color (low temperature indication) is decreasing from Lauric acid to Paraffin wax and Paraffin wax to Sodium acetate tri-hydrate. It is observed that the average temperatures are 312.448 K, 316.74 K and 318.94 K in Lauric acid, Paraffin wax and Sodium acetate tri-hydrate respectively (Fig. 3) at time 600s. The average temperatures in all PCMs (Lauric acid, Paraffin wax and Sodium acetate tri-hydrate) are estimated by area weighted average method and it is discussed previously (Fig. 3).
The comparison of temperature contour at 900s is shown in Fig. 5. A common color code scale is attached near Fig. 5a. The rate of melting is more in Sodium acetate tri-hydrate compared to other PCMs due to its good thermal properties. It is observed that the average temperatures are 316.76 K, 322.95 K and 325.91 K in Lauric acid, Paraffin wax and Sodium acetate tri-hydrate respectively (Fig. 3) at time 900s.
(a)
(b) (c)
Fig. 5 Comparison of Temperature contour of PCM at time 900s (a) Lauric acid, (b) Paraffin wax and (c) Sodium
[image:5.595.159.537.399.722.2] [image:5.595.35.288.402.697.2]© 2017, IRJET | Impact Factor value: 5.181 | ISO 9001:2008 Certified Journal | Page 3355 The comparison of temperature contour at 2100s is
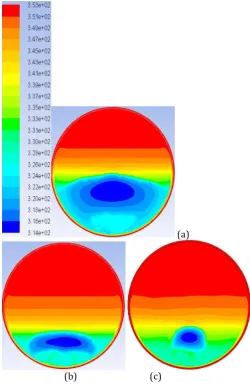
shown in Fig. 6. A common color code scale is attached near Fig. 6a. The temperature distribution in Lauric acid, Paraffin wax and Sodium acetate tri-hydrate can be seen by color on surface of 2 D sphere. At 2100s the temperature distribution in Sodium acetate tri-hydrate is more compared to other PCMs. It is observed that the average temperatures are 332.5 K, 343.34 K and 355.51 K in Lauric acid, Paraffin wax and Sodium acetate tri-hydrate respectively (Fig. 3) at time 2100s.
(a)
(b) (c)
Fig. 6 Comparison of Temperature contour of PCM at time 2100s (a) Lauric acid, (b) Paraffin wax and (c) Sodium
acetate tri-hydrate
3.3.2 Comparison of Melt fraction contour of PCM
The comparison of melt fraction distribution in Lauric acid, Paraffin wax and Sodium acetate tri-hydrate are shown in Fig. 7. The area weighted average method is used to estimate the melt fraction in all PCMs (Lauric acid, Paraffin wax and Sodium acetate tri-hydrate). In closed 2 D sphere with isothermal boundary condition the melting rate and temperature distribution are observed. At 10 minute
[image:6.595.34.285.227.618.2](600s) the observed melt fraction distributions are 29.4%, 29.5% and 30.53% in Lauric acid, Paraffin wax and Sodium acetate tri-hydrate respectively. The melt fraction slope of Sodium acetate tri-hydrate is more compared to other PCMs. Thus melting rate is also high for Sodium acetate tri-hydrate. The observed melt fraction distributions at 25 minute (1500s) are 55.7%, 6702% and 74.1% in Lauric acid, Paraffin wax and Sodium acetate tri-hydrate respectively. The melting completion time is 40 minute, 45 minute and 55 minute for Sodium acetate tri-hydrate, Paraffin wax and Lauric acid respectively. The observed melt fraction distributions at 40 minute (2400s) are 80.2%, 94.5 and 100% in Lauric acid, Paraffin wax and Sodium acetate tri-hydrate respectively.
Fig. 7 Comparison of melt fraction with time
[image:6.595.308.567.274.420.2]© 2017, IRJET | Impact Factor value: 5.181 | ISO 9001:2008 Certified Journal | Page 3356 (a)
(b) (c)
Fig. 8 Comparison of Melt fraction contour of PCM at time 600s (a) Lauric acid, (b) Paraffin wax and (c) Sodium
acetate tri-hydrate
The comparison of melt fraction contour at 900s is shown in Fig. 9. A common color code scale of melt fraction is attached near Fig. 9a. The rate of melting is more in Sodium acetate tri-hydrate compared to other PCMs due to its good thermal properties. It is observed that the average melt fractions are 38.5%, 43.4% and 47.2% in Lauric acid, Paraffin wax and Sodium acetate tri-hydrate respectively (Fig. 7) at time 900s. The above numerical value can be seen in Fig. 19. The melt fractions in all PCMs are estimated by area weighted average method and it is discussed previously (Fig. 7).
(a)
(b) (c)
Fig. 9 Comparison of Melt fraction contour of PCM at time 900s (a) Lauric acid, (b) Paraffin wax and
(c) Sodium acetate tri-hydrate
[image:7.595.35.562.42.482.2] [image:7.595.309.551.59.459.2]© 2017, IRJET | Impact Factor value: 5.181 | ISO 9001:2008 Certified Journal | Page 3357 (a)
[image:8.595.33.290.86.458.2](b) (c)
Fig. 22 Comparison of Melt fraction contour of PCM at time 2100s (a) Lauric acid, (b) Paraffin wax and (c)
Sodium acetate tri-hydrate
4. Calculation of Energy Storage at given time
Based on the previous methodology the data obtained from the simulation were further evaluated. The thermal energy that is stored by different PCMs at a particular time can be calculated by equation 9 and is discussed further.
4.1 Thermal energy stored by PCMs
Thermal energy which is stored at a particular time is sum of sensible heat and latent heat. Sensible heat can calculated by the relation Qs= mC(Tm-T) where m is mass of the liquid formed at particular time, C is specific heat and Tm & T are the melting and initial temperature respectively. Latent heat QL can be calculated by the relation QL= mL, where L is latent heat of fusion. The total heat stored in sphere at given time can be calculated by:
QT=Qs+QL (9) Thermal energy stored by Lauric Acid at 35 min:
m = 0.225 Kg
C= 1700 J/KgK Tm= 317 K T=300 K L= 177400 J/Kg
Sensible heat Qs= mC(Tm-T) =0.225×1700×(317-300) = 6517.78 Joule
Latent heat QL= mL =0.225×177400 =40008.81 Joule
Total energy stored= 46526.58 Joule.
4.2 Thermal energy stored by PCMs
[image:8.595.351.566.332.408.2]The thermal energy stored by different phase change materials at 35 minute are calculated by equation 9.and represented by table 2.
Table 2 Thermal energy storage by three PCMs at 35 min
PCMs Energy Storage (KJ)
Lauric Acid 46.52
Paraffin Wax 61.21
Sodium Acetate
Trihydrate (SAT) 152.902
The above Table 2 shows the comparison of energy storage by three different phase change materials after 35 min of starting of analysis. The data obtained by the simulation shows that the energy storage capacity of all PCMs are different and also found that storage capacity of Lauric acid and sodium acetate tri-hydrate is low and high respectively among three PCMs.
One can store 152.902 KJ of thermal energy in 35 min by using sodium acetate tri-hydrate as a phase change material in latent heat thermal storage system (2 D sphere with isothermal boundary). The table also shows that Lauric acid and Paraffin wax are not a good option for efficient thermal energy storage because its energy storage capacity are low compared to Sodium acetate tri-hydrate and these are 152.902 KJ approximate.
5. Conclusions
In this study, the two-dimensional numerical model was developed for thermal heat storage system. The heat storage materials were Lauric acid, Paraffin wax and Sodium acetate tri-hydrate. The melting behavior of PCM was predicted using the finite volume based CFD tool ANSYS Fluent.
© 2017, IRJET | Impact Factor value: 5.181 | ISO 9001:2008 Certified Journal | Page 3358 contour ware observed and compared at given time of
simulation. The melted PCMs were collected at top of 2 D sphere due to natural convection and gravity effect. The rate of melting in Sodium acetate tri-hydrate was more compared to Lauric acid, Paraffin wax due to its thermal properties. Thus at given time energy storage capacity was more in Sodium acetate tri-hydrate.
The energy storage by three different phase change materials at 35min were compared. The data obtained by the simulation was represented by the table. It was found that storage capacity of Lauric acid and paraffin wax were low and sodium acetate tri-hydrate was high among three PCMs. Sodium acetate tri-hydrate stored 152.902 KJ of thermal energy in 35min.
References
[1] Yinhengchen,Yong-TaekIm, and Junekey Lee “ Finite element simulation of solidification with momentum,heat and species transport”Journal of material processing Technology 48(1995) page 571-579.
[2] C. Gau and R. Viskanta,”Melting and solidification of a pure metal on a vertical wall” J. Heat Transfer, vol. 108, no. 1(1986) 174.
[3] C.Gau andR.Viskanta “Melting and Solidification of a metal systemin a rectangular cavity”Heat Mass Transfer. Vol. 27, No. 1, pp. 113-123, 1984
[4] B. Zivkovic, and I. Fujii. “An analysis of isothermal phase change of phase change material within rectangular and cylindrical containers”Solar EnergyVol. 70, No. 1, pp. 51–61, 2001
[5] F.L Tan, S.F. Hosseinizadeh,J.M. Khodadadi,andLiwu Fan.“Experimental and computational study of constrained melting of phasechange materials (PCM) inside a spherical capsule”International Journal of Heat and Mass Transfer 52 (2009) 3464–3472
[6] A.D.Brent,V.R.Voller, and K. J. Reid.“Enthalpy-porosity technique formodeling convection-diffusion phase change: application to the meltingof a pure metal”Numerical Heat Transfer, vol. 13, pp. 297-318, 1988
[7] Vasiliosalexiades,NoureddineHannoun,andTsun Zee Mai.“Tin melting: effect of grid size and scheme onthe numerical solution”Fifth Mississippi State Conference on
Differential Equations and Computational
Simulations,Electronic Journal of Differential Equations, Conference 10, 2003, pp. 55–69.
[8] Sharma, S.D., Kitano, H.,and Sagar, K., 2004, “Phase Change Materials for Low
Temperature Solar Thermal Applications,” Res. Rep. Fac. Eng. Mie Univ., 29,pp. 31-64.
[9] Sharma, A.,Tyagi, V.V., Chen, C.R.,andBuddhi, D., 2009,“Review on Thermal Energy
Storage with Phase Change Materials and Applications,” Renewable and Sustainable
Energy Reviews, 13(2), pp. 318–345.
[10] S.D. Sharma &Kazunobu Sagara.(,2005, “Latent Heat Storage Materials and Systems: A Review,” International Journal of Green Energy, 2(1), pp. 1–56.
[11] Cubberley, W. H., Metal Handbook—Properties and Selection: Nonferrous Alloys and Pure Metals, 9th edn., American Society of Metals, MetalsPark, OH, 1979, pp. 736-737