© 2017, IRJET | Impact Factor value: 6.171 | ISO 9001:2008 Certified Journal | Page 1337
PLANT MONITORING USING IMAGE PROCESSING,
RASPBERRY PI & IOT
Prof. Bhavana Patil
1,Mr. Hemant Panchal
2, Mr. Shubham Yadav
3, Mr. Arvind Singh
4,
Mr. Dinesh Patil
51
Professor, Dept. of electronics and telecommunication, A.C.Patil College, Navi Mumbai, Maharashtra, India
2,3,4,5
Student,
Dept. of electronics and telecommunication, A.C.Patil College, Navi Mumbai, Maharashtra, India---***---Abstract -
In India, 70% of its people are in theAgriculture sector. The remaining 30% of people are an inseparable part of this field. Because from agriculture, we get various raw materials and especially crops, which serve as a staple food for people. But The crops and plantations get destroyed mainly due to two major reasons, first reason is destruction by natural calamities such as flood, earthquake, drought, famine, etc. and second reason is the destruction by the pathogens.98% of the destruction is caused by the pathogens and 2% of the destruction happens due to natural calamities. So the need for the plant disease detection was felt. The traditional methods were inaccurate and not effective. So various researches in this field lead to inclusion of image processing for accurate detection of disease by using plant leaf. Various spots, patterns on plant leaf are useful in detecting the disease. Further advancement was use of digital image processing for more accurate results. On referring various reputed IEEE, international conference and international journal papers regarding this field, it was found that none of these suggest remedy for curing the plant disease.
Key Words: component; formatting; style; styling;
1.
INTRODUCTION
In India, Farmers have a great diversity of crops. Various pathogens are present in the environment which severely affects the crops and the soil in which the plant is planted, thereby affecting the production of crops .Various disease are observed on the plants and crops .The main identification of the affected plant or crop are its leaves. The various coloured spots and patterns on the leaf are very useful in detecting the disease. The past scenario for plant disease detection involved direct eye observation, remembering the particular set of disease as per the climate, season etc. These methods were indeed inaccurate and very time consuming. The current methods of plant disease detection involved various laboratory tests, skilled people, well equipped laboratories etc. These things are not available everywhere especially in remote areas. The method which I am implementing insures the automatic detection of crops. The very first implementation of plant disease detection using image processing was done by shen weizheng, wu yachun, Chen
zhanliang and Wei hongda in their paper [9].The method which I am implementing makes use of digital image processing for plant disease detection.
2.
LITERATURE SURVEY
© 2017, IRJET | Impact Factor value: 6.171 | ISO 9001:2008 Certified Journal | Page 1338 nod .of neurons in the input layer and increase the speed
of neural networks. Maintaining the Integrity of the Specifications
3
.STEPS FOR PLANT DISEASE DETECTION
3.1 IMAGE ACQUISITION
The images of the plant leaf can be acquired using two ways. First way is to capture image using the external camera, here we have used iball web camera and second way is to get the image from the email etc. The input image is converted to color space.
Fig.(3-1) image acquisation
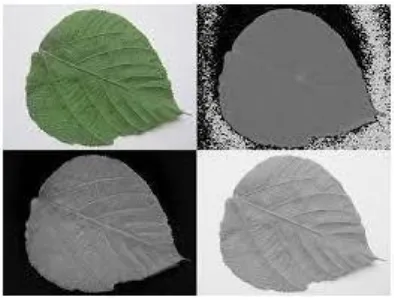
3.2 IMAGE PRE-PROCESSING
To remove the noise in the image, different pre processing techniques are considered such as image clipping for obtaining the concerned area by cropping; image smoothing is done to reduce in the obtained image by using the smoothing filter. Image enhancement is done to increase the contrast
.
Fig.(3-2) image cropping example
Fig.(3-3) image smoothing
Fig.(3-4) enhanced image of leaf
3.3
IMAGE SEGMENTATION
Segmentation means partitioning of images into various part of the same feature or having some similarity. The segmentation can be done using Otsu’s method, K means clustering, converting RGB to HSI model etc. The K means clustering is used for classification of the object based on a set of the features into K no. of classes. The classification of the object is done by minimizing the sum of the square of the distance between the object and the corresponding cluster.
© 2017, IRJET | Impact Factor value: 6.171 | ISO 9001:2008 Certified Journal | Page 1339 3.4 FEATURE EXTRACTION
Feature extraction plays an important role for identification of an object. In many application of image processing, feature extraction is used. T he features which can be used in plant disease detection. In paper [3], Monica jhuria et al considers color, texture and Morphology as a feature for disease detection. They have found that morphological result gives better result than the other features. Texture means how the color is distributed in the image, the roughness, hardness of the image. It can also be used for the detection of infected plant areas. Color, texture, morphology, etc. are the features which can be used in plant disease detection. In my project for feature extraction, we have converted the image to grey scale. The image which is in the color space is converted into grey image using,
F(x) =0.2989*R+0.5876*G+0.114.*B.
Fig. (3-6) Feature extraction
3.5 CLASSIFICATIONS
For the classification and the detection, we have used SVM (support vector machine) with .mat file. The SVM is the supervised learning model with associated learning algorithm that analyzes data used for classification and regression analysis. A SVM constructs a hyper plane or a set of hyper planes in a high or infinite dimensional space which can be used for classification, regression or other tasks. Intuitively, a good separation is achieved by the hyper plane that has the largest distance to the nearest training-data point of any class (so-called functional margin), since in general the larger the margin the lower the generalization error of the classifier. The.mat file store the various features of the affected leaf.
4. BASIC TYPES OF PLANT FAMILIES
4.1 MONOCOT FAMILY PLANT
These type plants have one seed leaf. The vein structures of Monocot family plants are parallel and straight wheat, ginger, corn, rice, millet.
4.2 DICOT FAMILY PLANT
These type plants have two seed leaves. The vein structures of Dicot family plants are nested and complex structure. Cotton, potatoes, tomatoes, beans, honeysuckle, roses.
5. FRUIT SIZE DETECTING AND GRADING
5.1 PROCESSING FLOW
Fig (5-1) fruit image size detection and grading
Take apple as the processing example, according to, the apple size is its diameter, which is the longest distance in the apple’s cross section. So the detecting program is focused on how to calculate the diameter in an apple side view image. The fruit image size detecting and grading processing flow.
5.2 COLOR DETECTION
In the process of fruit color is detected according toRGB values; here fruits are sorted according to color and size. So for e.g. two fruits are considered say tomato having red color and guava having green color, so in this step work is going to find out color of a fruit by using RGB values of an image taken from the camera, this image can be processed by using MATLAB software and accordingly color can be detected i.e. green or red.
Color detection algorithm:
1) Start
2) Read the input color image using imread function. 3) Read the input pixel of color image in three different planes (RGB) and store it into three variable r, g, and b. 4) Read the small region of fruit to detect color of fruit. 5) Store in different variable r1, g1, b1.
[image:3.595.311.558.322.387.2] [image:3.595.63.260.333.483.2]© 2017, IRJET | Impact Factor value: 6.171 | ISO 9001:2008 Certified Journal | Page 1340 7) Compare the value with threshold.
8) If g2>threshold, Color detected is green. 9) If r2>threshold, Color detected is Red. 10) End
.
5.3 EDGE DETECTION
Once color is detected, there is a need to find out size of a fruit. The size of circular shaped fruit is its diameter. The edge extraction is key factor for size detecting. After gray image, the most powerful edge-detection method that finds edge is the canny method.
The Canny method differs from the other edge-detection methods in that it uses two different thresholds (to Detect strong and weak edges) and includes the weak edges in the output only if they are connected to strong edges. This method is therefore less likely than the others to be fooled by noise, and more likely to detect true weak edges.
5.4 FRUIT SIZE DETECTING ALGORITHM
In order to calculate this diameter, the fruit’s natural symmetry is considered, so the fruit size detecting algorithm based on its symmetry mainly contains two parts: finding the center coordinates of fruit’s shape in image and finding fruit’s axis in image . The algorithm is described as follows:
Finding the center coordinate of fruit’s shape in image: The center coordinate can be easily calculated once finding the edge sequence points. Suppose the finding edge sequence point is q (xi, yi), i=1, n. the center coordinates of fruit’s shape is (cx, cy).
6. PLANT MONITORING SYSTEM OVERVIEW
Fig (6-1) monitoring system
Shown in figure , components of the automatic plant monitoring system on Raspberry Pi Model-B and Arduino Uno are demonstrated. The system can notify using a real-time alarming system to smart phones reporting such as the current and daily highest/lowest temperature, humidity, and weather quality of the farm surroundings. Users can also control the filter fan switches and customize the notification system to the smart phone.
7
.
MONITOURIN SYSTEM METHODOLOGY
7.1
RASPBERRY PI
Raspberry Pi is a small computer board working on the Linux operating system which connects to a computer monitor, keyboard, and mouse. Raspberry Pi can be applied to a electronic structure and programming network work, it can also serve as a personal computer and Apache Webserver, MySQL could be installed in the board.
A GPIO pin can be used as either a digital input or a digital output, and both operate at 3.3V. Unlike the Arduino, the Raspberry Pi which does not have any analog inputs. For that you must use an external analog-to-digital converter(ADC) or connect the Pi to an interface board must be used.
7.2
ARDUINO
Arduino is an open-source microcontroller compatible with developed platforms. The controller appears not to be expensive and uses low electrical power, 5.5 volts. C and C++ were employed for this development. Arduino can connect to a computer via the Universal Serial Bus (USB) and perform with compatible connected accessories in both analog signal and digital signal. The Arduino is a microcontroller platform, mounted on a board that plugs easily into most computers. It allows the user to program the onboard Atmega chip to do various things with programming language, in programs called sketches.
7.3
HUMIDITY SENSOR MODULE
[image:4.595.42.284.520.714.2]© 2017, IRJET | Impact Factor value: 6.171 | ISO 9001:2008 Certified Journal | Page 1341
7.4
GAS SENSOR MODULE
The module works as a Air Quality Detection Gas Sensor, this is sensitive to gas dangerous to human, applied to measure NH3, NOx, Alchohol, Benzene, CO, and CO2. The module is also used for controlling weather conditions and air cleaners in buildings. The measurement unit is presented in a analog signal.
In this research, three censor forms were used, consisting of MQ-2, MQ-135, and MQ-136 because of its gas measurement differences.
7.5
PHOTOSENSITIVE SENSOR MODULE (LDR)
A light sensor was used for measurement of light intensity especially for naked eye light, its unit is called Lux . Light Dependent Resistor (LDR) is a light sensitive resistance changing electronic resistance when there is a light incidence, called Photo Resistor or Photo Conductor. The resistor was made from Semiconductor, Cadmium Sulfide (Cds) or Cadmium Selenide (CdSe). These two substances are semiconductors coated in a ceramic sheet as a base.
7.6
HARDWARE CONNECTION
The Raspberry Pi and Arduino were connected via UART. The connection was a serial communication as Full Duplex since there was two-ways that data could be transmitted via pin TX and RX. A direct connection between the Raspberry Pi and Arduino was prohibited, because of its electrical potential differences, which is 3.3 volts for the Raspberry Pi and 5 volts for the Arduino. Bi-directional Logic Level Converter should be used to separate them. A connection between a camera and Raspberry Pi by applying Common System Interface (CSI) serves as a point to point connection, providing a fast data transmission and low energy consumption. MJPG-Streamer is a basic program command copying data from a single input to multiple outputs. A photo could be presented in a network system accessing from a web browser on a computer. In this study, a photo from a camera would be taken to demonstrate on a smart phone. All sensors would be connected via Board Arduino and the data would be transmitted from UART to Board Raspberry Pi. Raspberry Pi works as a controller of a ventilator, notifying a working condition to the smart phone and served as a data sender to store in a server computer.
7.7
SOFTWARE
Fig (7-1) Flowchart of programming in Raspberry Pi
A connection between Raspberry Pi and smart phones was investigated in this study. Programming of a communication between a server and a client consisted of two perspectives. The Raspberry Pi would check whether there was any connected clients, if so, a mutual data transmission would be done. By doing this, an application would send the data via Socket referring to IP Address and Port in Transport Layer using TCP protocol.
[image:5.595.307.559.112.588.2]© 2017, IRJET | Impact Factor value: 6.171 | ISO 9001:2008 Certified Journal | Page 1342 database for processing. If the value surpassed threshold,
the over signal would be sent to GPIO pins to aware the analog signal.
3. CONCLUSIONS
The accurate detection and classification of the plant disease is very important for the successful cultivation of the crops, this can be done using digital image processing. In this project, the detection as wells the remedy for curing it is achieved. This project utilizes GSM so as to send the message to every kind of mobile handset. This project utilizes various image processing techniques which provide accurate results.
The proposed system is a demo version, so for a large scale production the number of cameras and length of conveyor system can be modified. This work presents new integrated techniques for sorting and grading of different fruits. Generally image capture is a big challenge as there is a chance of high uncertainty due to the external lighting conditions, so we are taking the advantage of gray scale image which are less effected to the external environment changes as well as beneficial for finding size of a fruit. Same way while collecting fruit from conveyor system by a main plate there is variation in the weight measurement of a fruit so further design can be modified so fruits can be collected stably. Speed and efficiency of a system can be further improved by using ARM9 or ARM11 processor for the same purpose.
REFERENCES
1. Sachin .D.Khirade, A.B.patil,” Plant disease detection Using image processing,”2015, International conference on computing communication control and automation, IEEE. J. Clerk Maxwell, A Treatise on Electricity and Magnetism, 3rd ed., vol. 2. Oxford: Clarendon, 1892, pp.68-73.
2. Vijai singh, Varsha, A.K.Mishra”Detection of unhealthy region of plant leaves using image processing and genetic algorithm”, 205, ICACEA, India. K. Elissa, “Title of paper if known,” unpublished.
3. Monica Jhuria, Ashwani kumar and Rushikesh Borse, ”Image processing for Smart farming, detection of Disease and Fruit Grading,” proceeding of the 2013, IEEE, second international conference on image Information processing.
4. Patil.J.K,Raj kumar,”Feature Extraction of diseased leaf images 2012,journal of signal and image processing.