© 2017, IRJET | Impact Factor value: 6.171 | ISO 9001:2008 Certified Journal
| Page 119
Kaolinite/Polypropylene Nanocomposites. Part 2: Spinning
Kilole Tesfaye Chaka
1, Luca Fambri
2, Nalankilli Govindan
31
Lecturer, Basic science and Engineering Research and Innovation Centre
3
Professor, Textile Chemistry Research and Innovation Centre
1,3
Ethiopian Institute of Textile and Fashion Technology (EiTEX), Bahir Dar University, Bahir Dar, Ethiopia
2
Professor, Department of Industrial Engineering, Trento University, Italy
---***---Abstract -
Nanocomposites fibers of different polypropylene(PP) –kaolinite were prepared by melt compounding using a two-step process: melt-spinning and hot drawing at various draw ratios. Draw ratio up to 23 with elastic modulus of 19 GPa was observed for K20-HP and draw ratio of 9.5 with 7.6 GPa for K10-ATO were observed. TEM and FESEM revealed good dispersion of the kaolinite nanoparticles in polypropylene matrix, although at higher concentrations and lower draw ratios the nanoparticles showed increasing tendency to form small agglomerates. Thus drawing of K30-HP-30B and K20-ATO nanocomposites is difficult due to large agglomerates formations. Uniform distribution of kaolinite improved mechanical properties of the composite fibers. In as-spun fibers only one relaxation peak can be observed while two peaks of and occurs for drawn fibersin DMA analysis. XRD also reveals a strong orientation of kaolinite along the chain axis after drawing of nanocomposites.
Key words: Polypropylene, Nanocomposites, kaolinte, Melt spinning, Drawing, XRD, DMA, TEM, FESEM
1. INTRODUCTION
Significant growth of polypropylene (PP) usage can be attributed to a combination of many factors, e.g. a good balance of physical and chemical properties. Moreover, low density, excellent thermal stability, chemical inertness along with wide design flexibility and simplicity of recycling makes PP an attractive construction material. Many studies have been performed to improve mechanical properties of PP fibers and films since 1964. PP can easily be drawn and crystallized so that high degrees of orientation and crystallinity can be achieved. The maximum values of Young’s modulus and tensile strength of PP fibers reported in the literature are 36–40 and 1.5 GPa, respectively [1]. Fibers of PP are employed in many end-use products thanks to their properties such as low density, resistance to moisture and chemicals, sufficient strength and easy processing [2].
PP fibers properties can be enhanced by melt mixing with nanosized particles like carbon nanotubes [3,4] and montmorillonite [5,6]. Nowadays, many reports have been focused on the addition of silica and/or fumed nanosilica (FS) to enhance mechanical properties of polyolefins [7,8] and PP fibers [9,10]. Rottstegge and coworkers [9] tested PP
(MFI = 15 g/10 min) fibers reinforced by fumed silica. The obtained materials were of good quality, however, modulus, strain and stress at break were only slightly higher than those of neat PP. Srisawat and coworkers [10, 11] studied the influence of FS addition on the properties of PP fibers using PP with high melt flow rate (MFI = 25 g/10 min). They observed not only a higher thermal stability and nucleation effect of the nanofiller, but also a remarkable increase in the tensile strength, as consequence of the incorporation of elongated and flattened silica particles during the spinning process. Dabrowska et al. [7] prepared nanocomposites fibers of isotactic polypropylene – fumed silica by melt compounding using a two-step process: melt-spinning and hot drawing at various draw ratios. At low concentrations the uniform distribution of fumed silica improved mechanical properties of the composite fibers, especially at higher draw ratios. Crystallinity and melting temperature of fibers were found to significantly increase after drawing. Higher tensile strength and creep resistance were achieved, while strain at break was rather insensitive to the filler fraction
Recent literature evidences a lot of progress in the nanofilled bulk materials; on the contrary, there are relatively a few publications on the PP-kaolinite fibers nanocomposites. Latest study found on PP-kaolinite fibers is by Dabrowska et al. [12] in which Polypropylene fibers at various kaolinites content in the range of 1 to 30 wt% were produced after direct mixing polypropylene and masterbatch, and compounding of selected formulation. The dispersion of nanoparticles enhanced the elastic modulus of PP, positively affected the stress at break, and decreased the strain at break for compositions at high nanofiller content.
In order to improve mechanical properties, it is necessary to apply very high stretching ratios. The stretching ratio, often referred as DR (draw ratio) is given by the ratio of the initial section of the fibers and the final section of the stretched fibers. If mass flow of material during the stretching process is constant, the stretching ratio is also given by the ratio between two speeds; the released (V1) and
collecting drums speed (V2).The schematic diagram for
© 2017, IRJET | Impact Factor value: 6.171 | ISO 9001:2008 Certified Journal
| Page 120
Fig.1 Scheme of drawing process.
Assuming a constant volume, draw ratio can be calculated according to Equation 1:
where, the values indicated by "i" represent the initial values of area and diameter respectively, while the values indicated by "f" are the final area and diameter values of fiber respectively.
2. MATERIALS AND METHODS
1) 2.1 Fiber spinning
[image:2.595.233.563.51.204.2]Monofilament fibers with the kaolinite fraction between 0 and 30 wt % were produced by Thermo Haake (Karlsruhe, Germany) PTW16 intermeshing co-rotating twin screw extruder (screw diameter16 mm, L/D ratio25, roddie diameter 1.50mm). The temperature profile from the hopper to rod die was gradually increased (T1=150°C,T2=170°C, T3=180°C, T4=190°C, T5=200°C). The extrusion process was performed by using different die size for extruding fibers and 3D print filaments. Accordingly the size of die used and extruded sample was given in Table 1.
Table 1 Die size used for extrusion of fibers and filaments for 3D printing
Sample
type Die diameter (mm) diameter (mm) Extrudate
Fibers 1.65 0.5 ± 0.1
Filament
for 3D 3 1.7
[image:2.595.58.268.580.641.2]Types of formulations for extrusion of fibers and filaments were as given in compounding sections, (Part 1 of our paper in this same journal). The collection of the fibers and filaments was carried out in a series of steps: the extruded sample leaving the extruder is cooled in a bath, successively passes through a pair of cylindrical shapes and guides that directs the movement of material and this material is collected on a bobbin fixed to an electric motor which has an inverter speed variation. The whole system is represented in Fig.2.
Fig. 2 Spinning units (a) external view of extruder with heating units (b) filament production units.
The extruder screws rotation was optimized in the range of 1 5 – 20 rpm and residence time of about 15 minutes depending on the material composition in order to produce fibers having a diameter of about 500 ±100 micron and a filament of about 1.7 mm. The spun fibers o r f i l a m e n t s were fast cooled in water at room temperature in order to eliminate orientation and drawing of the fibers immediately after the extrusion. Extruded sample of fibers are wrapped around a bobbin of diameter 40 or 50mm rotating at about 12 m/min, but the collection of filaments was done manually, because it is a difficult to wrap around a bobbin of about 50 mm diameter (fray-out) due to its thickness.
Spinning ratio (SR) can be given by the ratio between die diameter and extrudate diameter.
……….. Eq.2
where, is die diameter and is extrudate diameter.
Collection distance from extruder head is approximately one and half meter. Varying the collection speed induces the variation of stretch ratio on the filaments produced and this has the consequence to vary the diameter of the filaments. From here it can be deduced that by increasing or decreasing the speed of collection, which is playing with the electric motor, it is possible to obtain different diameters. The diameters of filaments obtained will decrease if the collection speed increases and vice versa.
2) 2.2 Fiberdrawing
The fibers from extrusion process were drawn in a hot-plate drawing apparatus 1.4 m length (SSM-Giudicisrl, Galbiate, LC, Italy) at 145°C,in order to obtain highly extended fibers. As-spun fibers were unreeled and wound by using acrylic bobbins of 40 or 50mm diameter rotating from10 upto150 rpm, corresponding to a constant feeding rate of 1.26 m/min and maximum collecting rate of about18.84m/min (nominal draw ratio of 15).
© 2017, IRJET | Impact Factor value: 6.171 | ISO 9001:2008 Certified Journal
| Page 121
assuming a constant volume, it can be calculated accordingto Equation 1 given above.
Fig.3.Photo of Drawing Machine.
The diameter was measured by using an optical microscope connected to image processing software (ImageJ®) and also micrometer was used. Fibers with various draw ratios from DR=3 up to DR=19 were produced. Nominal draw ratio of 1 is referred to as-spun fibers, whereas DR greater than 1corresponds to the nominal draw ratio of drawn fiber with the diameter reported.
2.3 Fibers Production
Compositions for fibers production were consider compounded formulations of F1 - 13 and F16 - 19 of three
different types of PP matrices (HP500, Atofina and HP500-Borealis blend) with various content of kaolinite (Part 1 of our paper in this same journal). These formulations are used for extrusion of fibers after grinding in to small sizes of about 2mm sizes. Extruded fibers of about 500 micron are drawn at 145 0C in order to increase filler orientation in matrix and
improve mechanical properties. As-spun fibers are characterized by TGA to analyse the effect of kaolinite on the thermal stability of PP at different content. As-spun and drawn fibers mechanical properties are analysed by Quasi-static tensile tests and DMA, while microstructural analysis was performed by TEM and FESEM, and XRD and DSC were used to monitor kaolinite crystal structure in the PP matrix as well as changes in the crystallinity of PP in the composites. Depending on their spinnability and drawability selected samples from extruded samples was given priority and their results were discussed in detail.
3. RESULS AND DISCUSSIONS
3) 3.1 Spinning and Drawing of Fibers
Production of fibers starts from spinning of compounded samples of different neat polypropylene and PP-kaolinite filled at different content. Accordingly three different PP are used for spinning of neat and kaolinite filled fibers: HP500
(neat HP, K10-HP and K20-HP), Atofina (neat ATO, K10-ATO and K20-ATO) and blend of HP with Borealis (K20-HP-20B and K30-HP-30B). The processing temperature in all types of composition gradually increased from the hopper to rod die in twin-screw extruders as follows: 150-170-180-190-200°C. Die diameters used in all case was 1.65 mm and output from the extruder die is assumed to be 1.65 mm. By changing the rotation per minute of twin-screw or collection rate different diameters fibers are collected. The variation in those speeds is also depending on the types of PP and its composite flowability.
The extruder screws rotation was optimized in the range of 1 5 – 20 rpm and residence time of about 15 minutes depending on the material composition. Thus varying collection speed induces the variation of stretch ratio on the fibers produced and this has the consequence to vary the diameter of the filaments. Minimum permitted speed by the electric motor of collecting bobbin of 50 mm was 75 rpm and fibers with a diameter from 0.55 to 0.65 mm were obtained. Fig.4 shows motor rpm versus fiber diameter by keeping screw rotation constant.
As-spun fibers were fast cooled in water at room temperature in order to eliminate orientation and drawing of the fibers immediately after the extrusion. The diameters of filaments obtained will decrease if the collection speed increases and vice versa. Extruded fibers of about 500 ± 100 micron on acrylic bobbin of 50 mm diameters are hot drawn at 145 0C in order to increase filler orientation in matrix and
improve mechanical properties.
0.1 0.2 0.3 0.4 0.5 0.6 100
200 300 400 500
Spe
ed
o
f c
ol
le
ct
io
n
(rpm
)
Fiber diameter (mm)
Fig.4 Speed of collection versus fibers diameter variation during spinning process.
Drawing process is the ratio between the collection (Rc) and
the feeding (Rf) rate and fiber draw ratio (DR) can be
© 2017, IRJET | Impact Factor value: 6.171 | ISO 9001:2008 Certified Journal
| Page 122
Table 2 Comparison of drawability of neat PP and kaolinite filled nanocomposites at different compositions.
Sample typ
e Kaolinite content (wt%)
Initial dia. (mm)
Speed (m/min)
Ma
xim
um
D
ra
w
R
at
io
Feeding Collection
HP
0 0.42 0.78 15.72 19.0
10 0.48 0.78 13.66 16.0
20 0.50 0.94 22.30 23.0
20-20B 0.40 0.94 15.83 16.0
30-30B 0.56 1.26 20.52 16.0
ATO 10 0 0.54 0.42 1.57 - 15.81 - 9.5 -
20 0.50 - - -
According to the results of drawing, Table 3.3, it was found that a draw ratio up to 19 for neat HP and a draw ratio up to 16 for K10-HP, K20-HP-20Band K30-HP-30B while draw ratio up to 23 was obtained for K20-HP. Maximum draw ratio of 9.5 were found for ATO-kaolinite nanocomposites at 10wt% of kaolinite content. Drawing of extruded filament of neat Atofina was not performed and the one with 20wt% of kaolinite is difficult due to formation of larger agglomerates as it were seen under morphological study.
4) 3.2 Quasi-Static Tensile Tests
Mechanical properties of as-spun and drawn fibers using different neat polypropylene as a matrix (HP type, ATO type and HP-B mixture) with kaolinite from 10 to 30 wt% of kaolinite are analysed. Effect of kaolinite content and drawing ratio on elastic modulus, strength at yield, strength at break, strain at yield and strain at break will be discussed in this section.
A first series of fibers was produced with Atofina PP MFI of 12 g/10min (ATO). Representative stress – strain curves of the quasi-static tensile tests for as-spun (DR = 1) fibers of neat ATO and ATO with 10wt% of nanofiller content are reported in Fig.5. As observed from stress vs strain curves addition of 10wt% kaolinite enhances the mechanical properties other than strain at break compared to neat Atofina PP. But at a higher composition of 20wt% of kaolinite, it gives much less mechanical properties other than elastic modulus compared to neat ATOand ATO-K10 nanocomposites due to formation of larger agglomerates as it was seen in microstructural study.
0 500 1000 1500 2000
0 5 10 15 20 25 30 35
Stres
s
(M
Pa)
Strain (%)
As-spun neat Atof As-spun Atof-K10
Fig.5 Representative tensile stress-strain curves of as-spun fibers of neat Atofina and Atofina nanocomposites
filled at 10wt% of kaolinite.
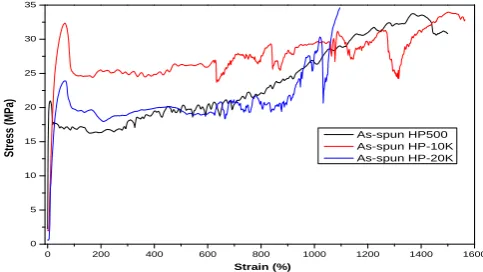
Another series of fibers was produced with HP500 MFI 1.8 g/10min (HP) and mixing it with Borealis MFI of 26 g/10min (B) at higher filler content. Representative tensile stress-strain curves of as-spun sample of neat HP and HP-kaolinite nanocomposites at 10wt% and 20wt% kaolinite content was shown in Fig.6.
0 200 400 600 800 1000 1200 1400 1600 0
5 10 15 20 25 30 35
Str
es
s
(MPa
)
Strain (%)
As-spun HP500 As-spun HP-10K As-spun HP-20K
Fig.6. Representative tensile stress-strain curves of as-spun fibers of neat HP and HP nanocomposites filled at
10wt% and 20wt% kaolinite.
[image:4.595.30.296.135.281.2] [image:4.595.320.562.382.518.2]© 2017, IRJET | Impact Factor value: 6.171 | ISO 9001:2008 Certified Journal
| Page 123
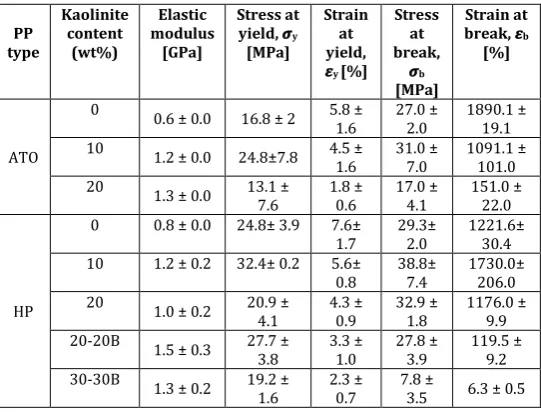
Table 3 Quasi-static tensile properties of as-spun HP, HP-B and ATO polypropylene and its nanocomposites fibers at
different kaolinite content.
PP type
Kaolinite content
(wt%)
Elastic modulus
[GPa]
Stress at yield, 𝝈y [MPa]
Strain at yield,
𝜺y [%]
Stress at break,
𝝈b [MPa]
Strain at break, 𝜺b
[%]
ATO
0 0.6 ± 0.0 16.8 ± 2 5.8 ±
1.6 27.0 ± 2.0 1890.1 ± 19.1 10 1.2 ± 0.0 24.8±7.8 4.5 ±
1.6 31.0 ± 7.0 1091.1 ± 101.0 20 1.3 ± 0.0 13.1 ±
7.6 1.8 ± 0.6 17.0 ± 4.1 151.0 ± 22.0
HP
0 0.8 ± 0.0 24.8± 3.9 7.6±
1.7 29.3± 2.0 1221.6± 30.4 10 1.2 ± 0.2 32.4± 0.2 5.6±
0.8 38.8± 7.4 1730.0± 206.0 20 1.0 ± 0.2 20.9 ±
4.1 4.3 ± 0.9 32.9 ± 1.8 1176.0 ± 9.9 20-20B 1.5 ± 0.3 27.7 ±
3.8 3.3 ± 1.0 27.8 ± 3.9 119.5 ± 9.2 30-30B 1.3 ± 0.2 19.2 ±
1.6 2.3 ± 0.7 7.8 ± 3.5 6.3 ± 0.5
Similarly for HP500 PP matrix it is important to understand that for all the compositions with high nanofiller content of as-spun fibers shows significantly higher elastic modulus as observed. In particular improvement from 0.75 GPa for neat HP500 up to 1.48 GPa for K20-HP-20B. Tensile stress at yield (y) slightly increases for the compositions with nanofillers
content of K10-HPand K20-HP-20B while for highest nanofiller content i.e. K30-HP-30B slightly lower values were observed. Improvement in yield strength can be a signal of good distribution of filler in a matrix.
Enhancement of the elastic modulus and strength at yield was observed together with lower strain at yield, especially very strong reduction in strain at yield (𝜺y) was observed for
the compositions with highest nanofiller content (K30-HP-30B). If the properties at break will be compared it can be noted that slight increase in stress at (K10-HP and K20-HP) relative to neat HP and reduction in other cases is observed. Strain at break shows a significant decrease as the content of fillers increases. It can be conclude that an introduction of a high melt flow index polymer (Borealis, MFI 26 g/10min) facilitates the uniform distribution of kaolinite in the K20-HP-20B matrix as the elastic modulus and yield strength is higher than that of K20-HP.
But as the content of filler increases it results in formation of agglomerates and decrease of mechanical properties is observed in K30-HP-30B (Table 3). Also extrusion of K20-ATO and K30-HP-30B filaments shows non-uniform distribution of fillers i.e. formation of agglomerates in longitudinal direction which acts as stress concentration centers, and results in decrease of mechanical properties and difficulty in drawing process. This experiment was performed in order to evaluate the effect of kaolinite content
on mechanical properties of PP nanocomposites and also effect of drawing by considering nanocomposites containing equal amount of kaolinite. Representative stress – strain curves of the quasi-static tensile tests for as-spun (DR = 1) and drawn fibers (DR=7) of Atofina and HP500 polypropylene matrix at 10 wt% of kaolinite content are reported in Fig.7.
0 200 400 600 800 1000 1200 1400
0 5 10 15 20 25 30 35
S
tr
es
s
(MP
a)
Strain (%)
K10-HP K10-ATO
DR=1
0 10 20 30 40 50
0 50 100 150 200 250 300 350 400 450
Stres
s
(M
Pa)
Strain (%)
K10-HP K20-ATO
DR = 7
Fig.7 Representative tensile stress-strain curves of (a) as-spun (b) drawn sample of neat PP and kaolinite filled
nanocomposites.
It is important to note that undrawn fibers manifest a clear yield point at a low strain followed by a wide plateau (of cold drawing) and a strain hardening region until the break point. During this phenomenon tensile strength further increases and the stress whitening, due to the crystallization of aligned macromolecules takes place [13]. Drawing process produces a strong orientation of the macromolecules along the draw direction and the strain-induced crystallization in the amorphous regions, which accounts for the increase in the fibers stiffness and the disappearance of yielding phenomena.
[image:5.595.321.546.196.431.2]© 2017, IRJET | Impact Factor value: 6.171 | ISO 9001:2008 Certified Journal
| Page 124
20wt% of kaolinite, better drawability with maximummodulus equal to 19 GPa was obtained (DR=23) in comparison to 11.5 GPa of neat PP (DR=19).
A negative effect of high concentrations of kaolinite on modulus is observed for composition with 30wt% of filler (K30-HP-30B) that results in decrease of modulus and drawability, which can be explained in terms of the aggregate formation and incomplete filler dispersion.
0 4 8 12 16 20 24
0 4 8 12 16 20
HP K10-HP K20-HP K20-HP-20B K30-HP-30B K10-ATO
Ela
st
ic
m
od
ul
us
(G
Pa)
Draw Ratio
Fig.8 Elastic modulus of neat and nanocomposites PP fibers with different fractions of kaolinite as a function of
draw ratio.
High melt flow PP, K10-ATO shows less drawability but has improved elastic modulus at lower draw ratio. Production of K20-ATO shows formation of high agglomerates which is difficult for drawability and analyzing mechanical properties. In case of 10 and 20wt% HP-kaolinite nanocomposites good dispersion of kaolinite aggregates within the matrix may lead to relatively lower stress concentration and cracking nucleation phenomena and consequently it is responsible for an improvement of strength properties.
It is well known that the stress at break of compositions usually decreases with the addition of the nanofiller. Fig.9 shows stress at break of different neat PP and PP-kaolinite nanocomposites at fractions of 10, 20 and 30 wt% of kaolinite filled fibers as a function of draw ratio.
0 2 4 6 8 10 12 14 16 18 20 0
200 400 600 800 1000
HP K10-HP K20-HP K20-HP-20B K30-HP-30B K10-ATO
Stres
s
at
b
rea
k
(M
Pa)
Draw Ratio
Fig.9 Stress at break of different neat PP and PP-kaolinite nanocomposites at fractions of 10, 20 and 30 wt% of
kaolinite filled fibers as a function of draw ratio.
Considering the results for fibers with 10, 20 and 30 wt% kaolinite content, it can be seen that higher stress at break was observed only at higher draw ratio. In particular for DR=12, stess for neat PP (800 MPa) was lower than reported for K20-P-20B (833 MPa). In this specific case it is important to understand differently from common cases where the stiffening effect is accompanied by reduction of the tensile strength, in this case of K20-HP-20B at high draw ratio of fibers a parallel enhancement of both modulus and stress at break was observed (Fig.9). In all other cases the stress at break of kaolinite filled PP is lower than that of neat HP polypropylene.
0 2 4 6 8 10 12 14 16 18 20
0 200 400 600 800 1000 1200 1400 1600 1800
HP K10-HP K20-HP K20-HP-20B K30-HP-30B K10-ATO
Strain
a
t b
rea
k
(%
)
Draw Ratio
Fig.10 Strain at break of different neat PP and PP-kaolinite nanocomposites at fractions of 10, 20 and 30 wt% of
kaolinite filled fibers as a function of draw ratio.
Strain at break versus draw ratio for different neat and PP-K nanocomposites fibers shown in Fig.10 illustrate a significant reduction of strain at break for a high draw ratio. In both neat and nanofilled fibers the behaviour was very similar in drawing process i.e. as the drawing ratio increases the strain at break decreases in both cases. The decrease of the strain at break for higher filler loading might be due to the decreased deformability at the interface between the filler and matrix.
From these results it is possible to conclude that for fibers drawn with higher draw ratio (DR>10) significant improvement in modulus is observed for 10 and 20wt% kaolinite and decrease in modulus for 30wt% filler content. Also at higher draw ratio stress at break of compositions decreases with the addition of the nanofiller, but it is improved at K20-HP-20B, and significant reduction of strain at break was observed. This behaviour can be related to the homogeneous kaolinite dispersion inside the polymer matrix, which enhanced the filler-polymer interfacial adhesion and is responsible for the improvement of mechanical properties.
3.3 Efficiency of Filler
The efficiency of filler (EF) for each composition is evaluated from the difference of nanocomposites modulus (ENC) and
© 2017, IRJET | Impact Factor value: 6.171 | ISO 9001:2008 Certified Journal
| Page 125
filler (f) and modulus of PP (EPP).This approach in the case ofaligned fillers is described by Equation 3.:
[image:7.595.328.535.452.711.2]The filler efficiency in Table 4 was calculated by taking modulus of 0.59 GPa for neat Atofina and 0.75 GPa for neat HP500 PP matrix at DR=1. These results implies that the effective crystallinity of 20 wt% kaolinite content is very poor compared to 10wt% kaolinite in Atofina polypropylene matrix. Depending on the tensile modulus effectiveness and other mechanical properties results observed for as-spun fibers it is easy to conclude that fibers of K20-ATO is difficult to be drawn. Therefore, the drawing process was selected preliminary for thefibers of K10-ATO nanocomposites and a maximum result ofdraw ratio of about 10 was found with 7.6 GPa of elastic modulus and strength of about 450 MPa.
Table 4. Values of filler efficiency for as-spun fibers.
Draw
ratio Fiber
Elastic modulus
(ENC) (GPa)
Filler fraction
from TGA efficiency Filler
1 K10-ATO 1.23 0.064 17
1 K20-ATO 1.27 0.156 7.4
1 K10-HP 1.2 0.074 8.1
1 K20-HP 1.07 0.164 2.4
1 K20-HP-20B 1.48 0.153 6.4
1 K30-HP-30B 1.31 0.242 3.1
In a similar manner the effective tensile modulus calculated for K10-HP and K20-HP with the results of 8.1 and 2.4, respectively shows that the efficiency of filler with 20 wt% kaolinite content is very poor compared to 10wt% kaolinite in HP polypropylene matrix.
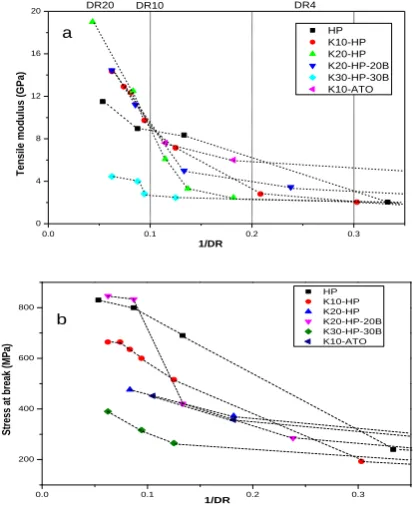
3.4 Draw ratio effect
Tensile modulus, stress at break and strain at break of neat HP and nanocomposites with different amount of kaolinite in HP and ATO matrix as a function of inverse of draw ratiowas shown in Fig.11, in order to evaluate the tendency of mechanical properties with drawing ratio.Mechanical properties such as tensile modulus, stress at break and strain at break as a function of inverse of draw ratiofor neat PP and nanocomposites with different amount of kaolinite were described below.
5) 3.5 Dynamic Mechanical Analysis (DMTA)
DMTA analysis was performed on the as-spun and drawn fibers at selected draw ratioson neat HP and K10-HP to obtain deeper information on mechanical properties and molecular mobility. Due to a very high surface area of the nanoparticles in the PP-kaolinite nanocomposites, the applied sinusoidal stress is expected to be easily transferred
from the matrix onto the kaolinite particles. Storage modulus (E') and loss modulus (E") of the neat HP and HP-kaolinite fibers in range -100 to 150°C are reported in Fig.12 (a) and (b) for as-spun and drawn fibers.
For DR = 1 there is an increase in the storage moduli with the nanofiller content, K10-HP, which is observed over all temperature range used (Fig.12a). With the drawing process, the storage modulus of neat PP and K-PP fibers increases over the whole temperature range used, which can be attributed due to the chain orientation induced by drawing (Fig.12b). Storage modulus of the composites with higher nanofiller fractions could be decreasing due to the formation of nanofillers aggregates, which reduces the filler effectivity. Similar to the storage modulus (E'), loss modulus (E") of PP-kaolinite composite fibers rises with the draw ratio and kaolinite content.
PP displays three relaxations (transitions, loss peaks) localized in the range of about –80°C ( ), 10°C ( ) and 100°C ( ), where is the dominant relaxation. In the crystalline polymers the transition is commonly considered to be associated with the molecular motion within the crystalline regions, the transition corresponds to the glass transition of the amorphous regions, and the transition is believed to be related to limited molecular motions of short chain sections in both amorphous regions and crystalline domains [14,15].
0.0 0.1 0.2 0.3 0
4 8 12 16 20
Te
ns
ile
m
od
ul
us
(GPa)
1/DR
HP K10-HP K20-HP K20-HP-20B K30-HP-30B K10-ATO
DR20 DR10 DR4
a
0.0 0.1 0.2 0.3 200
400 600 800
HP K10-HP K20-HP K20-HP-20B K30-HP-30B K10-ATO
Stres
s
at
b
rea
k
(M
Pa)
© 2017, IRJET | Impact Factor value: 6.171 | ISO 9001:2008 Certified Journal
| Page 126
0.0 0.1 0.2 0.3 0.95 1.00 1.05
[image:8.595.324.547.109.243.2]0 200 400 600 800 1000 1200 1400 1600 1800 HP K10-HP K20-HP K20-HP-20B K30-HP-30B K10-ATO Strain a t b rea k (% ) 1/DR c
Fig. 11.Mechanical properties: (a) Tensile modulus,(b) stress at break and (c) strain at break as a function of inverse of draw ratio for neat PP and nanocomposites with
different amount of kaolinite.
The intensity of the relaxation depends on various factors, such as crystalline fraction, orientation of the amorphous phase, and nanofiller fraction. For all as-spun fibers only one relaxation peak at around 13°C can be observed (Figure 3.20a), whose position does not significantly change with varying nanoparticle content. But for drawn fibers double peak was observed. Neat HP fibers at draw ratio of 10 shows double peaks at 23 0C and 76 0C while K10-HP at a draw ratio
of 10 shows two peaks at (15 and 0.9 0C) may be due to
defects and 85 0C and at draw ratio of 15 it shows double
peaks at -24 0C and 76 0C.
This implies that after drawing process, shifts to higher temperatures for neat HP from 13°C to 23°C at a DR = 10. However, it is quite unusual the values for K10-HP shifts to lower temperatures due to the drawing process. The effect was observed for drawn fibers (DR 10) and it can be attributed to the longitudinal defects developed during drawing that have been associated to a reduced density (and hence higher molecular mobility and lower , in accordance to literature results. In fact, the higher the drawing, the longer the extension of the band defects, almost along all the fibers length [16, 17] at very high draw ratio.
-100 -50 0 50 100
1000 2000 3000 4000 5000 Sto ra g e m o d u lu s (MPa ) Temprature(0 C) HP K10-HP 0 50 100 150 200 L o s s m o d u lu s (MPa ) a
-100 -50 0 50 100
0 5000 10000 15000 20000 25000 Sto ra g e m o d u lu s (MPa ) Temprature(0 C)
HP DR=10 10K-HP DR=10 10K-HP DR=15
[image:8.595.54.267.589.716.2]0 200 400 600 800 L o s s m o d u lu s (MPa ) b
Fig. 12 DMA results of storage and loss modulus for neat HP and K10-HP nanocomposites (a) as-span and (b)
drawn samples.
As far as the loss modulus peak is concerned, it can be seen that this relaxation is not observed for the as-spun fibers, while for drawn materials a peak occurs at 76 °C for neat HP at DR=10 and K10-HP at DR=15 and 85°C for K10-HP at DR=10. The magnitude of the loss modulus peak increases proportionally to the draw ratio and/or filler fraction. This enhancement observed after drawing is probably related to the increase in the fraction of crystalline phase induced by the drawing process. This relaxation shifts to higher temperatures with increasing nanoparticle content and/or draw ratio. Owing to the kaolinite content at DR = 10, the peak shifted from 76°C for neat HP to 85°C for K10-HP. It is believed that higher crystalline continuity and/or dimensions achieved at high draw ratios hinder the underlying molecular motion so that the onset of the transition is shifted towards higher temperatures [18, 19].
6) 3.6 XRD analysis
WAXS experiments were conducted to monitor kaolinite crystal structure in the PP matrix as well as changes in the crystallinity of PP in the composites. XRD Rietveld fitting of PP-Kaolinite powder using a modulated turbostratic model for the stacking disorder along the 001 direction was given in Fig.13.
The crystal information of PP is reflected predominantly on the higher angle 2 peaks. The peak at 18.580 in Fig.13 is
characteristic of the -phase which suggests that the PP matrix is predominantly in its -form both in the neat polymer and in the PP-kaolinite composites. Drawn fibers show the relative intensity of the peaks formation at 21.180
and 21.780, and the peak at 16.880 exhibits a significant
© 2017, IRJET | Impact Factor value: 6.171 | ISO 9001:2008 Certified Journal
| Page 127
Fig. 13 XRD Rietveld fitting of PP-Kaolinite powder using a modulated turbostratic model for the stacking disorder
along the 001 direction.
An additional peak formed for a drawn K10-HP fiber at 21.180 and 21.780 is attributed to a -form PP crystal lattice.
These results suggest that the crystal lattice structure of the PP matrix is altered, and also there is a characteristic peak of the -phase formation at 20.2780. This implies that there is a
significant change in crystallinity transform of the -phase structure into a -phase. This is also corroborated by the crystallization and melting temperatures obtained in DSC. The degree of crystallinity (the intensity and height of peaks) is decreasing with respect to nanoparticle addition which probably results from the presence of large agglomerates. This can be evidenced by looking the peak at 16.880 which
exhibits a significant decrease.X-ray transmission images of as-spun and drawn K10-HP fiberscollected in trasmission on a modified MAUD software development with an Image Plate detector was shown in Fig.14.
By Rietveldfitting [20, 21] of the X-ray fiber diffraction images, collected in transmission, polypropylene fibers dispersion could be obtained quantitatively along with the texture and deformation of the kaolinite basal planes. For instance, Fig.14 reports the raw diffraction image in transmission for as-spun K10-HP fibers of 500 micron and drawn fibers of 160 micron.
Thus after drawing the polypropylene-kaolinite shows a strong orientation along the chains axis, the kaolinite texture is characterized by a (001) fiber like orientation with the basal/faulted planes perpendicular to it.
7) 3.7 Microstructure characterization
Microstructural studies of K10-HP fibers of as-spun and drawn at different draw ratio was performed by TEM on ultra microtomed cross sections and it was compared with filaments for 3D printing and 3D printed filament. Also the dispersion of kaolinite in K20-HP-20B, K30-HP-30B and
K20-ATO fibers are evaluated by SEM on the fractured surfaces of the composites.
Fig.14 X-ray transmission image of HP fibers with 10% kaolinite (a) as-spun 500μm (b) after drawing 160μm
(DR=10).
8) 3.8 Transmission Electron Microscopy
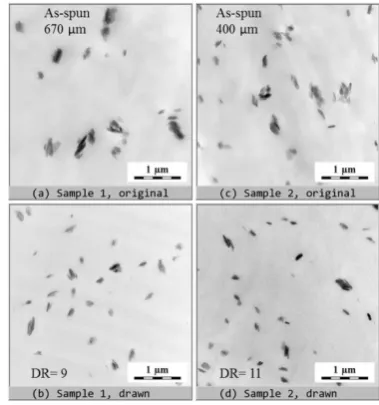
TEM images of ultramicrotomed cross sections of K10-HP and K20-HP as-spun fibers and with selected draw ratios are presented in Fig.15. A set of low-magnification micrographs of all studied composites shows that the kaolinite particles are dispersed quite uniformly in the polymer matrix, but frequently they tend to form small agglomerates. In general, the amount and size of the agglomerates decreases for drawn samples, that is TEM micrographs reveals that the kaolinite nanoparticle agglomerates are partially destroyed at higher draw ratios (Fig.15 b and d).
Fig.15 TEM micrographs of K10-HP at different diameters of as-spun and draw ratios (a) as-spun filaments of 670
μm (b) drawn fibers of 220 μm, DR = 9 (c) as-spun filaments of 400 μm (d) drawn fibers of 120 μm, DR = 11.
Even though TEM micrographs of K20-HP shows overcrowded kaolinite particles it is possible to observe improvement of kaolinite dispersion with drawing process. By comparing micrograph of K20-HP drawn at DR = 9 and
[image:9.595.311.557.135.233.2] [image:9.595.336.526.448.651.2]© 2017, IRJET | Impact Factor value: 6.171 | ISO 9001:2008 Certified Journal
| Page 128
DR = 20 it was clearly seen that dispersion anddisaggregation of kaolinite particles increases with draw (Fig.16b and c). The nanofiller dimensions are found between 1μm and 100nm. But it is very difficult to estimate exactly the size of the aggregates because they are non-isometric and randomly dispersed in matrix.
Fig.16 TEM micrographs of K20-HP of; (a) as-spun filaments of 680 μm (b) drawn fibers of 230 μm, DR = 9 (c)
drawn fibers of 150 μm, DR = 20.
The size of the aggregates is, therefore, strongly dependent on orientation of particles. It can be concluded that the drawing process induces the rupture of kaolinite aggregates and controls the intercalation and/ or partial exfoliation of kaolinite in the PP matrix, which accounts for improvement of the mechanical properties of nanofilled fibers.
9) 3.9 Field Emission Scanning Electron Microscopy
The dispersion of kaolinite in polypropylene was also evaluated by FESEM on the fractured surfaces of the composites. Fig.17(a)-(b) shows dispersion of fillers in the matrix of HP-20B with 20wt% kaolinite fibers.
Addition of 20 wt% Borealis (MFI of 26 g/10min) in HP500 (MFI of 1.8 g/10min) facilitates dispersion of kaolinite as shown in image of K20-HP-20B, Fig.17(a)-(b)even though there is tendency of formation of agglomerate due to hydrogen bonds formed between kaolinite particles. But at higher content of kaolinite i.e. for K30-HP-30B addition of Borealis does not facilitate the dispersion of kaolinite. As it is shown in fig.17(c)-(d) there is a lot of agglomeration which affect the properties of nanocomposites detrimentally. Fig.17(e)-(f) shows FESEM micrograph of Atofina (MFI of 12 g/10min) with kaolinite of 20 wt% and it reveals that there is a lot of kaolinite agglomerate formation.
Fig.17 a, c and ereveals formation of holes due to weak interfacial adhesion between PP and kaolinite and there is subsequent plastic deformation in the morphology of
kaolinite filled nanocomposites.This isdue to the wide difference in character between kaolinite and the PP matrix.The amount of holes also implies the content of kaolinite, i.e. the numbers of holes formed in K30-HP-30B is much higher than that of K20-HP-20B. As reported by the study of Xu et al.[39] the most common failure mechanism during the deformation process of particulate-filled polymer composite is debonding at the filler-matrix interface. From the micrograph Fig.17c at a magnification of 120 debonding process of kaolinite aggregates created large holes, which means that kaolinite filler can be pulled out completely from the PP matrix through the interfacial failure as the filler-matrix adhesion is relatively weak. The reason for poor adhesion between kaolinite and PP was probably because of the difference in surface free energy (or polarity).
© 2017, IRJET | Impact Factor value: 6.171 | ISO 9001:2008 Certified Journal
| Page 129
Fig.17(c)-(d).FESEM micrograph of the fractured surface of K30-HP-30Bfibers (a) X400 (b) X100,000.
Thus it is possible to conclude that the reduction in drawability and mechanical properties of fibers of K30-HP-30B and K20-ATO observed in drawing and mechanical testing is due to lack of kaolinite dispersion in polymer matrix and large agglomerate formation. These results show clearly the kaolinite content used in PP-kaolinite nanocomposites should be at a limited content.
Fig.17(e)-(f). FESEM micrographs of the fractured surface of K20-ATO fibers (a) X120 (b) X50,000.
In this case it is also better to understand that the formation of agglomerates is not only depending on kaolinite content but also on the polypropylene type.
10)3.10 Thermogravimetric Analysis (TGA)
In order to analyze the influence of nanofiller at different content on the thermal stability of HP, ATO and HP-B
mixture polypropylene, TGA analysis was performed in air atmospheres and representative TGA curves of fibers are reported in Fig.18. In these curves, it is possible to observe three different zones.
100 200 300 400 500 600 700
0 20 40 60 80 100
We
ig
ht
%
(%
)
Temperature(0
C)
[image:11.595.72.255.97.230.2]Atof/K10 Atof/20K HP/10K HP/20K HP/20B/20K HP/30B/30K
Fig. 18. TGA curves and its derivatives of neat and nanofiller PP-K fibers air atmosphere.
The first zone (30°C to 250°C) shows no significant weight loss, second zone (250°C up to 422°C) shows highmass loss due to thermal decomposition of polymer matrix and the last zone which is between temperature zones of (422°C up to 700°C) in air atmosphere, shows almost no significant mass loss since the residuals are not decomposed.
Table 5. TGA result of different PP/kaolinite nanocomposites fibers at different compositions.
Composition Theoretical Kaolinite (%)
% of Ashes at
700 0C
Difference 420-430°C % at
Neat HP 0 0 0 0.9
K10-HP 10.0 7.6 -2.4 10.1
K20-HP 20.0 16.4 -3.6 20.6
K20-HP-20B 20.0 15.3 -4.7 19.3
K30-HP-30B 30.0 24.2 -5.8 30.3
K10-ATO 10.0 6.4 -3.6 9.1
K20-ATO 20.0 15.6 -4.4 20.4
The main important results in the analysis of TGA for characterization ofthermal stability, which are % weight at 420-430 0C and the residual yield at temperature of 700°C
were shown Table 5. Based on the results, it is possible to conclude that the percentage weight at 420-430 0C and
residual yield of each PP-K nanocomposites increases with increasing kaolinite content.
The comparison of thermal stability was carried out in terms of selected decomposition temperatures, in particular degradation at 420-430 0C. As shown in Table 5 percentage
[image:11.595.333.531.164.294.2] [image:11.595.79.245.364.631.2]© 2017, IRJET | Impact Factor value: 6.171 | ISO 9001:2008 Certified Journal
| Page 130
(Atofina, 12 g/10min). For example the percentage remainsat temperature range of 420-430 0C is 10.1, 20.6 and 30.3
wt% for K10-HP, K20-HP and K30-HP-30B respectively while it was 9.1 and 20.4 wt% for K10-ATO and K20-ATO respectively, which is almost expected percentage content of filler added compared to 0.85 wt% for neat HP polypropylene. Following Gilman suggestion [22], this behaviour is due to the hindered thermal motion of the polymer molecular chain.
Residual mass at 700°C is directly dependent on the nanofiller content and type of PP matrix, ranging between 7.6, 16.4 and 24.2 wt% for composition of K10-HP, K20-HP and K30-HP-30B respectively while it was 6.4 and 15.6 wt% for K10-ATO and K20-ATO, respectively. The incorporation of clay into a polyolefin matrix enhances its thermal stability by acting as a superior insulator and mass transport barrier to the volatile products generated during decomposition, making the diffusion path of the oxygen more complicated, and thus retarding the thermo-oxidative process [23, 24].
4. CONCLUSION
According to the above results of spinning and drawing of HP and ATO fibers, it is possible to conclude that K-HPfibers are performing well in: thermal stability, drawability, mechanical properties, hosting high content of fillers and facilitating filler dispersion. Based on the advantage of properties obtained by K-HP fibers it was selected for the production of filaments for 3D printing (Part 3 of our paper in this same Journal). Thus batch of K-HP samples only was compounded for extrusion of filaments for 3D printing as shown in compounding section (Part1 of our paper in this same Journal).
Nanofiller presence affects the spinnability and drawability especially in high MFI PP and at higher content of kaolinite in the polymer matrix. Hot drawing in fibers induces the rupture of kaolinite aggregates and controls the intercalation or partial exfoliation of kaolinite in the PP matrix.XRD reveals strong orientation of kaolinite along the chains axis after drawing nanocomposites fibers. Morphology analysis by SEM and TEM confirmed good dispersion of the filler even though they tend to form small agglomerates frequently due to hydrogen bonds formed between kaolinite particles. But at higher kaolinite content there is a formation of larger agglomerates which also depends on PP type; HP forms larger agglomerates at 30wt% while ATO forms at 20wt% of kaolinite content. Formation of larger agglomeratesacts as stress concentration centers and results in difficulty of drawability and reduction in mechanical properties of fibers. Tensile modulus of nanofilled fibers increases with nanofiller content up to limited content and drawing ratio. Stress at break of K-PP nanocomposites fibers decreases with kaolinite content
REFERENCES
[1] Toshio K., High-modulus and high-strength polypropylene fibers and films. In Polypropylene an a-z reference (ed.: Karger-Kocsis J.) Kluwer Academic Publishers, Dordrecht, 295–300, 1999.
[2] Wishman M., Hagler G. E.: Polypropylene fibers. In ‘Handbook of fiber science and technology fiber chemistry’ (eds.: Lewin P., Pearce E. M.) Marcel Dekker, New York, 371–497, 1985.
[3] Kearns J. C., Shambaugh R. L.: Polypropylene fibers reinforced with carbon nanotubes. Journal of Applied Polymer Science, 86, 2079–2084, 2002.
[4] LópezManchado M. A., Valentini L., Biagiotti J., Kenny J. M.: Thermal and mechanical properties of single-walled carbon nanotubes–PP composites prepared by melt processing. Carbon, 43, 1499–1505, 2005.
[5] Rangasamy L., Shim E., Pourdeyhimi B., Structure and tensile properties of nanoclay–PP fibers produced by melt spinning. Journal of Applied Polymer Science, 121, 410–419, 2011.
[6] Joshi M., Shaw A., Butola B. S.: Studies on composite filaments from nanoclay reinforced PP. Fibers and Polymers, 5, 59–67, 2004.
[7] Dabrowska I., Fambri L., Pegoretti A., Slouf M., Vackova T., Kolarik J.: Spinning, drawing and physical properties of PP nanocomposite fibers with fumed nanosilica. eXPRESS Polymer Letters Vol.9, No.3. 277–290, 2015.
[8] Zhang Y., Yu J., Zhou C., Chen L., Hu Z.: Preparation, morphology, and adhesive and mechanical properties of ultrahigh-molecular-weight polyethylene/SiO2 nanocomposite fibers. Polymer Composites, 31, 684– 690, 2010.
[9] Rottstegge J., Qiao Y. K., Zhang X., Zhou Y., Xu D., Han C. C., Wang D.: Polymer nanocomposite powders and melt spun fibers filled with silica nanoparticles. Journal of Applied Polymer Science, 103, 218–227, 2007.
[10] Srisawat N., Nithitanakul M., Srikulkit K.: Spinning of fibers from polypropylene/silica composite resins. Journal of Composite Materials, 46, 99–110, 2011.
[11] Srisawat N., Nithitanakul M., Srikulkit K.: Characterizations of fibers produced from polypropylene/silica composite. Journal of Materials and Minerals, 19, 53–58, 2009.
© 2017, IRJET | Impact Factor value: 6.171 | ISO 9001:2008 Certified Journal
| Page 131
European conference on composite materials, Seville,Spain, June 2014.
[13] Dorigato, A., M. D'Amato, and A. Pegoretti, Thermo-mechanical properties of high density polyethylene – fumed silica nanocomposites: effect of filler surface area and treatment. Journal of Polymer Research, 19, 9889-9900, 2012.
[14] Matsuoka S., Relaxation phenomena in polymers. Hanser, Munich (1992).
[15] Boyd R. H., Relaxation processes in crystalline polymers: Molecular interpretation – A review. Polymer, 26, 1123–1133, 1985.
[16] Abo El, Maaty M. I., Bassett D. C., Olley R. H., Dobb M. G., Tomka J. G., Wang I-C., The formation of defects in drawn PP fibres. Polymer, 37, 213–218, 1996.
[17] Amornsakchai T., Olley R. H., Bassett D. C., Al-Hussein M. O. M., Unwin A. P., Ward I. M., The influence of initial morphology on the internal structure of highly drawn polyethylene. Polymer, 41, 8291 8298, 2000.
[18] Toshio K., High-modulus and high-strength polypropylene fibers and films. Polypropylene an a-z reference (ed.: Karger-Kocsis J.) Kluwer Academic Publishers, Dordrecht, 295–300, 1999.
[19] Alcock B., Cabrera N. O., Barkoula N-M., Reynolds C. T., Govaert L. E., Peijs T., The effect of temperature and strain rate on the mechanical properties of highly oriented polypropylene tapes and all-PP composites. Composites Science and Technology, 67, 2061–2070, 2007.
[20] Lutterotti L., Bortolotti M., Ischia G., Lonardelli I. and Wenk H.-R., Rietveld texture analysis from diffraction images. ZeitschriftfürKristallographie Supplements., 26, 125-130, 2007.
[21] Lutterotti L., Total pattern fitting for the combined size–strain–stress–texture determination in thin film diffraction. Nuclear Instruments and Methods in Physics Research, B, 268, 334-340, 2010.
[22] Gilman, J.W., Flammability and thermal stability studies of polymer layered-silicate clay/ nanocomposites. Applied Clay Science, 15, 31-49, 1999.
[23] Costantino U., Gallipoli A., Nocchetti M., Camino G., Bellucci F., Frache A., New nanocomposites constituted of PE and organically modified ZnAl-hydrotalcites. Polymer Degradation and Stability, 90, 586-590, 2005.
[24] Costa F.R., Wagenknecht U., Heinrich G., LDPE/Mg-Al layered double hydroxide nanocomposite: Thermal and