STUDY THE EFFECT OF ICE ACCRETION ON VARIOUS
AERODYNAMIC FLIGHT CHARACTERISTICS
USING F-16 MODEL
Ali Sabri Abbas and Anwar Luay Khaleel
Department of Mechanical Engineering, Al Nahrain University, Baghdad, Iraq E-Mail: [email protected]
ABSTRACT
The buildup of ice on lifting devices during flight manifests a risk to any aircraft safety. A major rolling parameter in the criteria of aircraft icing is the ice roughness which indicates surface roughness induced with the initial stages of in-flight ice accumulations. Icing type classification was related to the structure and appearance of the ice may vary based on the atmospheric and flight conditions in which it forms. Present work utilizes rime layer since icing type frequency of occurrence would reach a percentage of (71.7%) for this layer. Present work will focus on studying the effect of ice accretion layers on drag and lift coefficients in addition to some of aerodynamics coefficients with respect to different angles of attack range between (-20o to 20o) for different flight speed velocities having a range of (15, 31, 40, 47, & 54 m/s) through using of (F-16) aircraft prototype that has a 1:48th scale where the accretion layer was simulated on both wing and tail area. Wind tunnel data was corrected for the reason related to the streamlines that was guided in straight manner by the side walls of the wind tunnel but also they are curved at specific distances from the full scale airplane, in comparison to the wind tunnel wall correction. Correction related to the wing shape and its sweep in addition to its span in accordance to the width of the test section therefore it is essential to conduct some corrections for the angle of attack and the drag coefficient. It was concluded that the trend of drag coefficient tend to be increased for both positive and negative magnitudes of the angle of attack where the lowest value of the drag coefficient occurs at an angle of attack equal to (0o) with a value of (0.05) while the maximum value for the drag coefficient almost equal to (0.48) while for the case of ice accretion a higher values for drag coefficients appeared at higher values for the angles of attack but with a new behavior represented by the range of drag coefficient that entirely increased with a maximum value of (0.38). It was found that the most efficient angle of attack in the ordinary case of study with no ice accretion appeared to have a value of (5o) while when ice accretion was adopted, the lift/drag ratio start to decrease with the increase of the angle of attack confirming the foreseen behavior of lift force reduction related to aggressive increase in drag forces exerted on the aircraft results from ice simulated layer.
Keywords: skin friction, lift and drag, ice - accretion.
INTRODUCTION
The buildup of ice on lifting devices in any flight presents a major risk to the safety of an aircraft in addition to numerous scientific challenges and engineering problems. Accretion of ice was investigated and the aerodynamic results began as early as the 1940, and all the research conducted in the past decades has almost fulfill the required study, but it was far from comprehensive knowledge for the effects of ice buildup on airfoils. A major effective parameter in the criteria of aircraft ice buildup is ice roughness which refers to surface roughness starts at the initial stages of flight ice formation. Authors [1] mentioned that identify roughness buildup on airfoils and conduct that initially the leading edge contains a smooth zone, a feather region and a rough zone. These appearances are more practical for higher sweep angles in both glaze and rime conditions. It has been observed that the smooth zone may not shape. Icing roughness can be characterized by location, height, concentration and shape, and chord-wise extent.
There are many factors that may considered as the icing factors such as liquid water content, temperature, droplet size, cloud type, airfoil geometry, air speed, and duration of exposure. These factors may and may not all affect the formation of icing and where exactly is Likely to
Occur. Therefore, causation of icing may not cause by ice in clouds rather than that from “Super-cooled” liquid water droplets which may impinging the leading edge of an airfoil or freeze on impact. For ice accretion to occur, the aircraft must be flying through layers of visible water such as rain or cloud droplets. Temperature range in which the moisture strikes the aircraft must be equal to 0° C or colder further to the aerodynamic cooling which may accompanied with lower temperature of an airfoil to 0° C even though the ambient temperature is a few degrees warmer. Icing type classification was based on the structure and appearance of the ice may vary based on the atmospheric and flight conditions in which it forms. The Types of ice layer are clear, rime, and mixed layers.
the temperatures rate are low, then lower amounts of liquid water, low velocity, and small droplets will be presented. Rime ice layer have an irregular shape and rough surface that make it very effective in decreasing aerodynamic efficiency, but it is lighter than clear ice note that structural icing can cause significant aircraft control and performance degradation.
STRUCTURAL ICING
Present work used F-16 Falcon aircraft which obviously as a supersonic aircraft has a thin wings rather than the commercial airplane that possess a thicker shape of wing profile. Therefore, thin wing with ice on them are more critical than thick wings and may have a condition of tail Stall. If the ice accretion leads to tail stalls and the disrupt airflow then aircraft recovery is not possible at low altitudes or a wing stall might be appeared which has more threat, but it is important to differentiate between tail stall and wing stall, since the required actions for both of them are roughly opposite.
Ice accretion forms on the tail surfaces of an airplane much faster than on the wing. If the tail stalls due to ice formation and the disruption of airflow it may cause, recovery that is not anticipated at low values of altitude. Several air aircraft have been lost due to ice buildup on tail that leads to stalls occurrence. This case was also repeated with light aircraft but usually with no well documents to record them. Note that tail stall is less observable with many pilots, it is mentioned in the present study, but wing stall is considered to have more threat. Therefore, it is very important to differentiate between the two cases, since what is required is almost the opposite. Note that present study conducted all experimental work to investigate the effect of ice accretion on both aircraft wing and tail.
Roll control can be affected by Ice formation on the wings forward. Some of the wings types are designed so that stall condition started at the root of the wing and then progresses far from the root, so the stall does not cross with control of the aircraft. However, the tips are considered thinner than the other parts of the wing, so tips are considered the part of the wing that most efficiently permits ice accretion. This accretion can cause to a partial stall of wings at the tips point, and therefore affect some aircraft and thus affect their roll control. Therefore, present work concentrates on studying of wing and tail icing effect on the flight condition of F-16 falcon prototype aircraft.
WORK MOTIVATION Present study is aimed to:
a) Investigate the effect of varying the angle of attack (α)
on the drag coefficient for non-icing plane conditions and make a comparison with the results obtained for icing conditions, since the skin friction is the major cause for drag.
b) Investigate the effect of varying the angle of attack (α)
on the lift coefficient for non-icing conditions and make a comparison with the results obtained for icing conditions.
c) Investigate the effect of varying the angle of attack (α)
on different flow coefficient for non-icing plane conditions and make a comparison with the results obtained for icing conditions.
d) Conducting the relation and effect of varying flow speed for each angle of attack on coefficient of pressure, coefficient of lift, and coefficient of drag.
LITERATURE SURVEY
Marta Zocca [1] reported that reference ice accretion experiments are reproduced numerically using the simulation to investigate solid blockage effects and wall-model boundary layer interaction. The simulation software is applied to the computation of the aerodynamic flow-field and of the trajectories of water droplets. The thickness of the iced layer is then determined using ice accretion module, which solves the multi-phase ice, liquid water and airflow around the body surface. The iced geometry is updated in the aerodynamic solver to compute the aerodynamic forces, heat transfer and drop trajectories around the iced wing.
Janjua, Z.A. [2] reported that a certain work is carried out to determine more accurately the growth rate of ice and also the correct type of ice formation based on parametric conditions to ensure more efficient energy use from electro-thermal mats near the leading edge of the wing models that do not include the mushy layer typically. The MATLAB software was used to determine the ice growth with respect to time¸ was assumed constant to simplify the solution but in reality, it will be dependent upon a variety of parameters including the temperature and size of the super-cooled droplet, the water-air interface temperature and the free stream (i.e. aircraft) velocity. It was found that for accretion on an aircraft wing, even at warmer temperatures, initially only rime ice will form which is represented by the red dots. This region is characterized by solid crystal growth directly on the surface, with the liquid water as either runback or otherwise present in the matrix. It was also reported that at a particular time, a transition will occur from rime to glaze/mixed ice over-estimate ice accretion. We envisage the mushy layer behaves as a insulating region regarding the growth of the ice layer.
information is known about the 3D flow field and almost less about the effect of Mach number and Reynolds number on these flow regimes of all these categories. Author conducted classifications and supporting data that can serve as a bench mark for a new research to explore ice shapes with swept wing aerodynamics.
Michael Papadakis [4] has conducted a comprehensive study to select a wing model, ice shapes, and test conditions, and to define experimental methodologies and procedures. A plane model of 5-ft semi-span swept finite wing reflection supplied with an aileron control surface was designed, fabricated, and instrumented at WSU. Tests were conducted at the NASA Glenn Icing Research Tunnel (IRT) to generate five glaze ice shapes with complete and incomplete scallop features and one rime ice shape. Casting of ice shapes produced by NASA for aerodynamic testing from the actual ice accretions. Simulated 3D ice shapes were defined with the NASA Glenn LEWICE ice accretion code for the same icing conditions used in the IRT icing tests. The 3D ice shapes were fabricated out of wood or aluminum at WSU and were prepared for aerodynamic testing. Extensive experiments were conducted at the WSU 7- x 10-ft wind tunnel facility over a period of 10 weeks to generate twenty ice shapes and eight roughness cases were tested along with the no ice wing. The ice shapes included 6- IRT castings and 7-smooth and 7- rough LEWICE shapes. The roughness cases included 120- and 150-grit sandpaper to simulate the effect of frost on wing aerodynamic performance.
Lift, drag, pitching moment, hinge moment, and pressure distributions were obtained for all configurations tested. Finally, the experimental results obtained showed that the stall lift coefficients for the wing with the glaze ice shape castings were 11.5% to 93.6% less than the clean wing. For the 5-min rime ice shape, the stall lift coefficient was 3.4% higher than the clean wing.
EXPERIMENTAL SETUP
Description and characterizing of F-16 prototype The F-16 prototype is the name of a aircraft used for purpose of present work. It was built and manufactured by AEROLAB which is also the manufacturer of the educational wind tunnel (EWT) utilized in the experimental work as shown in Figure-1. Model has a 1:48th scale of the F-16 fighter. Resin-filled for greater strength, stiffness and durability, prototype mounts easily to a sting of 3/8-inch balance with one set screw. The overall length is approximately equal to 11.5 inches (29.2cm) with a span equal to 7.5 inches (19cm). A sting balance is used to balance model in a horizontal position in order to measure the reaction forces directly. The data of the 2D experiment will be analyzed in order to obtain values for the coefficients; CL, and CD, CM, and L/D ratio. In the case where the effect of ice accretion studied in the present work, a sheet of glass paper was placed on the wing and tail area to simulate the formation of a rime ice layer in order to investigate the effect of ice roughness on drag forces and in accordance the coefficient of drag
and the accepted outcomes that will affect the lift coefficient, pitch moment coefficient, and the ratio of lift to drag forces as can be shown in Figure-2.
Figure-1. 1/48 Model of the F-16 Falcon fighter.
Figure-2. Proposed F-16 prototype.
In order to fulfill the requirement of the present work that intends to illustrate the effect of ice accretion on the wing and tail of F-16 falcon model, two categories were established for this purpose. First one was to use the ordinary 1/48 model shown in Figure-1 with the existing wind tunnel facilities to examine the proposed aerodynamic parameters for the purpose of the present discussion while in the second category the ice accretion layer was simulated by the addition of sheet of glass paper to cover part of the wing and the tail which are the most predictable location for rime ice layer to be formed in addition to the leading edge which is not in the scope of the present study. Moreover, the shape effect for the ice layer on the aerodynamics of aircraft was mot studied here in which only the effect of ice roughness was conducted.
Table-1. Present technique for the collecting of the experimental data.
General AEROLAB wind tunnel specifications
The AEROLAB Educational Wind Tunnel shown in Figure-3 is similar to Eiffel type, or open circuit, type with a 12x12x24-inch (30.48cm x 30.48cm x 60.96cm) test section. Clean-tunnel having a top speed with a range of 145 mph (64.8 m/s) with near infinite adjustability above 10 mph (4.47 m/s). For an open circuit design, the educational wind tunnel pulls air from the surrounding environment (laboratory). This air first passes through a mesh of parallel passages that are hexagonal in shape and referred to as honeycomb. The honeycomb cells are 4 inches (10.16cm) length and used to straighten the flow in order to reduce most flow turbulence. Because the honeycomb eliminate small eddies. The tunnel is equipped two turbulence that can reduce screens immediately downstream of the honeycomb. They are made of 0.009 inch (0.23mm) stainless steel wire spaced at 20 - wires per inch. Small eddies in the air are broken into smaller eddies with the aid of that screens. In other word, smaller eddies dissipate faster than larger eddies. Eddies passing through the test section are termed “turbulence”. The screens also serve to reduce axial velocity variation. Together, the honeycomb and screens smooth the air before it enters the contraction. The honeycomb and screens can be removed from the tunnel entrance for cleaning.
Figure-3. Educational Wind Tunnel (EWT).
Model mounting and positioning
Models are mounted in the EWT by fastening them to either the test section floor or the sting Force/Moment Balance as shown in Figure-4. In both cases, yaw angle is adjustable because the test section floor is equipped with a yaw table that is manually operated. The model positioning system (MPS) is a series of parallel arms mounted to a gearbox. The gearbox is then mounted to the yaw table. The sting balance mounts to on top of the (mps) vertical arms and provides a perfect perch for models similar to F-16 airplane or the turbulence sphere. The model allows for pitch angle adjustment varies between approximately +20° to -20° with the aid of positioning systems with a step angle of (5o) for the purpose of present work.
Figure-4. EWT Model mounting and positioning.
Present theoretical analysis
In order to summarize the theoretical techniques that was used in present work to analyze data obtained experimentally, some equation that will be listed hereafter illustrate the steps of evaluating the coefficients used in present work. There are three axes-systems for any wing loaded as shown in Figure-5 which are:
Ground
Body
Aerodynamic
Therefore the resultant aerodynamic force could be split into components in the body or aerodynamic axes systems. The geometrical relations between these two sets of components are shown in equation (1). Finally the coefficients used in the present work are summarized in equation (2):
(2)
Where:
s = a wing area (m2). l = chord length (m).
Corrections for wind tunnel readings
Normally, airplane flies through large enclosure volume of air except near the ground which is the case in which an airplane prototype can flies inside a wind tunnel test section within an enclosure volume of air. This difference needs researchers to introduce a number of corrections methods which are useful to wind tunnel data for any experimental data that obtained. In this study we will consider the correction introduced by the streamlines being forced straight near the flat walls of the wind tunnel although they are almost curved at corresponding distances from the real airplane. This procedure is called the wind tunnel wall-correction. Correction depends upon the sweep and shape of the prototype airplane wing as in addition to its span relative to test section width of wind tunnel. As an approximation the following corrections relations pertained to the angle of attack and to the drag coefficient for any given value of CL will be conducted:
(3)
RESULT AND DISCUSSIONS
Discussion of the proposed coefficients and ratio Present experimental data obtained in this study, was classified in two different type of presentation scheme, one of them is variation of drag, lift pitch moment coefficients and lift to drag ratio with a different values for the angle of attack at five different values of upstream velocities which are (15, 31, 40, 47, and 54 m/s). Second scheme illustrate the effect of ice accretion on both wing and tail of F-16 Falcon model with the same variables that are presented in the first scheme in order to be familiar with the changes and variations in aerodynamics performance of fighter flight.
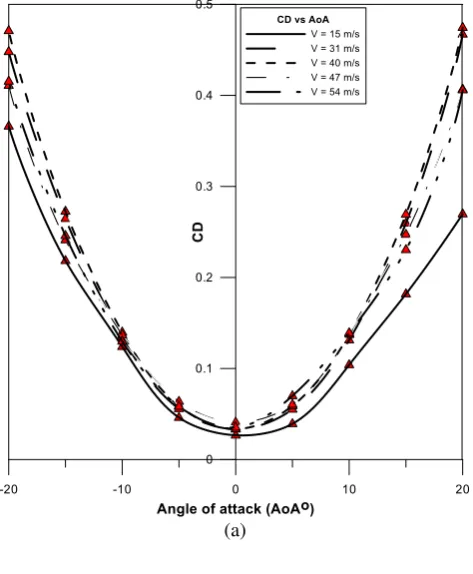
Figure-5 illustrates the variation of the drag coefficient with respect to different angle of attack. It can be noticed that the trend of drag coefficient tend to be increased for both positive and negative values of the angle for attack where the minimum value of the drag coefficient occurs at an angle of attack equal to (0o) with a value of (0.05) while the maximum value for the drag coefficient almost equal to (0.48o).
Moreover, it can be shown that with the increasing of upstream velocities the trend of drag coefficient against the angle of attack manifest a slight
increase in the overall value without affecting the general trend mentioned previously regarding drag coefficient versus the angle of attack. As it was mentioned before that the coefficient of drag plotted against the angle of attack curve reveals that this coefficient increases in a smooth manner as the angle of attack increases. We can see that CD has its minimum value at small angles of attack. As the stall angle is approached, the drag increases at a progressively higher rate due to separated flow. In order to estimate airplane wing efficiency results should be targeted to consider other parameters more than just focus on the lift produced during flight. In fact, any wing will have the greatest lift force and capability just before the onset of stalling due to large angle of attack. Unfortunately, close to these regimes that show stalling angle, the wing also produces considerable drag. Minimum drag appears at lower values of attack angle for case almost above zero degrees for (AoA). Lifting capability is very low at these low values of the angles of attack.
Moreover, the drag on an airfoil (2-D wing) is primarily due to viscous effects at low speed and compressibility effects at high speed. In addition, at high angles of attack, the flow can separate from the upper surface and cause additional drag which is clearly appeared in Figure-6(a). Hence, the drag coefficient depends on three quantities, Reynolds number, Mach number, and the angle-of-attack. Typically the Reynolds number is important at low speeds, the angle-of-attack at all speeds as the case of present work, and the Mach number at high speeds which is not within the scope of our project. The aim of the present work is well represented in Figure-6b which illustrate the variation of drag coefficient against the angle of attack with an ice located at the wing and tail. It can be shown that same trend was repeated again where as higher values for drag coefficients appeared at higher values for the angles of attack but the new behavior which is accompanied with the existing of ice is range of the drag coefficient was entirely increased with a maximum value of (3.8) which indeed much higher than the case of no ice effect due to domination of separation region.
effect will dominate the lift forces and lead to occurrence of negative values for lift coefficients asserting the idea of ice accretion on aerodynamic performance.
The parabolic drag gives no exact behavior; but it can consider accurate enough for to accomplish performance calculation procedure. The variation of drag coefficient versus lift coefficient will have a similar behavior and can be represented by drag polar that is shown in Figures 8 a & b. Drag and the drag coefficient can be manifested in different number of ways, for purpose of simplicity and clarity. Present analysis adopts the parabolic drag polar. This can be conducted only for subsonic flight. For the supersonic aircraft, the drag cannot be properly described by such a simplified way of expression. Every point on the polar curve is plotted for a certain values of AoA and manifests the values for the coefficients of drag and lift. It was found that drag and lift coefficients possess a relation of direct proportional relationship for both positive and negative values of the angle of attack but with negative values for the lift coefficients for the case of negative angle of attack due to reverse lift effect. Existing, case study uses a maximum angle of attack of (-20o and 20o) which will not lead to a stall condition where the lift coefficient start to decrease with the increasing of the drag coefficient. This point of inflection is when stall condition is firstly occurred. For ice accretion shown in Figure-8b, the lift coefficient will dominated by the negative values related to the domination of drag forces caused by ice accretion on both aircraft wing and tail.
Every angle of attack will lead to a certain lift to drag ratio by dividing either the coefficient of lift by the coefficient of drag or lift force by drag force. In this way, a certain curve can be drawn which representing the variation of the lift to drag ratio as a function of the angle of attack as shown in Figure (7 a & b). For any aircraft flight it can be noticed that, when the AoA is increased, then the lift to drag ratio increases from a value of zero to some maximum value. Then, as the AoA is increased furthermore, then the lift to drag ration ratio start to decrease until the condition for the stalling angle is reached and keeps decreasing even beyond that stalling angle. The reason for this behavior can be related to the AoA that is increased until the lift to drag percentage reaches its maximum value, then both the coefficient of lift and coefficient of drag increase but coefficient of lift increases more than coefficient of drag. Although, the AoA is increased near the maximum lift to drag ratio and the coefficient of drag increases more than coefficient of lift.
The best lift to drag ratio that obtained with a certain angle of attack is namely called the "most efficient angle of attack" which in the ordinary case of study with no ice accretion appeared to have a value of (5o). For the case of ice accretion the lift/drag ratio start to decrease with the increase of the AoA confirming the foreseen behavior of lift force reduction due to aggressive increase in drag forces exerted on the aircraft results from ice simulated layer.
Coefficient of pitch moment versus the angle of attack for the two proposed case of study were shown in Figure (9 a & b), The Pitching moment (Cm) curve of the F-16 model for low speed is described below. The pitching moment is the moment that is applied to the aircraft in the pitch axis, positive means the aircraft will pitch up, negative means that the aircraft will pitch down. In figure (10a) an elevator deflection was appeared which is when (AoA= +25deg) and in this case a certain condition called full deflection up is appeared (i.e. pitch down in which Cm<0 is expected), and when (AoA= -25 deg) a certain condition called full deflection down (i.e. pitch up: Cm >0 is expected).
The F-16 possesses a negative static margin at lower values for the angle of attack (AOA) in addition to low speed that makes it unstable. The static margin is almost close to zero or can be even positive when having an angle of attack above 15 deg which make the aircraft unstable in this regime as well. In the case of ice accretion shown in Figure-10b, the case of full deflection down where repeated here since all the values of the pitch moments were turned into positive values. This was related to the effect of ice simulated layer on increasing the drag forces that leads to the case of so called nose down.
[image:6.595.309.546.395.682.2](b)
Figure-5. Coefficient of drag versus the angle of attack for five.
(a)
(b)
Figure-6. Coefficient of lift versus the angle of attack for five different upstream velocities. (a) No friction.
b) With friction.
(b)
Figure-7. Coefficient of lift versus the Coefficient of drag for five different upstream velocities. (a) No friction.
(b) With friction.
(a)
(b)
Figure-8. Ratio of Lift force over drag force for five different upstream velocities. (a) No friction.
(b) With friction.
(b)
Figure-9. Coefficient of pitch moment versus the angle of attack for five different upstream velocities. (a) No
friction. (b) With friction.
CONCLUSIONS
It was concluded that the trend of drag coefficient tend to be increased for both positive and negative values of the angle of attack where the minimum value of the drag coefficient occurs at an angle of attack equal to (0o) with a value of (0.05) while the maximum value for the drag coefficient almost equal to (0.48) although for the case of ice accretion a higher values for drag coefficients appeared at higher values for the angles of attack but with a new behavior represented by the range of drag coefficient that entirely increased with a maximum value of (0.38). Also, it was found that the behavior of lift curve with ice accretion effect possess same trend for the ordinary case where as negative values of the angle of attack revealed a straight line dominate on the behavior unlike the trend for the positive values of the angle of attack in which a severe effect of drag forces accumulated due to ice accretion effect will dominate the lift forces and lead to occurrence of negative values for lift coefficients asserting the idea of ice accretion on aerodynamic performance.
The Angle of attack was found to be increased, while the Lift to drag ratio increases from a value equal to zero to reach the maximum of its value. Then, as the angle of attack is increased furthermore, the Lift to drag ratio will start to decrease until the value of stalling angle is nearly equal its value and keeps decreasing more at almost higher values of the stall angle. The most efficient angle of attack in the ordinary case of study with no ice accretion appeared to have a value of (5o) while when ice accretion was adopted, the lift/drag ratio start to decrease with the increase of the AoA confirming the foreseen behavior of lift force reduction due to aggressive increase in drag
forces exerted on the aircraft results from ice simulated layer.
It was concluded that the F-16 possesses a negative static margin at lower values for the angle of attack (AOA) in addition to low speed that makes it unstable. The static margin is almost close to zero or can be even positive when having an angle of attack above 15 deg which make the aircraft unstable in this regime as well while in the case of ice accretion a case of full deflection down where reported since all the values of the pitch moments manifest a positive values.
REFERENCES
[1] Marta Zocca. Wind tunnel effects on ice accretion over aircraft wings. American Institute of Aeronautics and Astronautics, 2015. Anderson D. N. and Shin J. Characterization of Ice Roughness from Simulated Icing Encounters. AIAA Paper 1997-0052.
[2] Janjua Z.A. 2015. The Accretion of mixed ice on an aircraft wing due to the partial freezing of impinging supercooled droplets. European Drag Reduction and Flow Control Meeting.
[3] Jeff M. Diebold. Aerodynamic Classification of Swept-Wing Ice Accretion. AIAA 2013-2825.