R E S E A R C H
Open Access
Changing cluster composition in cluster
randomised controlled trials: design and analysis
considerations
Neil Corrigan
1,2, Michael J G Bankart
1,3, Laura J Gray
1and Karen L Smith
1*Abstract
Background:There are many methodological challenges in the conduct and analysis of cluster randomised controlled trials, but one that has received little attention is that of post-randomisation changes to cluster composition. To illustrate this, we focus on the issue of cluster merging, considering the impact on the design, analysis and interpretation of trial outcomes.
Methods:We explored the effects of merging clusters on study power using standard methods of power calculation. We assessed the potential impacts on study findings of both homogeneous cluster merges (involving clusters randomised to the same arm of a trial) and heterogeneous merges (involving clusters randomised to different arms of a trial) by
simulation. To determine the impact on bias and precision of treatment effect estimates, we applied standard methods of analysis to different populations under analysis.
Results:Cluster merging produced a systematic reduction in study power. This effect depended on the number of merges and was most pronounced when variability in cluster size was at its greatest. Simulations demonstrate that the impact on analysis was minimal when cluster merges were homogeneous, with impact on study power being balanced by a change in observed intracluster correlation coefficient (ICC). We found a decrease in study power when cluster merges were heterogeneous, and the estimate of treatment effect was attenuated.
Conclusions:Examples of cluster merges found in previously published reports of cluster randomised trials were typically homogeneous rather than heterogeneous. Simulations demonstrated that trial findings in such cases would be unbiased. However, simulations also showed that any heterogeneous cluster merges would introduce bias that would be hard to quantify, as well as having negative impacts on the precision of estimates obtained. Further methodological development is warranted to better determine how to analyse such trials appropriately. Interim recommendations include avoidance of cluster merges where possible, discontinuation of clusters following heterogeneous merges, allowance for potential loss of clusters and additional variability in cluster size in the original sample size calculation, and use of appropriate ICC estimates that reflect cluster size.
Keywords:Cluster merging, Cluster randomised trials, Loss to follow-up, Primary care, Sample size, Variability in cluster size
* Correspondence:[email protected] 1
Department of Health Sciences, University of Leicester, 22-28 Princess Road West, Leicester LE1 6TP, UK
Full list of author information is available at the end of the article
TRIALS
© 2014 Corrigan et al.; licensee BioMed Central Ltd. This is an Open Access article distributed under the terms of the Creative Commons Attribution License (http://creativecommons.org/licenses/by/2.0), which permits unrestricted use, distribution, and reproduction in any medium, provided the original work is properly credited. The Creative Commons Public Domain Dedication waiver (http://creativecommons.org/publicdomain/zero/1.0/) applies to the data made available in this article, unless otherwise stated.
Corriganet al. Trials2014,15:184
Background
Cluster randomised controlled trials (RCTs), in which groups of individuals rather than the individuals themselves are randomised, are conducted for a variety of reasons. The cluster design is often used when an intervention can be administered only to a group, such as a service-wide change or a public health campaign; when there is a risk that an intervention will affect participants in the nonintervention arm; or for reasons of cost or convenience. Such RCTs have a number of methodological challenges in their design, conduct and analysis, discussions of which can be found in a number of texts [1,2]. One issue that has received little attention is the consequence of changes to the composition of clusters after randomisation, including the merging or fragmentation of clusters. Cluster RCTs are relatively common in general practice settings, where general prac-titioners (GPs) or general practices, rather than individual patients, are the chosen unit of randomisation. Unfortu-nately, organisational changes are not uncommon in primary care, with some practices merging and others splitting. The number and size of GP practices in the United Kingdom have changed over time, with a reduction by 28% in the number of single-handed GP practices between 2004 and 2009 and a 19% increase in the total number of GPs. There was a 9% decrease in the number of GP practices between 1997 and 2007 [3], however, and organisational changes to meet the challenges of patient care have been actively encouraged [4].
In this article, we focus on the implications of merging clusters for the design and analysis of cluster RCTs. We chose to focus on this effect in cluster RCTs carried out within primary care, because the reduction in the num-ber of GP practices in recent years could result in greater potential for merges to occur in this setting than in other areas where cluster RCTs are frequently used, such as schools, communities, factories and hospitals.
There are few incidences of cluster merging reported in the literature. Using a MEDLINE search (with search terms ‘Trial’ AND ‘primary care’ AND ‘cluster’), we identified reports of completed cluster RCTs in primary care published between 2004 and June 2012, with the start date chosen because 2004 was the year of publication of the Consolidated Standards of Reporting Trials (CONSORT) extension for cluster RCTs [5], which require descriptions of the flow of participants and clusters. We identified 451 potentially useful references in the search.
After assessing the publication texts, we identified 211 reports of cluster RCTs in primary care. From among these, we found only one in which the authors explicitly reported a merge of clusters [6]. Foy et al. conducted two parallel cluster RCTs and reported that a practice merge brought together practices that were in the same arm of one RCT and different arms of another. It is not clear whether or how cluster merging was dealt with in their analysis.
To assess the extent of unreported instances of merging clusters in their RCTs, we contacted authors of papers published between 2010 and the present. From among the 67 authors contacted, 27 replied (response rate = 40.3%). Only one of the respondents had experienced a cluster merge in two practices originally randomised to the same trial arm. In the analysis, these two practices were treated as one [7].
Although the number of reported and/or acknowledged incidence of cluster merging is low, it is not obvious how RCT conduct and analysis should be handled when clusters do merge. We suggest that there are a number of simple options available: (1) discontinue recruitment to affected clusters, (2) analyse clusters separately as randomised or (3) analyse the clusters as a new merged cluster. The extent to which merging of clusters might create difficulties is likely to depend on the nature of the cluster merges, the design of the cluster RCT, the arm of the RCT to which the clusters were originally randomised and the timing of the merge. For example, if two primary care practices merge on a purely administrative level, with access to health-care professionals and patient care unaffected, it seems reasonable to continue as if such clusters had not merged and to analyse them as two separate clusters. Other cases may not be so clear-cut, particularly if patient care is reorganised following merging of clusters, result-ing in the potential for contamination. In such cases, careful consideration of the design will be needed with regard to the following issues: how recruitment is con-ducted (identification and enrolment prior to randomisa-tion or recruitment of individuals postrandomisarandomisa-tion), cohort or cross-sectional design and the nature of the intervention (for example, at the level of practice/clinician or patient). In most circumstances, it is unlikely that merged clusters will be analysed as one cluster if the clusters were originally randomised to different arms of a RCT, but it might be considered acceptable in a cross-sectional design, in which different patients are included at each measurement time point. The status of parti-cipants at the time of the cluster merge (for example, the number who have already completed treatment, the number part way through treatment and the number in follow-up) may also have a bearing on the decision.
In the remainder of this article, we explore statistical issues related to changing cluster composition. Methods and results are described for continuous outcome mea-sures, although similar principles apply to binary out-come measures.
Methods
Impact on study design
goal, careful consideration of sufficient sample size is required.
The most common approach to calculating the sample size for a cluster RCT involves increasing the number of participants required for an individually randomised trial by an inflation factor called thedesign effect. Details of the sample size calculation can be found elsewhere [8], but we describe them briefly for a continuous outcome measure.
In the following formulae, the effect to be detected is denoted by δ, type I error by α and type II error by β. Calculations are presented for a two-arm RCT, and it is assumed that the continuous outcomeyfollows a normal distribution,yeN μi;σ2
i
, in each populationi(i= 1, 2). If samples of sizeniare collected from populationi(i= 1, 2), then the total sample size required is n=n1+n2= (1 +λ)
n1, whereλis the ratio of clusters allocated to each arm of the RCT, σ2 is the pooled variance and ξυ denotes the value that satisfies P(Z>ξυ) =υ for Z~N(0, 1), and is given by
n¼ð1þλÞ
2 ξ a=2þξβ
2
σ2
λδ2 : ð1Þ
Withdrawal rates can also be factored into the calcula-tion, so that if the proportion of participants expected to drop out isw, the required sample size becomes
n¼ð1þλÞ
2 ξ α=2þξβ
2
σ2 1−w
ð Þλδ2 : ð2Þ
For a cluster RCT with equal cluster sizes of m, the design effect is given by 1 + (m−1)ρ, where ρ is the intracluster correlation coefficient (ICC) and is
calcu-lated as ρ¼ σ2b
σ2
bþσ2w, where σ
2
b is the between-cluster
vari-ance, σ2
w is the within-cluster variance and therefore
the total variance is given by σ2¼σ2
bþσ2w. The ICC
is the proportion of the total variance that is due to between-cluster variability. The sample size required for a cluster RCT becomes
n¼ð1þλÞ
2 ξ α=2þξβ
2
σ2
λδ2 ½1þðm−1Þρ:
Accounting for within-cluster attrition, w, assuming that attrition occurs uniformly across clusters, the calcu-lation becomes
n¼ð1þλÞ
2 ξ a=2þξβ
2
σ2 1−w
ð Þλδ2 ½1þðmð1−wÞ−1Þρ: ð3Þ
Equivalently, when cluster sizes are fixed, the total number of clusters required isc, where
c¼ð1þλÞ
2 ξ α=2þξβ
2
σ2
mð1−wÞλδ2 ½1þðmð1−wÞ−1Þρ; ð4Þ
and power can be calculated as
1−β¼Φ
ffiffiffiffiffiffiffiffiffiffiffiffiffiffiffiffiffiffiffiffiffiffiffiffiffiffiffiffiffiffiffiffiffiffiffiffiffiffiffiffiffiffiffiffiffiffiffiffiffiffiffiffiffiffiffiffiffiffiffiffi mð1−wÞcλδ2
1þλ
ð Þ2σ2
1þðmð1−wÞ−1Þρ
½
s
−ξα=2
! ;
ð5Þ
where Φis the cumulative distribution function for the standard normal distribution.
Letting
γðm;c;λ;w;δ;ρÞ ¼ mð1−wÞcλδ
2
1þλ
ð Þ2σ2
1þðmð1−wÞ−1Þρ
½
ð6Þ
it can be seen that the study power increases monoton-ically asγ increases. Thus the impact of each parameter on study power can be examined. The parameters that will be changed by merging clusters are m, which for post–cluster merges will be the average cluster size (rather than fixed); c, the number of clusters; and λ, the allocation ratio of clusters.
Upon inspection (equation (5)), a simple monotonic relationship between cand power is apparent, such that (1−β)→1 asc→∞and (1−β)→Φ(−ξα/2) asc→0.
It is known that, at larger values of m, the benefit gained from further increasing the average cluster size becomes less as the study power plateaus [9]. This has important consequences for study power if clusters merge and the average cluster size increases.
The relationship between study power and the ratio of clusters allocated to each arm of a RCT is nonmono-tonic, with optimum power at λ= 1, and decreases in power occurring as the value of λ deviates further from 1. Holding other parameters constant in equation (6),
γ λð Þ∝ λ 1þλ
ð Þ2 and γ′ð Þ∝λ 1−λ 1þλ
ð Þ3, which is positive for λ ∈
[0, 1), negative forλ∈(1,∞) and equal to 0 whenλ= 1, indicating that γ(λ), and therefore the study power, reaches a maximum point atλ= 1.
Clearly, if a cluster RCT starts with equal-sized clus-ters and two or more clusclus-ters merge, cluster sizes are no longer equal. Variability in cluster size has a detrimental effect on study power, as shown by Kerry and Bland [10]. If cluster sizes follow an underlying distribution with mean mc and standard deviation σc, and if treat-ment groups have equal numbers of clusters (λ= 1), then, as has been shown by a number of authors [11-14], the design effect becomes
1þ σ
2 c m2 c þ1
mc−1
ρ; ð7Þ
Corriganet al. Trials2014,15:184 Page 3 of 13
and it is clear that the design effect increases as the vari-ation in cluster sizes increases. As clusters merge, cluster size variability increases and the design effect also in-creases. This implies that, without an increase in sample size, study power will decrease following cluster merges.
Consider a scenario in which all clusters are of equal size mand treatment groups receive equal allocations of the number of clusters. Let the number of clusters be
c ∈ 2ℕ and n(i) denote the size of cluster i (i= 1, …, c). The standard deviation of cluster size,σc, is therefore 0.
Suppose that k∈ 0;c
2
pairs of clusters merge, leaving
c−k clusters in total with nð Þj1 ¼⋯¼nð Þ ¼jk 2m for
j1, …,jk∈{1, …, c−k}, andn(i)=mfor i∈{1,…,c−k}∖ {j1, … jk}. For notational convenience, let S denote the set {1,…,c−k}∖{j1,…jk}.
The average cluster size following the merge is then
~
m¼ 1 c−k
X
i∈S
nð Þi þX
k
i¼1
nð Þji
!
¼ 1
c−kððc−2kÞmþ2kmÞ ¼ c
c−km ð8Þ
Recall that study power increases monotonically withc, and, holding all other terms in equation (6) fixed, we ob-tain γ¼1þðmmðð11−−wwÞÞc−1Þρconstant . After k∈ 0;c
2
merges,
this equation becomes γ~¼1þm~ððm~1−ð1w−ÞðwcÞ−−k1ÞÞρconstant. Note that the constant terms in the expressions for γ and ~
γ are equal, but m c~ð −kÞ ¼ c
c−km cð −kÞ ¼mc. Therefore,
~
γ ¼ mð1−wÞc
1þðm~ð1−wÞ−1Þρconstant, andγ~≤γ, with equality
hold-ing only if k= 0. Hence, power will be reduced following cluster merges if no additional clusters are recruited.
Let~s2
c denote the sample variation in cluster size
post-merge. Then
~s2 c ¼
1
c−k ð Þ−1
Xc−k
i¼1
nð Þi−m~
2
¼ 1
c−k−1
X
i∈S
nð Þi−m~
2
þXk
i¼1
nð Þji −m~
2!
¼ 1
c−k−1 ðc−2kÞ m−
c c−km
2
þk 2m− c c−km
2
¼ m2k cð −2kÞ c−k
ð Þðc−k−1Þ
:
ð9Þ
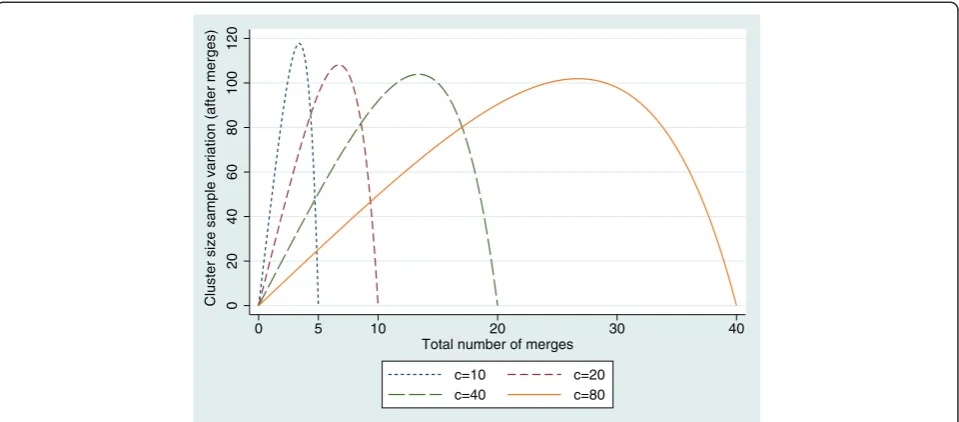
The variation in cluster size increases as k increases from 0, reaching its maximum before decreasing ask→c
2
(see Figure 1).
If the number of cluster merges differs between the treatment groups, then the ratio of the number of clus-ters λ will also be affected. Letki denote the number of merges of cluster pairs in treatment group i and ci
denote the number of clusters in treatment group i
before the merges. Then, after the merges,
~
λ¼c1−k1
c2−k2¼
c−2k1
c−2k2:
Because optimum power is achieved whenλ= 1, if the number of cluster merges is unequal between the treat-ment groups, the study power will be adversely affected.
These formulae have been used to explore the com-bined impact of the changes in design parameters graphically.
Impact on analysis: simulation study
Most of the few reported instances of cluster merges in-volved clusters within the same treatment arm of a RCT (which we refer to ashomogeneous merging). In the one instance in which data analysis was reported, the result-ing data were analysed with the merged cluster treated as a single cluster. We explored, by simulation, the ap-propriateness of this pragmatic strategy and considered approaches to analysis when clusters merge that were randomised to different treatment groups (that is, het-erogeneous merging).
Cluster RCT data were simulated using the framework of a multilevel model with a simulated two-arm RCT, comprising a control group and an intervention group. Clusters were set to be of equal size with equal alloca-tion of clusters to treatment arms. The outcome for each individual was generated as the sum of three compo-nents, Yij¼μtrtij þu0jþε0ij, where μtrtij was the mean
outcome for the treatment group to which patient i in cluster j was allocated, u0j was sampled from N 0;σ2b
and represented the cluster-level error for all individuals in that cluster, andε0ijwas sampled from N 0;σ2w
and was used as the individual-level error. Without loss of generality,σ2
b and σ2w were chosen so that their sum was
equal to 1. A value of 0.05 was used for the ICC, a com-monly used value in designing cluster RCTs in primary care. The total number of clusters was set at 80, and 20 individuals were allocated to each cluster, giving a 5% significance level at 80% power and an effect size of 0.2. True treatment group means were given the valuesμ0=
0 andμ1= 0.2.
For each scenario, 1,000 simulations were generated and a random intercept model was fitted to the resultant data sets. For model-fitting, we used restricted max-imum likelihood to improve estimates of the variance components [15].
with 40 individuals per cluster and 48 clusters with 100 individuals per cluster.
Homogeneous merges
Homogeneous cluster merges alter cluster size, average cluster size and, potentially, ICC, all of which have an impact on study power.
Scenario 1 For each homogeneous merge, two clusters from the same treatment group, which had not already been involved in a merge, were selected at random to become a merged cluster. Individual patient outcomes were left unchanged because it is assumed that treat-ment is not affected by the merge of clusters. The sce-nario was simulated for all pairs (k0, k1)∈M×M, where
M= {0, 1, 2, 5, 10, 20} and k0and k1are the number of merges in the control and intervention groups, respectively.
Scenario 2 A further scenario was simulated, to more closely reflect what might happen in practice. In this scenario, half of the individuals were assumed to have completed treatment prior to cluster merge, retaining the old cluster level error term. The remainder were al-located to a new merged cluster with a new cluster level error term applied in generating the outcome.
Heterogeneous merges
Two different scenarios were used to simulate heteroge-neous cluster merges.
Scenario 3 The simulated data sets were adjusted in a similar way as that used for homogeneous merges, with each merge consisting of one cluster from the control arm and one from the intervention arm randomly se-lected to form a merged cluster. With this scenario, whilst unrealistic in practice and presented here as an extreme illustration, we assumed that patient outcomes are unchanged following a merge and represented a RCT in which all patients completed the intervention prior to a merge.
Three strategies for analysis were explored: (1) merged clusters were allocated to the control arm of the study, (2) merged clusters were allocated to the intervention arm of the study or (3) merged clusters were eliminated from the analysis. It was expected that the first two strategies would lead to bias and that the third, whilst unbiased, would lead to a loss of power.
Scenario 4 Rather than assume that all patients com-pleted the intervention prior to the merge, in this sce-nario, we assumed that only 50% of the patients did so. The treatment group mean component used to simulate outcomes for individuals not completing treatment prior to the merge was adjusted according to treatment group allocation postmerge. As with scenario 3, analysis was based on three strategies: (1) merged clusters were allo-cated to the control group, (2) merged clusters were al-located to the intervention group or (3) merged clusters were dropped from the analysis.
Additionally, this scenario was simulated both with and without those who did not complete treatment prior to the merge, with individuals analysed according to
0
20
40
60
80
100
120
Cluster size sample variation (after merges)
0 5 10 20 30 40
Total number of merges
c=10 c=20
[image:5.595.59.539.89.300.2]c=40 c=80
Figure 1Relationship between the variability in cluster size and the number of cluster merges.Graph showing the variability when the number of clusters before the merges take place isc= 10, 20, 40 and 80 for fixed cluster size before the merges ofm= 20.
Corriganet al. Trials2014,15:184 Page 5 of 13
their original cluster assignment when noncompleters were omitted. This analysis reflected a pragmatic ap-proach of discontinuing clusters following a merge.
As with homogeneous merges, further simulations were conducted with increased cluster size and a re-duced number of clusters, keeping the planned study power constant at 80%. All simulations and analyses were conducted using Stata 12 software (StataCorp, Col-lege Station, TX, USA). Example code for the simula-tions is given in Additional file 1.
Results Study design
Equation (6) allowed exploration of the variables that affect study power when clusters are merged. Figure 2 illustrates this impact when, for example, up to three merges in treatment group 1 and two merges in treat-ment group 2 occur. We note that the effect is as ex-pected on the basis of equation (6). There is a linear effect on power at each level of merges in each treat-ment group, and adjusttreat-ment for potential cluster merges in study design would be straightforward, although the choice of assumptions to be made in practice with re-gard to potential numbers of cluster merges is more difficult.
Analysis: simulation study
We analysed the complete simulated data sets without cluster merges. From among the 1,000 simulated data sets, 826 yielded evidence of a significant treatment dif-ference at the 5% level, and parameter estimates were all in agreement with the‘true’level.
Homogeneous cluster merges
Scenario 1
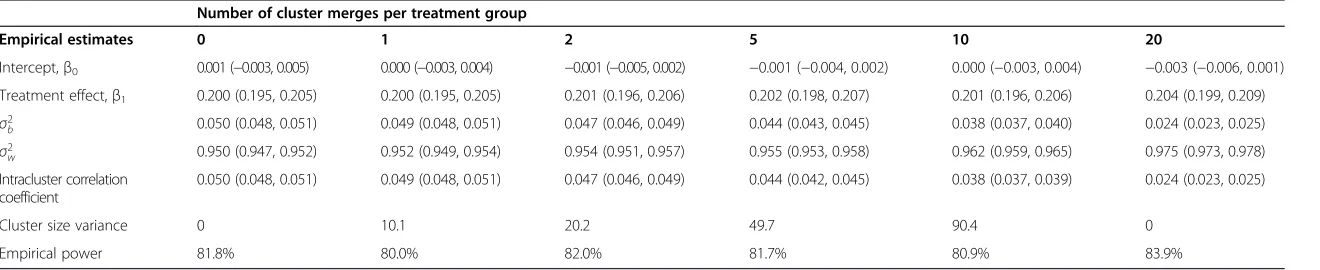
Empirical parameter estimates based on equal numbers of cluster merges are given in Table 1. Estimates of the treatment effectβ1were unbiased, as expected, with
esti-mates ofβ0being consistent with the‘true’value of 0.
The variance component estimates have been affected by the cluster merges, with the between cluster variabil-ity, σ2b, decreasing as the number of merges increases. Since the total variation at the individual level is un-affected, the within cluster variability, σ2
w, increased.
Consequently the ICC also decreased. Figure 3 shows the relationship between the estimate of ICC and the total number of cluster merges and it appears that the ICC depends on the average cluster size. Although there was a small impact on study power, this is rather less than expected from the results presented earlier, and was explained by the change to ICC.
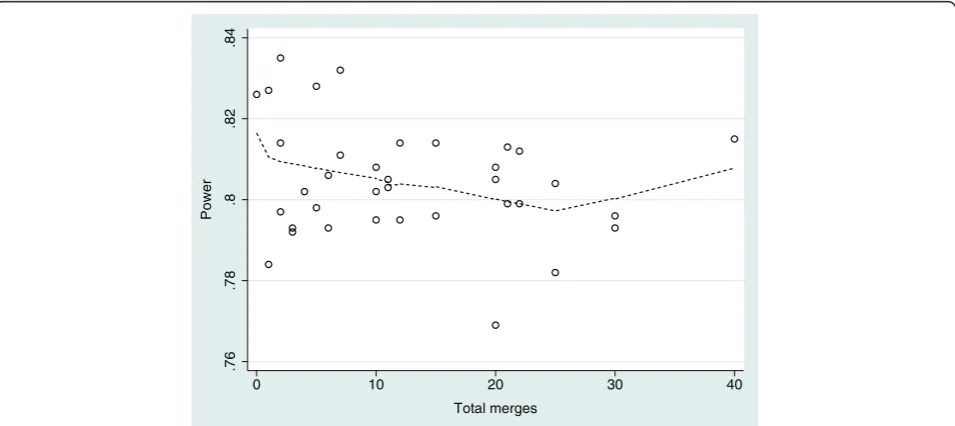
Simulations in which unequal numbers of cluster merges occurred in each of the intervention groups gave broadly similar results, albeit with a greater loss of power as the imbalance in cluster allocation to treat-ments increased. The effect on power is illustrated in Figure 4.
The same patterns in estimates were observed when the number and size of clusters was varied, with very similar results by proportion of clusters merging.
Scenario 2
When only 50% of patients are assumed to have com-pleted prior to a merge a similar pattern was observed.
.55
.6
.65
.7
.75
.8
Power
0 1 2 3
Merges in trt group 1
[image:6.595.59.539.491.702.2]Merges in trt group 2 = 0 Merges in trt group 2 = 1 Merges in trt group 2 = 2
Table 1 Parameter estimates following homogeneous cluster merges: scenario 1a
Number of cluster merges per treatment group
Empirical estimates 0 1 2 5 10 20
Intercept,β0 0.001 (−0.003, 0.005) 0.000 (−0.003, 0.004) −0.001 (−0.005, 0.002) −0.001 (−0.004, 0.002) 0.000 (−0.003, 0.004) −0.003 (−0.006, 0.001)
Treatment effect,β1 0.200 (0.195, 0.205) 0.200 (0.195, 0.205) 0.201 (0.196, 0.206) 0.202 (0.198, 0.207) 0.201 (0.196, 0.206) 0.204 (0.199, 0.209)
σ2
b 0.050 (0.048, 0.051) 0.049 (0.048, 0.051) 0.047 (0.046, 0.049) 0.044 (0.043, 0.045) 0.038 (0.037, 0.040) 0.024 (0.023, 0.025) σ2
w 0.950 (0.947, 0.952) 0.952 (0.949, 0.954) 0.954 (0.951, 0.957) 0.955 (0.953, 0.958) 0.962 (0.959, 0.965) 0.975 (0.973, 0.978) Intracluster correlation
coefficient
0.050 (0.048, 0.051) 0.049 (0.048, 0.051) 0.047 (0.046, 0.049) 0.044 (0.042, 0.045) 0.038 (0.037, 0.039) 0.024 (0.023, 0.025)
Cluster size variance 0 10.1 20.2 49.7 90.4 0
Empirical power 81.8% 80.0% 82.0% 81.7% 80.9% 83.9%
a
Patient outcomes are assumed to be unaffected by cluster merge. Total of 80 clusters with 20 patients in each prior to cluster merges. Data are mean (95% confidence interval).σ2
bis the between-cluster variance and
σ2
wis the within-cluster variance.
Corrigan
et
al.
Trials
2014,
15
:184
Page
7
o
f
1
3
http://ww
w.trialsjourn
al.com/cont
Heterogeneous cluster merges
Scenario 3
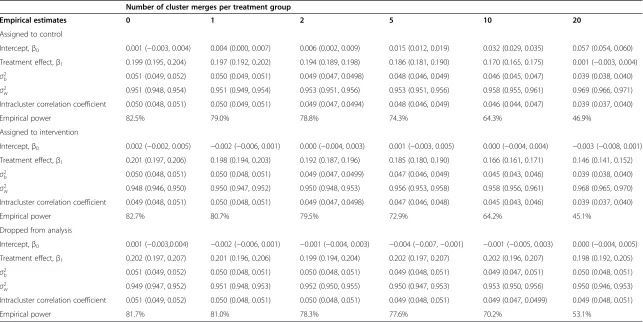
When each pair of merges consisted of one cluster from the control arm and one from the intervention arm, assuming patient outcomes are unaffected by the merge, the simulations demonstrated attenuation of the treat-ment effect if all merged clusters were assigned to one of the treatment groups, with the treatment effect esti-mate decreasing as the number of merges increased (Table 2). Unsurprisingly, the control group estimate
was biased when merged clusters were allocated to the control group. If the resulting merged clusters were dropped from the analysis, the treatment effect esti-mate was unbiased, as expected, but with a loss of precision.
As with the homogeneous merges, the ICC de-creased as the total number of merges inde-creased, but in this scenario the decrease was not sufficient to prevent the severe loss of power caused by the merges.
.76
.78
.8
.82
.84
Power
0 10 20 30 40
[image:8.595.61.538.89.301.2]Total merges
Figure 4Observed study power by number of homogeneous cluster merges.Data including all pairs of (k0,k1)∈M×Mof numbers of merges in each treatment group, with the overlay created using the Lowess procedure.
.025
.03
.035
.04
.045
.05
Mean ICC estimate
0 10 20 30 40
[image:8.595.60.538.491.704.2]Total merges
Table 2 Parameter estimates following heterogeneous cluster merges: scenario 3a
Number of cluster merges per treatment group
Empirical estimates 0 1 2 5 10 20
Assigned to control
Intercept,β0 0.001 (−0.003, 0.004) 0.004 (0.000, 0.007) 0.006 (0.002, 0.009) 0.015 (0.012, 0.019) 0.032 (0.029, 0.035) 0.057 (0.054, 0.060)
Treatment effect,β1 0.199 (0.195, 0.204) 0.197 (0.192, 0.202) 0.194 (0.189, 0.198) 0.186 (0.181, 0.190) 0.170 (0.165, 0.175) 0.001 (−0.003, 0.004)
σ2
b 0.051 (0.049, 0.052) 0.050 (0.049, 0.051) 0.049 (0.047, 0.0498) 0.048 (0.046, 0.049) 0.046 (0.045, 0.047) 0.039 (0.038, 0.040) σ2
w 0.951 (0.948, 0.954) 0.951 (0.949, 0.954) 0.953 (0.951, 0.956) 0.953 (0.951, 0.956) 0.958 (0.955, 0.961) 0.969 (0.966, 0.971) Intracluster correlation coefficient 0.050 (0.048, 0.051) 0.050 (0.049, 0.051) 0.049 (0.047, 0.0494) 0.048 (0.046, 0.049) 0.046 (0.044, 0.047) 0.039 (0.037, 0.040)
Empirical power 82.5% 79.0% 78.8% 74.3% 64.3% 46.9%
Assigned to intervention
Intercept,β0 0.002 (−0.002, 0.005) −0.002 (−0.006, 0.001) 0.000 (−0.004, 0.003) 0.001 (−0.003, 0.005) 0.000 (−0.004, 0.004) −0.003 (−0.008, 0.001)
Treatment effect,β1 0.201 (0.197, 0.206) 0.198 (0.194, 0.203) 0.192 (0.187, 0.196) 0.185 (0.180, 0.190) 0.166 (0.161, 0.171) 0.146 (0.141, 0.152)
σ2
b 0.050 (0.048, 0.051) 0.050 (0.048, 0.051) 0.049 (0.047, 0.0499) 0.047 (0.046, 0.049) 0.045 (0.043, 0.046) 0.039 (0.038, 0.040) σ2
w 0.948 (0.946, 0.950) 0.950 (0.947, 0.952) 0.950 (0.948, 0.953) 0.956 (0.953, 0.958) 0.958 (0.956, 0.961) 0.968 (0.965, 0.970) Intracluster correlation coefficient 0.049 (0.048, 0.051) 0.050 (0.048, 0.051) 0.049 (0.047, 0.0498) 0.047 (0.046, 0.048) 0.045 (0.043, 0.046) 0.039 (0.037, 0.040)
Empirical power 82.7% 80.7% 79.5% 72.9% 64.2% 45.1%
Dropped from analysis
Intercept,β0 0.001 (−0.003,0.004) −0.002 (−0.006, 0.001) −0.001 (−0.004, 0.003) −0.004 (−0.007,−0.001) −0.001 (−0.005, 0.003) 0.000 (−0.004, 0.005)
Treatment effect,β1 0.202 (0.197, 0.207) 0.201 (0.196, 0.206) 0.199 (0.194, 0.204) 0.202 (0.197, 0.207) 0.202 (0.196, 0.207) 0.198 (0.192, 0.205)
σ2
b 0.051 (0.049, 0.052) 0.050 (0.048, 0.051) 0.050 (0.048, 0.051) 0.049 (0.048, 0.051) 0.049 (0.047, 0.051) 0.050 (0.048, 0.051) σ2
w 0.949 (0.947, 0.952) 0.951 (0.948, 0.953) 0.952 (0.950, 0.955) 0.950 (0.947, 0.953) 0.953 (0.950, 0.956) 0.950 (0.946, 0.953) Intracluster correlation coefficient 0.051 (0.049, 0.052) 0.050 (0.048, 0.051) 0.050 (0.048, 0.051) 0.049 (0.048, 0.051) 0.049 (0.047, 0.0499) 0.049 (0.048, 0.051)
Empirical power 81.7% 81.0% 78.3% 77.6% 70.2% 53.1%
a
Patient outcomes are assumed to be unaffected by cluster merge, indicating that all treatments were finished prior to merge. Total of 80 clusters with 20 patients in each cluster prior to cluster merges. Data are mean (95% confidence interval).σ2
bis the between-cluster variance andσ2wis the within-cluster variance.
Corrigan
et
al.
Trials
2014,
15
:184
Page
9
o
f
1
3
http://ww
w.trialsjourn
al.com/cont
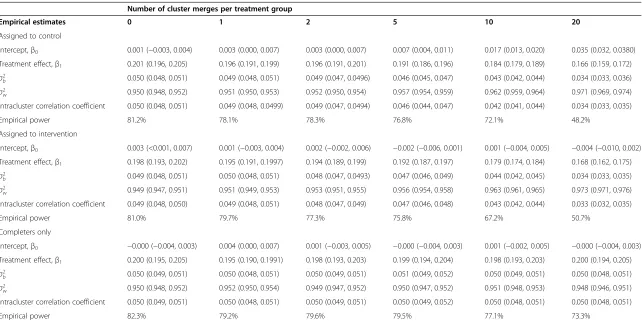
Scenario 4
Under the assumption of 50% of patients completing treatment prior to merges of one cluster from the con-trol arm with one cluster from the intervention arm, the impact of the heterogeneous merges on the treatment effect estimates again was attenuation of the treatment effect, but less extreme than under scenario 3 (Table 3). Variance components were affected as before, and the impact on study power, whilst substantial, was not as se-vere as it was under scenario 3.
If the analysis is restricted to those completing treat-ment prior to the cluster merge (labelled “Completers only” in Table 3), then the treatment effect estimates remained unbiased as expected, but the estimates are less precise because of the effective reduction in sample size. The ICC is unaffected by the number of merges, and study power is slightly affected. As with homoge-neous merges, the same patterns in estimates were ob-served when the number and size of clusters were varied, with very similar results by proportion of clusters merging.
Discussion
We have demonstrated, through established approaches to power calculation, that cluster merges have an ad-verse impact on study power, assuming that the ICC is unaffected by the change in average cluster size and vari-ability in cluster size. Given the way in which study power may be impacted if clusters merge, we suggest that allowance in this case may need to be made through recruitment of additional clusters rather than just by in-creasing the size of the clusters, which is the more com-mon approach when allowing for loss to follow-up, although a combination of the two may need to be con-sidered. This issue is closely related to that of variability in cluster size and loss to follow-up of clusters, in effect being a combination of the two. Consequently, the basis of allowance for cluster merges in the design could be through using established, previously published methods such as the one proposed by Taljaard et al. [16]. How-ever, given the cost of additional clusters, we suggest that the decision whether to allow for cluster merging will depend on the perceived likelihood of merges in any particular study and will be based on knowledge of the chosen participating sites.
The simulations suggest that homogeneous cluster merges do not affect the treatment effect estimate. In our present analysis, we assumed that the cluster size represents the whole cluster for each cluster, not just a subset of a larger cluster being analysed. Consequently, the anticipated loss in study power was offset by the change in the ICC, such that the impact was much smaller than expected. The linear relationship obtained between the estimate of ICC and the total number of
cluster merges indicates that the ICC depends on the average cluster size. This is in keeping with the relation-ship between ICC and natural cluster size that has been shown previously [17,18], with smaller ICC as the aver-age cluster size increases. This change in ICC would not occur if the size of the cluster represented the number from a larger cluster being analysed, because ICC is re-lated to the natural cluster size rather than the number sampled, and, in such circumstances, we would expect to see a loss in study power following any merges.
The simulations therefore indicate that the pragmatic approach to analysis, treating the new merged cluster as one cluster, if any homogeneous cluster merges occur is reasonable, without causing bias or loss of precision in treatment effect estimate.
The attenuation of the treatment effect estimate fol-lowing heterogeneous cluster merges is unsurprising, given the change in cluster composition, although we note that the impact is minimal when there are only a few cluster merges. For example, under scenario 3, the clusters resulting from the merge consist of an equal number of individuals from each treatment group, and we might then expect the outcome in these clusters to be (μ0+μ1)/2. Following assignment to either treatment
group, the treatment effect will be attenuated, either through an increase in mean response in the control group or a decrease in mean response in the interven-tion group. Consequently, assigning merged clusters to either treatment group in these circumstances will result in biased estimates.
Bias following heterogeneous merges can be avoided by dropping merged clusters from the analysis or by in-cluding only those individuals who completed treatment prior to the merge. In practice, this would require that any merged clusters discontinue the RCT.
In a review of 152 cluster RCTs in primary care, Eldridgeet al.reported an average cluster size of 32 and an interquartile range of 9 to 82 [19]. In our present study, we assessed three fixed cluster sizes—20, 40 and 100—that reflect the cluster sizes in RCTs carried out in primary care. We note that the findings in each scenario were dependent not on cluster size, only on the propor-tion of clusters merging. We would not expect the im-pact to be any different with larger cluster sizes.
Table 3 Parameter estimates following heterogeneous cluster merges: scenario 4a
Number of cluster merges per treatment group
Empirical estimates 0 1 2 5 10 20
Assigned to control
Intercept,β0 0.001 (−0.003, 0.004) 0.003 (0.000, 0.007) 0.003 (0.000, 0.007) 0.007 (0.004, 0.011) 0.017 (0.013, 0.020) 0.035 (0.032, 0.0380)
Treatment effect,β1 0.201 (0.196, 0.205) 0.196 (0.191, 0.199) 0.196 (0.191, 0.201) 0.191 (0.186, 0.196) 0.184 (0.179, 0.189) 0.166 (0.159, 0.172)
σ2
b 0.050 (0.048, 0.051) 0.049 (0.048, 0.051) 0.049 (0.047, 0.0496) 0.046 (0.045, 0.047) 0.043 (0.042, 0.044) 0.034 (0.033, 0.036) σ2
w 0.950 (0.948, 0.952) 0.951 (0.950, 0.953) 0.952 (0.950, 0.954) 0.957 (0.954, 0.959) 0.962 (0.959, 0.964) 0.971 (0.969, 0.974) Intracluster correlation coefficient 0.050 (0.048, 0.051) 0.049 (0.048, 0.0499) 0.049 (0.047, 0.0494) 0.046 (0.044, 0.047) 0.042 (0.041, 0.044) 0.034 (0.033, 0.035)
Empirical power 81.2% 78.1% 78.3% 76.8% 72.1% 48.2%
Assigned to intervention
Intercept,β0 0.003 (<0.001, 0.007) 0.001 (−0.003, 0.004) 0.002 (−0.002, 0.006) −0.002 (−0.006, 0.001) 0.001 (−0.004, 0.005) −0.004 (−0.010, 0.002)
Treatment effect,β1 0.198 (0.193, 0.202) 0.195 (0.191, 0.1997) 0.194 (0.189, 0.199) 0.192 (0.187, 0.197) 0.179 (0.174, 0.184) 0.168 (0.162, 0.175)
σ2
b 0.049 (0.048, 0.051) 0.050 (0.048, 0.051) 0.048 (0.047, 0.0493) 0.047 (0.046, 0.049) 0.044 (0.042, 0.045) 0.034 (0.033, 0.035) σ2
w 0.949 (0.947, 0.951) 0.951 (0.949, 0.953) 0.953 (0.951, 0.955) 0.956 (0.954, 0.958) 0.963 (0.961, 0.965) 0.973 (0.971, 0.976) Intracluster correlation coefficient 0.049 (0.048, 0.050) 0.049 (0.048, 0.051) 0.048 (0.047, 0.049) 0.047 (0.046, 0.048) 0.043 (0.042, 0.044) 0.033 (0.032, 0.035)
Empirical power 81.0% 79.7% 77.3% 75.8% 67.2% 50.7%
Completers only
Intercept,β0 −0.000 (−0.004, 0.003) 0.004 (0.000, 0.007) 0.001 (−0.003, 0.005) −0.000 (−0.004, 0.003) 0.001 (−0.002, 0.005) −0.000 (−0.004, 0.003)
Treatment effect,β1 0.200 (0.195, 0.205) 0.195 (0.190, 0.1991) 0.198 (0.193, 0.203) 0.199 (0.194, 0.204) 0.198 (0.193, 0.203) 0.200 (0.194, 0.205)
σ2
b 0.050 (0.049, 0.051) 0.050 (0.048, 0.051) 0.050 (0.049, 0.051) 0.051 (0.049, 0.052) 0.050 (0.049, 0.051) 0.050 (0.048, 0.051) σ2
w 0.950 (0.948, 0.952) 0.952 (0.950, 0.954) 0.949 (0.947, 0.952) 0.950 (0.947, 0.952) 0.951 (0.948, 0.953) 0.948 (0.946, 0.951) Intracluster correlation coefficient 0.050 (0.049, 0.051) 0.050 (0.048, 0.051) 0.050 (0.049, 0.051) 0.050 (0.049, 0.052) 0.050 (0.048, 0.051) 0.050 (0.048, 0.051)
Empirical power 82.3% 79.2% 79.6% 79.5% 77.1% 73.3%
a
In scenario 4, 50% of patient outcomes are assumed to be unaffected by cluster merge, which is akin to 50% completing treatment prior to merge, with the remainder allocated treatment group mean based on postmerge treatment group allocation. Total of 80 clusters with 20 patients in each prior to cluster merges. Data are mean (95% confidence interval).σ2
bis the between-cluster variance andσ2wis the within-cluster variance.
Corrigan
et
al.
Trials
2014,
15
:184
Page
11
of
13
http://ww
w.trialsjourn
al.com/cont
an average cluster size and do not take this into account when calculating sample size [20]. On the basis of the work presented herein, it might be expected that the im-pact of clusters merging may be less when the variability in cluster size has already been considered, but further work is needed to understand the consequences in this situation.
Although we have used primary care as the motivating example throughout this article, given the reduction over time in the number of GP practices within the United Kingdom [3], the results presented herein can be applied to other areas if there is a risk of cluster merges.
We have not yet considered other ways in which the cluster composition may change, such as merges with clusters not originally participating in the RCT, which is not likely to lead to biased estimates, but power is likely to be affected as the cluster size increases or if more than two clusters are merged. In addition, clusters may fragment, resulting in more clusters of smaller average size. Again, treatment estimates will be unbiased if ori-ginal treatment allocation applies, but power will be af-fected. However, consideration would need to be given to whether these ‘new’ clusters should remain in the same treatment arm of the RCT, because it might be more appropriate to randomise if cluster members are to participate. Cluster membership may also fluctuate during the course of the study without merging or frag-mentation of clusters, particularly in primary care, where patients leave and join a practice, an issue discussed by Diehret al.[21] in relation to survey design.
The CONSORT extension for cluster RCTs requires the flow of clusters, as well as the flow of patients, to be described. Our review of the literature indicates that, even when authors have revealed changes to clusters, they did not do so in a manner that allowed full under-standing. Clearly, authors need to follow reporting guidelines more closely, and journal editors should em-phasise the need to do so. Investigators also need to consider whether changes need to be made to protocols, either to preempt any possible changes to cluster com-position, defining up front how they should be dealt with or in response to such changes.
Conclusions
Adjusting the design effect in power calculations for variability in cluster size and changes in average cluster size, we note that merging of clusters in cluster RCTs is expected to result in a loss of power. However, the simu-lations conducted examining homogeneous cluster merges resulted in a much smaller loss of power, to the extent of being largely unimportant, because the ob-served ICC decreased. This suggests that the relation-ship of ICC with cluster size should not be ignored at the planning stage.
A pragmatic approach in which the merged clusters are analysed as one new cluster, following homogeneous cluster merges, results in acceptable treatment effect es-timates, so such merges should not cause concern. How-ever, heterogeneous merges are problematic, leading to biased treatment effect estimates unless merged clusters are discontinued. If such clusters are discontinued, the estimate is unbiased, but with a loss of precision. Allow-ance for loss to follow-up at the cluster level as well as at the individual level might be advisable at the planning stage of a cluster RCT. Further research is warranted to fully understand the impact of other changes to clusters postrandomisation and to develop appropriate ap-proaches to statistical analysis.
Additional file
Additional file 1:Simulation code.Example code (in Stata 12 software) for the simulations conducted to explore the impact of cluster merging.
Abbreviations
CONSORT:Consolidated Standards of Reporting Trials; GP: General practitioner; ICC: Intracluster correlation coefficient; RCT: Randomised controlled trial.
Competing interests
The authors declare that they have no competing interests.
Authors’contributions
KLS conceived and designed the study and wrote the draft manuscript. NC participated in the study design, reviewed reports of trials, developed a program to explore impact on study power and contributed to the simulation study. MJGB participated in the study design, reviewed reports of trials and contributed to the simulation study. LG reviewed reports of trials and surveyed trial authors and clinical trial units. All authors commented on drafts of the manuscript and read and approved the final manuscript.
Acknowledgements
We thank John Brookes for reviewing reports of cluster randomised trials. NC received funding to undertake his master’s degree in medical statistics from the National Institute for Health Research, and his contribution to this project formed part of his dissertation. This project received no specific funding.
Author details
1Department of Health Sciences, University of Leicester, 22-28 Princess Road
West, Leicester LE1 6TP, UK.2Clinical Trials Research Unit, University of Leeds, Leeds LS2 9JT, UK.3Health Services Research Unit, Keele University, Keele ST5 5BG, UK.
Received: 8 November 2013 Accepted: 6 May 2014 Published: 24 May 2014
References
1. Hayes RJ, Moulton LH:Cluster Randomised Trials.Boca Raton FL: Chapman & Hall/CRC Press; 2009.
2. Eldridge S, Kerry S:A Practical Guide to Cluster Randomised Trials in Health Services Research.Chichester, UK: John Wiley & Sons; 2012.
3. Gregory S:General Practice in England: An Overview (Briefing).London: The King’s Fund; 2009. Available at http://www.kingsfund.org.uk/sites/files/kf/ general-practice-in-england-overview-sarah-gregory-kings-fund-september-2009.pdf.; (accessed 14 May 2014).
files/kf/improving-quality-of-care-general-practice-independent-inquiry-report-kings-fund-march-2011_0.pdf.; (accessed 15 May 2014).
5. Campbell MK, Elbourne DR, Altman DG; CONSORT Group:CONSORT statement: extension to cluster randomised trials.BMJ2004,328:702–708. 6. Foy R, Eccles MP, Hrisos S, Hawthorne G, Steen N, Gibb I, Croal B, Grimshaw
J:A cluster randomised trial of educational messages to improve the primary care of diabetes.Implement Sci2011,6:129.
7. Schermer TR, Akkermans RP, Crockett AJ, van Montfort M, Grootens-Stekelenburg J, Stout JW, Pieters W:Effect of e-learning and repeated per-formance feedback on spirometry test quality in family practice: a cluster trial.Ann Fam Med2011,9:330–336.
8. Donner A, Birkett N, Buck C:Randomization by cluster: sample size requirements and analysis.Am J Epidemiol1981,114:906–914. 9. Hemming K, Girling AJ, Sitch AJ, March J, Lilford RJ:Sample size
calculations for cluster randomised controlled trials with a fixed number of clusters.BMC Med Res Methodol2011,11:102.
10. Kerry SM, Bland JM:Unequal cluster sizes for trials in English and Welsh general practice: implications for sample size calculations.Stat Med2001, 20:377–390.
11. Lake S, Kammann E, Klar N, Betensky R:Sample size re-estimation in cluster randomization trials.Stat Med2002,21:1337–1350.
12. Eldridge SM, Ashby D, Kerry S:Sample size for cluster randomized trials: effect of coefficient of variation of cluster size and analysis method.Int J Epidemiol2006,35:1292–1300.
13. Kong SH, Ahn CW, Jung SH:Sample size calculation for dichotomous outcomes in cluster randomization trials with varying cluster size. Drug Inf J2003,37:109–114.
14. Manatunga AK, Hudgens MG, Chen S:Sample size estimation in cluster randomized studies with varying cluster size.Biom J2001,43:75–86. 15. Twisk JWR:Applied Multilevel Analysis: A Practical Guide for Medical
Researchers.Cambridge, UK: Cambridge University Press; 2006. 16. Taljaard M, Donner A, Klar N:Accounting for expected attrition in the
planning of community intervention trials.Stat Med2007,26:2615–2628. 17. Donner A:An empirical study of cluster randomization.Int J Epidemiol
1982,11:283–286.
18. Gulliford MC, Ukoumunne OC, Chinn S:Components of variance and intraclass correlations for the design of community-based surveys and intervention studies: data from the Health Survey for England 1994. Am J Epidemiol1999,149:876–883.
19. Eldridge SM, Ashby D, Feder GS, Rudnicka AR, Ukoumunne OC:Lessons for cluster randomized trials in the twenty-first century: a systematic review of trials in primary care.Clin Trials2004,1:80–90.
20. Kerry SM, Bland JM:Sample size in cluster randomisation.BMJ1998, 316:549.
21. Diehr P, Martin DC, Koepsell T, Cheadle A, Psaty BM, Wagner EH:Optimal survey design for community evaluations: cohort or cross-sectional. J Clin Epidemiol1995,48:1461–1472.
doi:10.1186/1745-6215-15-184
Cite this article as:Corriganet al.:Changing cluster composition in cluster randomised controlled trials: design and analysis considerations.
Trials201415:184.
Submit your next manuscript to BioMed Central and take full advantage of:
• Convenient online submission
• Thorough peer review
• No space constraints or color figure charges
• Immediate publication on acceptance
• Inclusion in PubMed, CAS, Scopus and Google Scholar
• Research which is freely available for redistribution
Submit your manuscript at www.biomedcentral.com/submit
Corriganet al. Trials2014,15:184 Page 13 of 13