Eff e c t of filt r a ti o n c o effici e n t
d e t e r m i n a ti o n m e t h o d o n t h e
s c a l e e ff e c t i n w a t e r-s a t u r a t e d
fi n e-g r a i n e d s oils
Ro si n e , T N a n d To m a-S a b b a g h , T M
h t t p :// dx. d oi.o r g / 1 0 . 1 0 0 7 / s 1 1 2 0 4-0 1 7-9 4 1 5-y
T i t l e Eff e c t of filt r a ti o n c o effici e n t d e t e r m i n a ti o n m e t h o d o n t h e s c al e e ff e c t in w a t e r-s a t u r a t e d fin e-g r a i n e d s oils
A u t h o r s Ro si n e , T N a n d To m a-S a b b a g h , T M
Typ e Ar ticl e
U RL T hi s v e r si o n is a v ail a bl e a t :
h t t p :// u sir. s alfo r d . a c . u k /i d/ e p ri n t/ 4 3 3 6 0 / P u b l i s h e d D a t e 2 0 1 7
U S IR is a d i gi t al c oll e c ti o n of t h e r e s e a r c h o u t p u t of t h e U n iv e r si ty of S alfo r d . W h e r e c o p y ri g h t p e r m i t s , f ull t e x t m a t e r i al h el d i n t h e r e p o si t o r y is m a d e f r e ely a v ail a bl e o nli n e a n d c a n b e r e a d , d o w nl o a d e d a n d c o pi e d fo r n o
n-c o m m e r n-ci al p r iv a t e s t u d y o r r e s e a r n-c h p u r p o s e s . Pl e a s e n-c h e n-c k t h e m a n u s n-c ri p t fo r a n y f u r t h e r c o p y ri g h t r e s t r i c ti o n s .
1
EFFECT OF FILTRATION COEFFICIENT DETERMINATION METHOD
ON THE SCALE EFFECT IN WATER-SATURATED FINE-GRAINED SOILS
T.N Rosine1, T. Toma Sabbagh2
1 Ph.D. student, Civil Engineering Research Group, The University of Salford, School of
Computing, Science and Engineering, Newton Building, Salford, Greater Manchester, M5 4WT, UK. Email: [email protected]
2 Lecturer, Civil Engineering, The University of Salford, School of Computing, Science and
Engineering, Newton Building, Salford, Greater Manchester, M5 4WT, UK. Email: [email protected]
Abstract: The coefficient of permeability is an imperative engineering property of soils and it
is used in some engineering problems such as modelling of underground flow. Its determination based on measured characteristics can significantly reduce the conclusion aspect. The coefficient of permeability can be derived from the following measured parameters: coefficient of consolidation (cv), coefficient of compressibility (av), coefficient of volume compressibility
(mv), average particle size (D10) and void ratio (e). In the current study, the coefficient of
permeability was calculated from the one-dimensional consolidation tests and previous researchers derived formula. The outcome was compared with the estimated value within PLAXIS. A simulation of both permeability parameters were modelled in PLAXIS in terms of sample scale effect using the Mohr-Coulomb (MC) model. The sample scale effect was due to the variation in the diameter to height ratio of the soil profile. The results showed that there was a significant difference in the soil behaviour between the calculated and estimated permeability. The excess pore pressure at different scale was found to be well represented using the estimated permeability as compared to the calculated value that is due to the variability of the permeability coefficient during consolidation and scale effect.
Keywords: Coefficient of Permeability, Consolidation, Excess pore pressure, Fine-grained soil, Scale effect
1. Introduction
Since water movement within the soil is through void spaces, the larger the void space, the
greater the permeability. Coarse-grained soils specifically sand, exhibit higher permeability as
compared to the fine-grained soil like clay, which has a lower permeability [1]. Hence, the
2
ratio, with the major factor being the particle size and void ratio. There are numerous methods
derived over the past few decades in obtaining the coefficient of permeability (k) of fine-grained soils in the laboratory using the falling head method and one-dimensional test
(permeameter).
Over the past few decades, several models were developed to show the relationship between
permeability and particle size [2]. [3] mentioned that, [4] performed statistical power regression
analyses on 19 sets of data and the coefficient of permeability (k) was found to have a relationship with soil grain size as shown in equation 1:
[1] k = cD101.65 to 1.85
where c is a constant and D10 is the average particle size.
The limitation of using equation 1 is that it was developed on sand soils and hence gives
inaccurate results when applied on fine-grained soils [3]. However, [3] developed a new
relationship between permeability and grain size using regression analysis as shown in equation
2:
[2] k = (D102)*(e3)
where k is the coefficient of permeability (m/s), D10 is the average particle size (mm), to such
an extent that 10% of the particles are finer than that size (dimensionless)and e is the void ratio (dimensionless). Also to equation 1 and 2, the soil permeability can also be obtained using the
relationship between cv, mv and av.
[3] k = cvmvγw
[4] k = 𝑐𝑣𝑎𝑣𝛾𝑤
1+𝑒
where cv is the coefficient of consolidation (m2/yr), mv is coefficient of volume compressibility
(m2/MN), a
v is the coefficient of compressibility, e is the void ratio and γw is the unit weight of
water (kN/m3). Equating equation 2 and 3, a new equation for c
v is shown below:
[5] cv =
𝐷102 𝑥 𝑒3 𝑚𝑣𝛾𝑤
3
The outcome is related to the standard D/H ratio recommended for consolidation analysis by the British and American standard.
2. Diameter to height ratio scale
Series of Oedometer tests were conducted at different D/H ratio as depicted in Table 1 with the soil properties shown in Table 2. The Kaolin clay used was provided by Cornwall Council
England. For valid comparison in the D/H ratio, the average of the initial moisture content was considered. The sample preparation and test setup as described in the British and American
standard [6] and [7] were adopted. The test was run over a period of 24 hours at certain load
increments (55 – 276kPa) under double drainage. Data were obtained using a computerised
system connected to each Oedometer test with an accuracy of ±0.1%. The system was able to
read data from six channels simultaneously. During the consolidation tests, the coefficient of
permeability (k) was not measured due to the lack of facilities but was calculated from previous researcher’s derivations.
Table 1: Scale range Oedometer tests [5]
D/H 0.5 1 1.2 2 (a) 2 (b) 3 4 5 6.5 11
Diameter (mm) 100 150 250 150 250 250 100 150 150 250
Height (mm) 200 130 200 80 130 80 23 30 23 23
Tests T1 T2 T3 T4 T5 T6 T7 T8 T9 T10
Initial moisture content
91% 74% 55% 65% 55% 55% 80% 60% 59% 64%
Average moisture content
[image:4.595.65.528.391.559.2]66%
Table 2: Soil Properties summary [5]
LL PL PI Gs cu (kN/m2) Mineralogy
Kaolin clay
63% 32.4% 30.6% 2.6 0.28 – 12 Kaolinite and Quartz
where LL is the liquid limit (%), PL is the plastic limit (%), PI is the plasticity index (%), Gs is the specific gravity
and cu is the undrained shear strength (kN/m2)
3. Finite element model
To model the saturated fine-grained soil, the coefficient of permeability is vital for PLAXIS as
it uses this parameter during the consolidation analysis. The Mohr-Coulomb (MC) model is used with soil void ratio varying from 1.2 to 2.5. The calibration of the finite element model
4
3.1. Coefficient of permeability model parameters
The one-dimensional model was completed using an axisymmetric and discretized 16 nodes
element. The young’s modulus was assumed to be 1000 kN/m2, and the estimated coefficient
of permeability (k) was employed in PLAXIS with a constant value of 5.5x10⁻⁷ m/s. The estimated k value in PLAXIS was gained using the inputted initial void ratio. The boundary conditions were set as permeable at both the top and bottom of the soil profile with the side
being impermeable. The vertical load was applied in double increments to achieve comparative
curve to the experimental data. The calculated k values are shown in Table 3.
Table 3: Calculated coefficient of permeability (kc)
Scale D/H
0.5
D/H 1 D/H
1.2
D/H 2(a)
D/H 2(b)
D/H 3 D/H 4 D/H 5 D/H
6.5
D/H 11
kc2 (x10-6) 1.28 0.61 0.67 0.52 0.60 0.14 0.71 0.29 0.35 0.35
kc3 (x10-9) 0.023 0.00094 0.00064 0.00019 0.00012 0.00024 0.00072 0.00045 0.00041 0.00014
where kc2 is the coefficient of permeability calculated using equation 2 (m/s) and kc3 is the coefficient of
permeability calculated using equation 3 (m/s).
3.2. Results
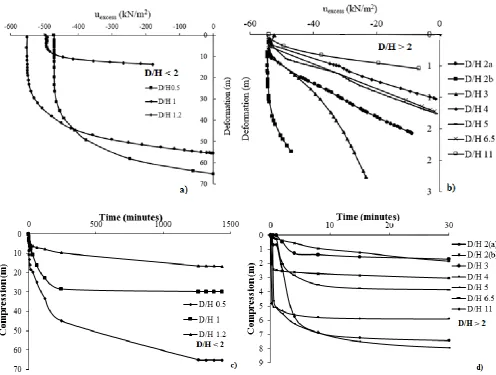
1) Excess pore pressure distribution
During double drainage consolidation tests, the excess pore pressure (uexcess) occurs at the
mid-depth of the soil profile. For accurate and precise determination of the compressibility
parameters and uexcess, the American and British Standard recommended a D/H ratio of 2.5 and
4 respectively. Theoretically, the excess pore pressure is obtained from the relationship of
effective and total stress. uexcess is also obtained by multiplying the unit weight of water by the
soil height [8]. Data are presented in terms of three drainage scenarios with kc: Case1
(horizontal drainage), Case 2 (vertical and horizontal drainage) and vertical drainage.
2) Estimated coefficient of permeability (ke)
[5] investigation revealed that at D/H less than 2, fluctuations in behaviour are found as compared to D/H greater than 2. The minor difference with the Standard is not significant as the findings still validate that stated in the British and American Standard. Figure 1 shows the
behaviour of the soils using the estimated k value compared the experimental outcome. From
5
[image:6.595.73.570.121.496.2]indicating the important of selecting the appropriate value for the D/H ratio as per the Standard. Similar patterns were observed at load increment ranging between 110kPa to 276kPa.
Figure 1: Numerical and experimental analysis of the effect of sample scale on on fine grained soil using the estimated coefficient of permeability; a) and b) FEM and c) and
d) Experimental
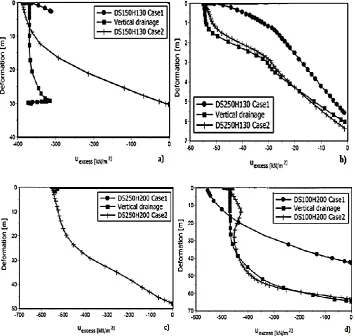
3) Calculated coefficient of permeability (kc)
It was noted that the estimated coefficient of permeability (ke) presented identical and
consistent result for both drainage scenarios (case 1 and 2) (Figure 1). However, when the
calculated coefficient of permeability (kc2) was used during simulation, a drastic change in
performance was noted in case 1 and 2. Figures 2 to 5 also complements soil behaviour under
sample height and D/H ratio scale. DS150H130 (Figure 2a) was further corrected using a higher strength value of 150kN/m2. This was found to be successful only in case 2 when using kc2. At
6
case 1 (depicted in Figure 2c) and ended when a strength value of 200kN/m2 was used in case
2. DS100H200 (Figure 2d) strength value of 55kN/m2 was used in case 2, and case 1 was corrected using 200kN/m2.
Calculated coefficient of permeability kc2 and kc3 obtained using equation 2 and 3 respectively
were used during the analysis. From the parameters depicted in Table 3, the relationship of the
soil behaviour is shown in Figures 2 to 5. Figure 2 follows the same pattern as Figure 1 except
at D/H 1.2 (DS250H200). This array contradicts findings in Figure 1 where at D/H greater than 2, accurate uexcess illustration was observed. There is a maximum difference of 1% and 5% at
D/H 0.5 (DS100H200) and 1 (DS150H130) using kc2 and kc3 respectively. D/H 1.2
[image:7.595.74.430.294.630.2](DS250H200) at kc2 is 89% less than that achieved using ke.
Figure 2: Effect of different drainage scenarios under the calculated coefficient of permeability (kc2) at 55kPa (Where: case 1 is the horizontal drainage scenario and case 2 is combined
7
Figure 3: Effect of different drainage scenarios under the calculated coefficient of permeability (kc2) at 55kPa (continue) (Where: case 1 is the horizontal drainage scenario and case 2
is combined vertical and horizontal drainage)
8
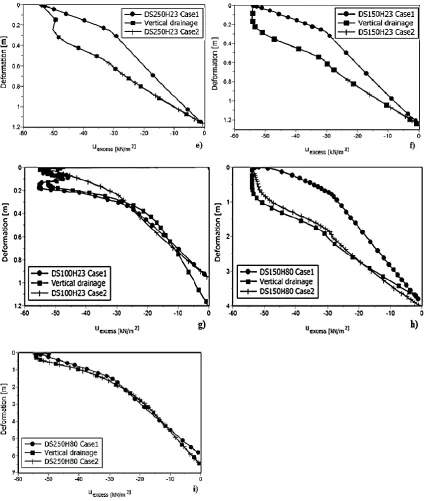
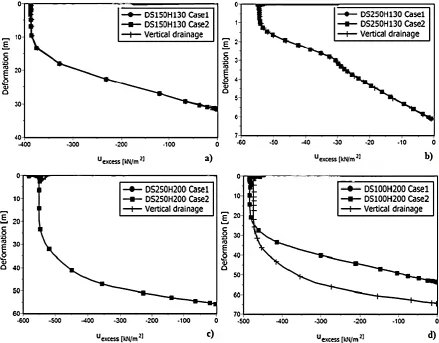
remaining drainage condition at all sample diameter scale except at DS100H23 where the difference is disproportional.
Case 1 drainage type was not successfully applied with kc2 as shown in Figure 4a, b, c, d and
Figure 5e, where the variation in D/H = 1, 2(b), 1.2, 0.5 and 11 respectively is inconclusive. The failure of case 1 was due to NAN (Not a Number) found. NaN only occurs when the field elements are in a plastic state. As a resolution, the strength of the soil material is increased, or
a linear elastic soil material could be used [9]. This is because during consolidation, as the load
increases, the soil behaviour changes from elastic to plastic which is affected by the strength
and compressibility characteristics of the soils. Therefore, the significant variation between the
drainage type in both Figures 2 to 5 are mainly incorporated with sample scale and the
permeability factors. This is because, in PLAXIS, the consolidation is modelled using the
permeability value. Hence, this findings shows not only the importance of the permeability
[image:9.595.74.514.357.700.2]values but that of the effect of drainage type at several DS.
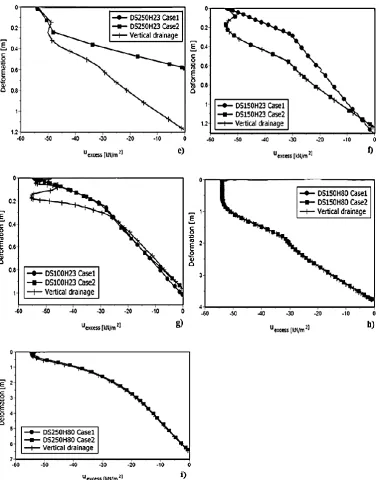
Figure 4: Effect of various drainage scenarios under the calculated coefficient of permeability (kc3) at 55kPa (Where: case 1 is the horizontal drainage scenario and case 2 is combined
9
Figure 5: Effect of various drainage scenarios under the calculated coefficient of permeability (kc3) at 55kPa (continue) (Where: case 1 is the horizontal drainage scenario and case 2
is combined vertical and horizontal drainage)
The cv value was obtained using the Taylor’s method at 55kPa in the calculation of k. cv values
ranged from 0.75 – 13.7 m2/yr and mv from 0.0007 - 0.006 m2/MN. There is a 57% decrease in
excess pore pressure at D/H 0.5 (DS100H200) from the estimated ke value and a fluctuation in behaviour in the remaining scale. It can thus be stated that the calculated k value using equation
10
was a 99% increase in uexcess as compared to the estimated findings. Hence, the calculated
coefficient of permeability k using equation 3 is not applicable where the scale is an issue (D/H
< 2 and D/H = 5).
4. Conclusion
The current study evaluates the difference between the calculated and estimated coefficient of
permeability (k). The calculated kc value from equation 3 was compared with that derived by
[3] using regression analysis and that estimated from PLAXIS. The findings show that, in terms
of excess pore pressure and scale, equation 3 is more effective as the measured parameters
reflect the soil behaviour. The estimated value presented more accurate findings at all the
sample scale as compare to kc. On the contrary, equation 2 by [3] was also valid but not at D/H
less than 2. Equation 3 is especially valuable to D/H 0.5 where excess pore pressure was faintly observed at the centre of the soil matrix. Both calculated and estimated k values showed to have a negligible error in excess pore pressure. However, this error is significant on cv and the
significance was corrected with a correction factor of 0.677. Therefore, it was proposed that
equation 2 and 3 when equated provides a new relationship for cv as shown in equation 5.
REFERENCES
1. C. Liu, and J.B. Evett, "Soils and Foundations. SI Edition,"Prentice Hall, (2005).
2. F.D. Masch, and K.J. Denny, "Grain size distribution and its effect on permeability,"Water Resources Research, 2(4): 665 – 677 (1966).
3. A. Singh, and S. Noor, "Estimation of soil permeability using soil index properties," International Journal of Latest Trends in Engineering and Technology (IJLTET), 1(4): 31 – 33 (2012).
4. R.G. Shepherd, "Correlations of permeability and grain size,"Ground water, 27 (5): 633 – 638 (1989).
5. T.N. Rosine, and T.T. Sabbagh, "The impact of the diameter to height ratio on the compressibility parameters of saturated fine-grained soils," International Journal of Research and Engineering Technology, 4(5): 8 – 19 (2015).
6. British Standard, BS1377: PART 2, "Methods of tests of soils for civil engineering purposes – Classification Tests," (1990).
7. American Society For Testing And Materials, ‘D4318’, "Standard test method for liquid limit,"Plastic limit and plasticity index of soils, (2010).
8. J.E. Bowles, J.E, "Foundation analysis and design,"Second edition, McGraw-hill Kogakusha Ltd (1977)
![Table 2: Soil Properties summary [5]](https://thumb-us.123doks.com/thumbv2/123dok_us/8689950.876904/4.595.65.528.391.559/table-soil-properties-summary.webp)