International Journal of Emerging Technology and Advanced Engineering
Website: www.ijetae.com (ISSN 2250-2459,ISO 9001:2008 Certified Journal, Volume 5, Issue 1, January 2015)
146
Power Spectrum Estimation of Fullerene at Different
Temperatures
Rashid Nizam
1, Mirza Mohd Sehban
2, Shabina Parveen
31,2
Department of Physics, IFTM University, Moradabad, India
3Department of Botany Pt. L. M. S. Govt. Autonomous P. G. College, Rishikesh, India
Abstract— The power spectrum of a fullerene has been calculated using classical molecular dynamics simulation. The empirical bond-order Tersoff-Brenner potential has been utilized for carbon-carbon interaction with rises in temperature. The total energy, potential energy and power spectra of fullerene (C60) has been evaluated. It is observed
that the power spectra of fullerene are shifted from higher frequencies to lower frequencies with decrement in the frequencies as the temperature increases. It is interesting to note that the main peaks showed universal temperature dependence in fullerene (C60) and the nature of the simulated
results agree well with the experimental results available in literature.
Keywords-- Fullerene, Tersoff-Brenner potential and Power spectrum
I. INTRODUCTION
Nanomaterials have been the subject of enormous interest over the past decade. These materials are extremely small in size and have the potential for wide ranging industrial, biomedical and electronic applications. Nanomaterials can be metals, ceramics, polymeric materials etc [1-5]. The size of these nanomaterials are from 1-100 nm are of current interest because of noble physical and chemical properties that they may differ from those of the corresponding bulk material [1, 2].
Hollow carbon nanospheres were discovered in 1985. These spheres were called buckyballs or fullerene. Several physical properties such as bulk modulus and Debye temperature have been studied for bulk fullerene still less literature is available for a single fullerene [3-7]. The complete characterization of the thermal properties of fullerene is of a great importance for numerous applications.
II. MODEL DETAILS
Pure carbon, fullerene that has taken which is in the form of a cage like structure. The most common is buckminsterfullerene (bucky-ball) with 60 carbon atoms arranged in a spherical structure of radius ~ 3.55 Å following the symmetry of a truncated icosahedrum.
In this molecule, each carbon atom of fullerene has four valence electrons is bounded to the three nearest carbon atoms. The molecule fullerene (C60) is formed by 30 double
and 60 single bounds. The distances between atoms in single and double bonds of fullerene (C60) are 1.45 and
1.37 Å, respectively. In the study of the electronic properties of the C60 it is frequent considered that only the
four valence electrons 2s, 2px, 2py, 2pz of each carbon atom. Each of the 60 atomic orbitals 2pz is aligned in the radial direction i.e. leading to the p molecular states. The other three atomic orbitals 2s, 2px, 2py are distributed in the tangential plane to the molecular surface at the carbon atom position producing s molecular states in the direction of the molecular bonds. The lineal combination of these three orbitals at each atomic site produces three sp² hybrid orbitals, one is in the direction of the double bond and the other two are aligned with the single bonds. The 60 p
orbitals are relevant for the conductivity properties of the molecule, as in the case of graphite, and the 180 s orbitals are mainly responsible for the elastic properties (see Fig.1). In order to study the effect of temperature on carbon nanotube vibrational properties, a fullerene (C60) is taken.
Figure 1 Pure fullerene with 60 atoms
III. CALCULATIONS
International Journal of Emerging Technology and Advanced Engineering
Website: www.ijetae.com (ISSN 2250-2459,ISO 9001:2008 Certified Journal, Volume 5, Issue 1, January 2015)
147
The common ways to integrate the bond order potential within the molecular force field have been discussed. [22] They are based either on partitioning, or switching-on no bonded interactions. If the phenomenon investigated does not involve then structural changes in the bonding network, as in the case with fullerene, the situation is simplified and in the simulation we treat fullerene (C60) as a molecule;thus defining no bonded interactions as intermolecular only. The Hamiltonian of the fullerene (C60) is given by
(1)
(2)
Where the attractive, VA(ri j), and repulsive, VR(ri j),
parts of the potential are modeled by a general Morse function,
(3)
(4)
Parameters of potential model.
R0/Å 1.315
eV 6.325
Βij 1.5
Sij 1.29
αijk 0
δ 0.80469
R1/Å 1.7
R2/Å 2
a0 0.011304
b0 19
c0 2.5
The cut-off function, fc(ri j), is unity for first neighbors
and zero otherwise. The many-body nature of the potential
is hidden in the bond order parameter i j, which is a
function of the coordination,
(5)
Where θjik is the angle between ri j and rik , prime on
sums denotes summation over first neighbors only, and
Gi(θ i jk) is three-parameter angular function,
(6)
The force on atom i arising from a bond-order potential,
(7)
All parameters of this model are recorded in the Table I match with the original paper of Brenner.[21] Molecular dynamics simulations were performed on samples formed by rolling a perfect graphene sheet to form fullerene (C60).
The system contains 60 carbon atoms. Periodic boundary conditions were used in the direction of fullerene (C60) axis
to avoid boundary effect. The initial condition for each molecule is usually assigned by giving the velocity
in the random directions for all monatomic molecules. The Maxwell-Boltzmann velocity distributions are obtained after some equilibration calculations. The equilibrium system is calculated for constant temperature. The simple temperature control of the equilibrium system can be computed by just scaling the
velocity of molecules as with the current temperature T and the desired temperature TC. This control
International Journal of Emerging Technology and Advanced Engineering
Website: www.ijetae.com (ISSN 2250-2459,ISO 9001:2008 Certified Journal, Volume 5, Issue 1, January 2015)
[image:3.612.133.553.98.374.2]148
Figure 2 Potential Energy of C60
All simulations were achieved in the micro-canonical ensemble using the leapfrog Verlet algorithm with a time step of 2 fs. First, the system was run for typically 10 000 time steps. This was done to obtain a desired temperature by coupling the system to a thermostat with the specified temperature using the Nose–Hoover method. [22]Initially, the equilibration period non-bonded interactions in the form of Lennard-Jones potential were added to all pairs separated by at least three neighbors. This facilitates equi-partitioning of the energy between different modes of fullerene (C60). The phonon spectral densities were
computed according to linear response theory from the Fourier transform of the velocity autocorrelation function,
(8)
IV. RESULTS AND DISCUSSION
The potential energies of fullerene (C60) are given by
these in eqn. (2) and are shown in figure 2. The temperatures are maintained with Nose–Hoover thermostat and the total energy is calculated through equation (1) which is shown in figure 3. In both figures the green, dark blue, red and brown colours represent the potential energy at 1200K, 900K, 600K and 300K respectively
[image:3.612.182.431.481.633.2]International Journal of Emerging Technology and Advanced Engineering
Website: www.ijetae.com (ISSN 2250-2459,ISO 9001:2008 Certified Journal, Volume 5, Issue 1, January 2015)
149
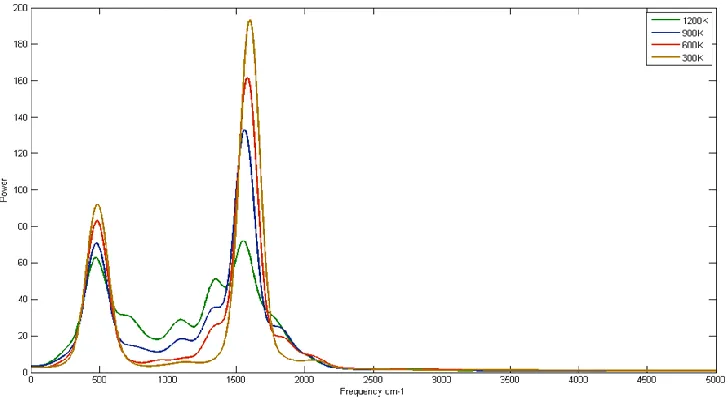
The power spectrum of fullerene (C60) is presented infigure 4.
[image:4.612.125.489.172.380.2]The figure is representing four different temperatures of fullerene (C60) 300 K, 600 K, 900K and 1200 K.
Figure 4 Power Spectrum of C60
Each simulated power spectra represents the distribution of power among the various vibrations of respective model atoms at that particular temperature. The simulated power spectrum of fullerene gives two significant peaks at three different temperatures 300K, 600K, 900K and four significant peaks at 1200K temperature. The temperature dependence calculated peaks of carbon nanotubes are also observed experimentally [20]. Similarly the power spectrum of fullerene (C60) gives four significant peaks at
300K, 600K, 900K and 1200 K temperature as shown in figure 4. With rise in temperature, the distribution of power again redistributes among the various model atoms. It is significant to note that different peaks in each spectra of each model appear to move from higher frequency to lower frequency as the temperature increase. Besides the main peaks of each spectrum broaden in width, decreases in intensity as the temperature increase. The decreases peak shift frequency, broaden width, decreases intensity in fullerene with rise in temperature are known as the temperature dependence peaks. The temperature dependences have been measured experimentally in various carbon materials, such as SWNTs, [23-27] multi-walled carbon nanotubes (MWNTs), [28]) double-walled carbon nanotubes (DWNTs [22]) and graphite.[24] Strong temperature dependences of Raman scattering spectra have been pragmatic from in-situ measurements performed during the growth stage of SWNTs. [27]
The present result is comparable to experimental result that the fullerene may be damaged or burned when high power excitation laser light is tightly focused with a high magnification objective lens. Thus the intensity and the frequency of each model get changes after changing the respective model temperature. In one paper temperature dependence of Raman scattering only from single-walled carbon nanotubes has calculated i.e. undefined radial breathing mode peaks at high temperatures leaving the all spectra of carbon nanotube [29]. Though the fullerene nature of temperature dependency in present power spectra and simulated Raman temperature dependency in carbon nanotube are almost same [29] yet in present power spectrum paper represent the power of each model gets redistributed among its model atoms as the temperature change. This is due to the an-harmonic components of bonding force become important owing to phonon-phonon relations at high temperatures. Thus the an-harmonicity supports thermal expansion and decreases the force constant of bonds.
V. CONCLUSION
International Journal of Emerging Technology and Advanced Engineering
Website: www.ijetae.com (ISSN 2250-2459,ISO 9001:2008 Certified Journal, Volume 5, Issue 1, January 2015)
150
The peaks shift of the carbon nanotubes and fullerene exhibited universal temperature dependence for all carbon nanotubes samples and all excitation wavelengths investigated, hence the temperature of fullerene samples can conveniently be measured based on the changes in the peak position. The peaks also demonstrated temperature dependences, such as downshifts of the Raman frequency with broadening of the peak width, and reduction in the intensities with increasing temperature. Besides it is demonstrated that the several peaks could not be assigned to any chiral indices which the intensities of those unassigned peaks were very weak at room temperature (300K) and increased with increasing temperature.REFERENCES
[1] S. Ijima and T. Ichihashi, Single-shell carbon nanotubes of 1-nm diameter Nature 363, 603 (1993).
[2] R. Saito, G. Dresselhaus, and M.S. Dresselhaus, Physical Properties of Carbon Nanotubes (Imperial College Press, London, (1998). [3] A. Jorio, G. Dresselhaus, and M. S. Dresselhaus, Carbon Nanotubes:
Advanced Topics in the Synthesis, Structure, Properties and Applications (Springer-Verlag, 2008).
[4] J. Hone, M. Whitney, C. Piskoti, and A. Zettl, Thermal conductivity of single-walled carbon nanotubes, Physical Review B 59, R2514 (1999).
[5] S. Berber, Y.-K. Kwon, and D. Tomanek, Bonding and Energy Dissipation in a Nanohook Assembly , Physical Review Letters 84, 4613 (2000).
[6] S. Maruyama, A molecular dynamics simulation of heat conduction of a finite length single walled carbon nanotube, Microscale Thermophysical Engineering 7, 41 (2003).
[7] S. Maruyama, A molecular dynamics simulation of heat conduction in finite length SWNTs, Physica B 323, 193 (2002).
[8] C. Yu, L. Shi, Z. Yao, D. Li, and A. Majumdar, Thermal Conductance and Thermopower of an Individual Single-Wall Carbon Nanotube, Nano Letters 5, 1842 (2005).
[9] E. Pop, D. Mann, Q. Wang, K. Goodson, and H. Dai, Thermal Conductance of an Individual Single-Wall Carbon Nanotube above Room Temperature, Nano Letters 6, 96 (2006).
[10] S. Maruyama, Y. Igarashi, Y. Taniguchi, and J. Shiomi, Anisotropic heat transfer of single walled carbon nanotubes, Journal of Thermal Science and Technology 1, 138 (2006).
[11] J. Shiomi and S. Maruyama, Non-Fourier heat conduction in a single-walled carbon nanotube: Classical molecular dynamics simulations, Physical Review B 73, 205420 (2006).
[12] J. Lukes and H. Zhong, Thermal Conductivity of Individual Single-Wall Carbon Nanotubes, Journal of Heat Transfer 129, 705 (2007). [13] J. Shiomi and S. Maruyama, Molecular Dynamics of
Diffusive-Ballistic Heat Conduction in Single-Walled Carbon Nanotubes, Japanese Journal of Applied Physics 47, 2005 (2008).
[14] M. B. Bryning, D. E. Milkie, M. F. Islam, J. M. Kikkawa, and A. G. Yodh, Thermal conductivity and interfacial resistance in single-wall carbon nanotube epoxy composites, Applied Physics Letters 87, 161909 (2005).
[15] M. J. Biercuk, M. C. Llaguno, M. Radosavljevic, J. K. Hyun, A. T. Johnson, and J. E. Fischer, Carbon nanotube composites for thermal management, Applied Physics Letters 80, 2767 (2002).
[16] S. U. S. Choi, Z. G. Zhang, W. Yu, F. E. Lockwood, and E. A. Grulke, Anomalous thermal conductivity enhancement in nanotube suspensions, Applied Physics Letters 79, 2252 (2001).
[17] A. B. Dalton, S. Collins, E. Munoz, J. M. Razal, V. H. Ebron, J. P. Ferraris, J. N. Coleman, B. G. Kim, and R. H. Baughman, Super-tough carbon-nanotube fibres, Nature 423, 703 (2003).
[18] J. K. W. Sandler, J. E. Kirk, I. A. Kinloch, M. S. P. Shaffer, and A. H. Windle, Ultra-low electrical percolation threshold in carbon-nanotube-epoxy composites, Polymer 44, 5893 (2003).
[19] S. T. Huxtable, D. G. Cahill, S. Shenogin, L. Xue, R. Ozisik, P. Barone, M. Usrey, M. S. Strano, G. Siddons, M. Shim, P. Keblinski, Interfacial Heat Flow in Carbon Nanotube Suspensions, Nature Materials 2003, 2, 731.
[20] Z. C. Wu, D. A. Jelski, T. F. George: Vibrational motions of buckminsterfullerene, Chem. Phys. Lett. 137, 291 (1987)
[21] D. W. Brenner, Empirical potential for hydrocarbons for use in simulating the chemical vapor deposition of diamond films, Phys. Rev. B 42, 9458 (1990).
[22] J. Che, T. Cagin, and W. A. Goddard III, Studies of fullerenes and carbon nanotubes by an extended bond order potential, Nanotechnology 10, 263 (1999)
[23] H. D. Li, K. T. Yue, Z. L. Lian, Y. Zhan, L. X. Zhou, S. L. Zhang, Z. J. Shi, Z. N. Gu, B. B. Liu, R. S. Yang, H. B. Yang, G. T. Zou, Y. Zhang, S. Iijima: Temperature dependence of the Raman spectra of single-wall carbon nanotubes, Appl. Phys. Lett. 76 (2000) 2053. [24] N. R. Raravikar, P. Keblinski, A. M. Rao, M. S. Dresselhaus, L. S.
Schadler, P. M. Ajayan: Temperature dependence of radial breathing mode Raman frequency of single-walled carbon nanotubes, Phys. Rev. B 66 (2002) 235424
[25] M. N. Iliev, A. P. Litvinchuk, S. Arepalli, P. Nikolaev, C. D. Scott: Fine Structure of the Low-Frequency Raman Phonon Bands of Single-Wall Carbon Nanotubes, Chem. Phys. Lett. 316 (2000) 217. [26] Z. P. Zhou, L. Ci, L. Song, X. Q. Yan, D. F. Liu, H. J. Yuan, Y. Gao,
J. X. Wang, L. F. Liu, W. Y. Zhou, S. S. Xie, Y. X. Du,Y. J. Mo: The intrinsic temperature effect of Raman spectra of double-walled carbon nanotubes, Chem. Phys. Lett. 396 (2004) 372.
[27] T. Uchida, M. Tachibana, S. Kurita, K. Kojima: Temperature dependence of the Breit–Wigner–Fano Raman line in single-wall carbon nanotube bundles, Chem. Phys. Lett. 400 (2004) 341. [28] F. M. Huang, K. T. Yue, P. H. Tan, S. L. Zhang, Z. J. Shi, X. H.
Zhou, Z. N. Gu: Temperature dependence of the Raman spectra of carbon nanotubes, J. Appl. Phys. 84 (1998) 4022