International Journal of Emerging Technology and Advanced Engineering
Website: www.ijetae.com (ISSN 2250-2459,ISO 9001:2008 Certified Journal, Volume 5, Issue 9, September 2015)
172
Fundamentals of Synthetic Aperture Radar Systems
Mohamed Elhefnawy
1, Widad Ismail
21Dept of Electrical Engineering, Faculty of Engineering, October 6 University, Egypt 2
School of Electrical and Electronic Engineering, University of Science Malaysia, Malaysia
Abstract—The present research is an introductory paper on Synthetic Aperture Radar (SAR) systems. A review on topics and techniques related to the longrange and shortrange SAR systems are presented. The longrange SAR image is constructed using RangeDoppler Algorithm (RDA); while the RangeMigration Algorithm (RMA) is implemented with shortrange SAR for image formation. The simulation results indicate the resolution improvement when the RDA and RMA are utilized with longrange and shortrange SAR systems, respectively.
Keywords—azimuth resolution; imaging radar; rangeDoppler algorithm (RDA);range migration algorithm (RMA); range resolution; synthetic aperture radar (SAR).
I. INTRODUCTION
Until the 50s imaging radars were denoted as SideLooking Airborne Radar (SLAR) and did not use the principle of synthetic aperture which is based on the generation of an effective long antenna by signal processing means rather than by the actual use of a long physical antenna. The SLAR has moderate azimuth resolution which deteriorates as the range increases. In SAR, the resulting azimuth resolution becomes equal to half the azimuth antenna length and is independent of the range distance [1]. SAR systems have many advantages over the optical systems due to their all weather capability and the possibility to operate through smoke and at night. Further, SAR systems have the ability to penetrate long depth into vegetation and soil, and image the interior of the targets. With the SAR platform moving during the data collection, the range to a target changes so that the phase of the return echo is changed from position to another in the crossrange direction, where the spatial Doppler frequency is determined as the derivative of this phase history. Tracking this phase history over the length of synthetic aperture allows focusing the received echoes in crossrange [2]. The SAR platform transmits a plane wave which reaches a point target; the latter becomes a secondary source emitting upward wave back toward the SAR platform.
In longrange SAR applications, the RangeDoppler Algorithm is typically used under the assumption that the scattered waves by the targets are plane waves with linear phase front. In shortrange SAR applications, the waves back toward the SAR platform are spherical waves with a nonlinear phase front. The conventional imaging algorithms are typically used under the plane wave assumption; however, the Range Migration Algorithm (RMA) can handle the actual spherical wave, so that the RMA is suitable for smallscale applications as an imaging algorithm has the ability to focus the shortrange SAR data [36]. The hardware requirements and the imaging techniques are dependent on the distance between the SAR platform and targets; the novelty of this paper is to provide a new perspective in studying and developing SAR systems based on the classification into longrange and shortrange SAR systems. This paper is organized into seven further Sections. Sections II and III describe the range and azimuth resolution, respectively. Section IV presents the synthetic aperture radar. The longrange and shortrange SAR systems are provided in Sections V and VI. Section VII discusses the simulation results. Finally, on Section VIII conclusions are provided.
II. RANGE RESOLUTION
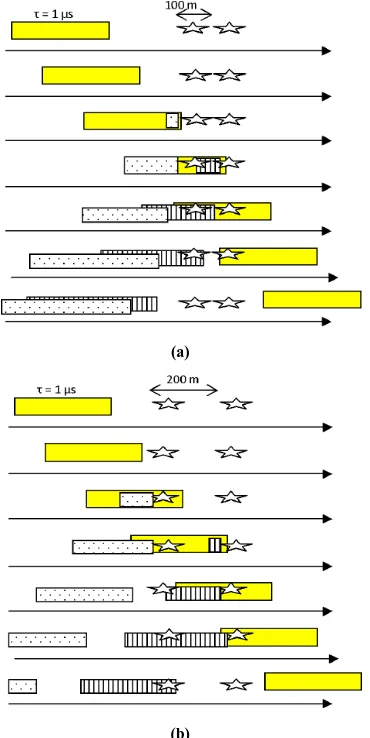
The range resolution is defined as the ability of the radar to distinguish between two targets at similar bearing from a reference point. Fig. 1 indicate the concept of range resolution; where the transmitted pulse which has a duration of τ = 1 µs will be reflected by the near target then by the far target; the reflections from the two targets will be interfered with each other if the distance between them less than the distance related to the transmitted pulse duration
International Journal of Emerging Technology and Advanced Engineering
Website: www.ijetae.com (ISSN 2250-2459,ISO 9001:2008 Certified Journal, Volume 5, Issue 9, September 2015)
173
(a)
[image:2.612.78.263.138.507.2](b)
Fig. 1. range resolution (a) irresolvable targets (b) resolvable targets.
So for better range resolution, the distance related to the pulse duration must be shorter or the pulse duration must be narrower. On the other hand, it is very hard to put enough energy into a very narrow pulse due to the fact that the energy of a signal is proportional to its duration. To improve the range resolution and maintain enough transmitted energy; the transmitted pulse is modulated using Linear Frequency Modulation (LFM). The frequency modulated pulse is called (chirp) and the range resolution
of this chirp equals (
) , where c is the speed of light
and BW is the bandwidth of the chirp.
The chirp with 5 µs width and 100 MHz bandwidth can be used to achieve a range resolution of 1.5 m, whereas a pulse with 10 ns width is required to get the same 1.5 m range resolution; so that the gain in the average power by
using the chirp signal equals 500 ( µ ) [1]. The use of chirped pulse with matched filter improve the range resolution by convolving the long chirped pulse with the reference impulse response of the matched filter, so that the output pulse will be compressed or significantly shorter as shown in Fig. 2.
Fig. 2. Pulse compression using convolution process in timedomain.
[image:2.612.329.563.267.401.2]The convolution process in timedomain can be replaced by multiplication process in frequencydomain, so the matched filter can be realized more simpler in frequencydomain as shown if Fig. 3.
Fig. 3 The realization of Matched filter in frequencydomain.
III. AZIMUTH RESOLUTION
[image:2.612.341.552.485.559.2]International Journal of Emerging Technology and Advanced Engineering
Website: www.ijetae.com (ISSN 2250-2459,ISO 9001:2008 Certified Journal, Volume 5, Issue 9, September 2015)
174
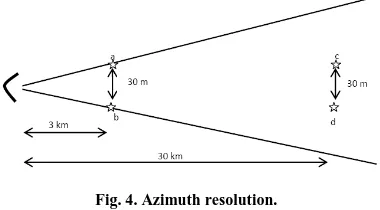
For a radar system which operates at 10 GHz and has an antenna size of 3 m, targets a and b are resolvable because the distance between them equals the azimuth resolutionfor targets a and b
[image:3.612.353.537.136.239.2]( ( ) ); where is the closest distance to the radar. Targets c and d tend to merge and appear as one target because the distance between them less than the azimuth resolution in this case which equals 300 m as shown in Fig. 4.
Fig. 4. Azimuth resolution.
The azimuth resolution depends on the distance of the targets from the radar and also on the antenna size; the azimuth resolution deteriorates as the distance is increased or the antenna size is decreased. The antenna size must be very large in order to resolve two targets located at long distance from the radar, for the above example the antenna size must be at least 30 m to distinguish between targets c and d; in some cases the practical implementation of the antenna size is not possible because the required antenna size to obtain an acceptable azimuth resolution must be several hundred of meters or even several kilometers.
IV. SYNTHETIC APERTURE RADAR (SAR)
[image:3.612.75.265.254.359.2]In 1951, Carl Wiley improved the azimuth resolution by generating long antenna size based on signal processing not by using an actual physical antenna size. The idea was to synthesizing an antenna array by using a real aperture antenna mounted on a moving platform as shown in Fig. 5. The formation of synthetic aperture improves the azimuth resolution to be half of the antenna size in the direction of platform movement, without dependence on the distance between the targets and radar [1].
Fig. 5. Formation of synthetic aperture.
SAR is sidelooking radar system to avoid left/right ambiguity as shown in Fig. 6. SAR utilizes the flight path of the platform to generate large antenna and create the image based on signal processing of the recorded radar echoes from the multiple antenna locations. At each position along the flight path, SAR transmits a pulse then collects and records the echo of this pulse by a receiver. The SAR works similar to a phased array antenna, but SAR uses only one antenna; while the phased array consists of large number of antenna elements.
Fig. 6. Remove left/right ambiguity using sidelooking system.
As shown in Fig. 5, the distance between target and SAR is changed due to the movement of the platform, so that the phase of the received signal is also varied from position to the other along the flight path. The variations in phase change the frequency of the backscattered waveform, and induce a natural frequency modulation in the crossrange direction. At each position, the virtual natural frequency modulated transmitted signal can be expressed as , where k is the Doppler rate which can be calculated as
[image:3.612.330.561.379.484.2]International Journal of Emerging Technology and Advanced Engineering
Website: www.ijetae.com (ISSN 2250-2459,ISO 9001:2008 Certified Journal, Volume 5, Issue 9, September 2015)
175
The azimuth reference signal is the complex conjugate time reversed version of the virtual natural frequency modulated transmitted signal, so that the azimuth reference signal depends on the closest distance between the target and the SAR [3].V. LONGRANGE SARSYSTEM
In longrange SAR system, a quick burst of LFM signal is transmitted, then waiting a short period of time to receive the reflections from targets. The elapsed time between pulse transmissions is known as pulse repetition interval (PRI). One antenna can be implemented with this LFMpulsed SAR system [7].
[image:4.612.326.560.119.324.2]The 2D raw data is formed after the inphasequadraturephase demodulation as shown in Fig. 7.
Fig. 7. Block diagram of longRange SAR system.
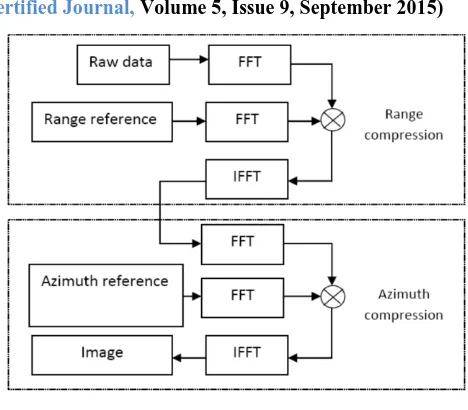
[image:4.612.51.289.330.439.2]The LongRange SAR image formation can be obtained by using the RangeDoppler algorithm which is divided into two main steps (range compression and azimuth compression) as shown in Fig. 8. The range compression is used to detect the presence of the range reference signal or the complex conjugate time reversed version of the transmitted chirp signal in the 2D raw data; the reference signal can be obtained as , where is the chirp rate and t is the fast time in the range direction. The range reference and the rows of 2D raw data are transformed into frequencydomain using fast Fourier transform (FFT) then multiplied. Finally inverse Fourier transform (IFFT) is performed. Also the azimuth compression is implemented to detect the presence of the azimuth reference signal or complex conjugate time reversed version of the virtual natural frequency modulated transmitted signal in the 2D raw data. The azimuth reference signal and the columns of the 2D raw data are converted into frequencydomain, and then they are multiplied. The output of the multiplier is transformed into timedomain by using an inverse fast Fourier transform (IFFT) [1].
Fig. 8. RangeDoppler algorithm.
VI. SHORTRANGE SARSYSTEM
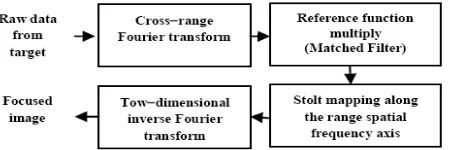
In shortrange SAR system, the LFM signal is continuously transmitted without waiting period also the transmitted signal and its received reflections are occurred simultaneously so that two antennas are required to be implemented with this LFMCW SAR, the PRI in LFMCW SAR is defined as the time interval for the frequency oscillation to ramp up and back down [8]. LFMCW SAR can be implemented with shortrange applications much easier because it requires lower sampling rate, and consumes less power than the LFMpulsed SAR. The 2D raw data is obtained as shown in Fig. 9, then the 2D raw data is processed using Range Migration Algorithm (RMA) to form the focused image as shown in Fig. 10 [1012].
[image:4.612.325.568.533.634.2]International Journal of Emerging Technology and Advanced Engineering
Website: www.ijetae.com (ISSN 2250-2459,ISO 9001:2008 Certified Journal, Volume 5, Issue 9, September 2015)
[image:5.612.59.284.135.210.2]176
Fig. 10. Block diagram of Range Migration Algorithm (RMA).
A. CrossRange Fourier Transform
The intermediate frequency signal which is varying with the range spatial frequency k and also with alongtrack position u can be written as . As shown in Fig. 11, for a target which is located at , and SAR platform positioned at ; the range between the target and the SAR platform is
[image:5.612.48.288.252.437.2]√
Fig. 11. Geometry of shortrange SAR.
can be Fourier transformed into the spatial frequency domain as follows:
∫ √ (1)
The principle of stationary phase is used to evaluate the above Fourier transform [12]. The two dimensional signal
can be obtained as
[√ ] (2)
B. Reference Function Multiply (Matched Filter)
A 2D matched filter is then applied to correct for the wavefront curvature, where the signal of matched filter can be written as follows
[√ ] [ ]
(3)
The reference position is , and . Then the matched filter is multiplied with the 2D SAR data
as follows
[√ ] [ ] (4)
C. Stolt Mapping along the Range Spatial Frequency Axis
The 2D SAR data after the matched filter
is transformed into ( ) by letting , and by applying the nonlinear transformation for
√ , where are the wavenumbers in and directions, respectively. ( ) can be obtained as
( ) [ ( )] [ ] (5)
The target function can be obtained by taking the 2D inverse spatial Fourier transform on ( ). However 2D inverse spatial Fourier transform on ( ) cannot work correctly because the data not uniformly spaced in the domain, the data ( ) should be interpolated on an equally spaced rectangular grid of and as shown in Fig. 12 [13]. So that 2D inverse spatial Fourier transform can be utilized. The phase of the signal ( ) can be converted into a linear phase by using Stolt interpolation [12]. The Stolt interpolation can be derived as follows
√ ( )
( ) (6)
Where and
; since , therefore
can be considered as a constant phase. By substituting Equation (6) in Equation (4), one obtains
( ) [ ] [ ] (7)
Fig. 12. Data distribution before ( ) and after ( ) interpolation [13].
D. TowDimensional Inverse Fourier Transform
( ) is the interpolated data on an equally spaced
International Journal of Emerging Technology and Advanced Engineering
Website: www.ijetae.com (ISSN 2250-2459,ISO 9001:2008 Certified Journal, Volume 5, Issue 9, September 2015)
177
∫ ∫ [ ( )] [ ] (8)The above equation results in
(9)
In Equation (9), is the 2D impulse function which perfectly pinpoints the location of the scatterer.
VII. SIMULATION RESULTS
A. Simulating LongRange SAR
[image:6.612.59.281.436.571.2]The MATLAB software has been used to simulate longrange SAR which operates at a centre frequency of 5.5 GHz, with bandwidth of 5 MHz. The SAR is satellite based. Its altitude is 565 km and moves with a velocity of 1000 m/sec. The SAR antenna has dimensions of 5.2 m (along the track) by 1.1 m in height, incident angle equals 40. The antenna footprint size has been calculated as shown in Fig. 13. With the rangeDoppler algorithm, the 2D imaging results of two point targets are shown in Fig. 14. The locations of the targets are assumed to be at (300* range resolution, 3000*cross range resolution), and (500* range resolution, 4000*cross range resolution) respectively, where range resolution and cross range resolutions are 46.67 m and 2.6 m, respectively.
Fig 13. Geometry of longrange SAR.
Fig. 14. Simulation of longrange SAR using RDA.
B. Simulating ShortRange SAR
The shortrange SAR system has been simulated to verify the performance of RMA algorithm. The parameters which have been used in the raw data generation are listed in Table I [911].
TABLE I
Parameters of LFMCW SAR system
Carrier Frequency 10.326 GHz
RF bandwidth 4.982 GHz
Reference position (512* range resolution,0)
Target1 position (215* range resolution, 151*cross range resolution) Target2 position (1251* range resolution, 523*cross
range resolution) SAR platform
velocity
0.85 m/s
Number of cells in range direction
1203
Number of cells in crossrange direction
1024
PRI 20 ms
Size of an antenna in crossrange
direction
0.0341 m
Chirp rate in range direction
4.982 1011
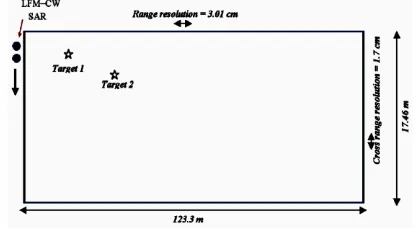
Consider a 17.46 m 123.3 m (crossrange range) target region composed of 4096 range cells and 1024 crossrange cells. Fig. 15 shows LFMCW SAR for radar image generation, where the range and crossrange resolutions are 3.01 cm and 1.7 cm, respectively.
[image:6.612.339.547.569.684.2]International Journal of Emerging Technology and Advanced Engineering
Website: www.ijetae.com (ISSN 2250-2459,ISO 9001:2008 Certified Journal, Volume 5, Issue 9, September 2015)
178
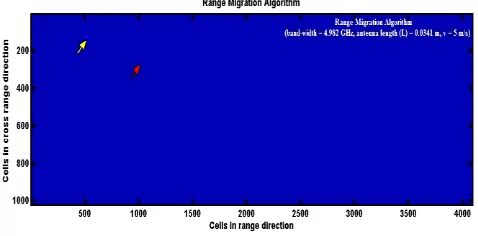
The 2D radar imaging is formed by digitizing the received signal from the targets at range sampling frequency equals at least twice times the beat frequency. The 2D LFMCW SAR imaging data are arranged in a matrix like array of complex numbers after in-phase– quadrature-phase (I–Q) demodulation [12]. [image:7.612.49.288.281.399.2]Each raw of data corresponds to data which can be reflected from 4096 targets or (4096 range cells); while each column contains data reflected from 1024 crossrange cells related to the same target. With the RMA algorithm, the 2D imaging results of two point targets are shown in Fig. 16.
Fig. 16. Simulation of shortrange SAR using RMA.
VIII. CONCLUSIONS
The basic concepts and imaging techniques on the synthetic Aperture Radar Systems have been provided in this paper. Longrange and shortrange SAR systems have been described. The effectiveness of RDA and RMA as a longrange and shortrange radar imaging algorithms, respectively, has been shown through the simulations using MATLAB.
Acknowledgment
The authors would like to thank the funding sources for this paper, which include October 6 University and Universiti Sains Malaysia grant secretariat for sponsoring the research under RUI grant (814241).
REFERENCES
[1] Moreira, A.; Prats-Iraola, P.; Younis, M.; Krieger, G.; Hajnsek, I.; Papathanassiou, K.P., "A tutorial on synthetic aperture radar," Geoscience and Remote Sensing Magazine, IEEE , vol.1, no.1, pp.6,43, March 2013
[2] Anghel, A.; Vasile, G.; Cacoveanu, R.; Ioana, C.; Ciochina, S., "Short-Range Wideband FMCW Radar for Millimetric Displacement Measurements," Geoscience and Remote Sensing, IEEE Transactions on , vol.52, no.9, pp.5633,5642, Sept. 2014 [3] Bamler, R., "A comparison of range-Doppler and wavenumber
domain SAR focusing algorithms," Geoscience and Remote Sensing, IEEE Transactions on , vol.30, no.4, pp.706,713, Jul 1992
[4] Cumming, I.G.; Neo, Y.L.; Wong, F.H., "Interpretations of the omega-K algorithm and comparisons with other algorithms," Geoscience and Remote Sensing Symposium, 2003. IGARSS '03. Proceedings. 2003 IEEE International , vol.3, no., pp.1455,1458, 21-25 July 2003
[5] Charvat, G.L.; Kempel, Leo C.; Rothwell, E.J.; Coleman, C.M.; Mokole, E., "A Through-Dielectric Radar Imaging System," Antennas and Propagation, IEEE Transactions on , vol.58, no.8, pp.2594,2603, Aug. 2010
[6] Shin, H.-S.; Lim, J.-T., "Range migration algorithm for airborne squint mode spotlight SAR imaging," Radar, Sonar & Navigation, IET , vol.1, no.1, pp.77,82, Feb. 2007
[7] Michael I. Duersch, ―BYU MICRO-SAR: A very small, low-power LFMCW synthetic aperture radar,‖ Master thesis, Brigham Young University, December 2004
[8] El-Darymli, K.; Moloney, C.; Gill, E.; Mcguire, P.; Power, D., "Design and implementation of a low-power synthetic aperture radar," Geoscience and Remote Sensing Symposium (IGARSS), 2014 IEEE International , vol., no., pp.1089,1092, 13-18 July 2014 [9] Charvat, G.L.; Fenn, A.J.; Perry, B.T., "The MIT IAP radar course:
Build a small radar system capable of sensing range, Doppler, and synthetic aperture (SAR) imaging," Radar Conference (RADAR), 2012 IEEE , vol., no., pp.0138,0144, 7-11 May 2012
[10] Gregory L. Charvat, ―Small and short-range radar systems,‖ Taylor & Francis Group, LLC, 2014, pp. 137-145
[11] Gregory Louis Charvat, ―A low-power radar imaging system,‖ PhD thesis, Michigan State University, 2007
[12] Bu-Chin Wang, ―Digital signal processing techniques and applications in radar image processing,‖ John Wiley & Sons, 2008, pp. 285-309
[13] Margaret Cheney ،Brett Borden,‖ Fundamentals of radar imaging,‖ Society for Industrial and Applied Mathematics (SIAM), 2009, pp. 63-66