Diversification of beaked Redfish,
Sebastes mentella
,
Along a Depth Gradient in the central North Atlantic
Peter Shum
This thesis is presented to the School of Environment & Life Sciences, University of
Salford, in fulfilment of the requirements for the degree of Ph.D.
Supervised by Prof. Stefano Mariani
iii
Table of Contents
Table of Contents ... iii
List of figures ... vi
List of tables ... viii
Acknowledgements ... ix
Abstract ... xii
Chapter I: Introduction 1.1 Introduction ... 1
1.2 Divergence along the population-species continuum... 2
1.3 Environmental gradients ... 4
1.4 Visual perception ... 7
1.5 Evolutionary origins ... 10
1.6 Sebastes mentella ... 11
1.7 Genetic structure by depth ... 12
1.8 Fisheries management ... 13
Chapter II: Three-Dimensional Post-Glacial Expansion and Diversification of an Exploited Oceanic Fish 2.1 Abstract ... 16
2.2 Introduction ... 17
2.3 Materials and methods ... 19
2.3.1 Sample collection ... 19
2.3.2 Generation of molecular data ... 22
2.3.3 Data analysis... 23
2.4 Results ... 26
2.4.1 Mitochondrial DNA lineages ... 26
2.4.2 Comparative nuclear and mitochondrial data ... 29
2.5 Discussion ... 34
2.5.1 Population structure and connectivity ... 35
2.5.2 Historical reconstruction ... 38
2.6 Conclusions ... 40
Chapter III: The Visual Pigment in Sebastes mentella and its Significance for Habitat Depth 3.1 Abstract ... 41
iv
3.3.1 Sample collection ... 43
3.3.2 Generation of rhodopsin sequences and analysis ... 44
3.3.3 Differential bleaching and analysis ... 45
3.4 Results ... 46
3.4.1 Rhodopsin ... 46
3.4.2 Visual spectra ... 47
3.5 Discussion ... 49
3.5.1 Convergent evolution to depth ... 49
3.5.2 Spectral sensitivity ... 50
3.6 Conclusions ... 53
Chapter IV: RNA-seq Reveals Adaptive Processes to Different Depth Environments in Beaked Redfish, Sebastes mentella 4.1 Abstract ... 54
4.2 Introduction ... 54
4.3 Materials & methods ... 56
4.3.1 Animals and sample collection ... 56
4.3.2 RNA isolation, library preparation, and sequencing ... 57
4.3.3 Transcriptome assembly and functional annotation ... 58
4.3.4 Analysis of gene expression ... 59
4.4 Results ... 60
4.4.1 Transcriptome assembly and annotation ... 60
4.4.2 Differential expression ... 63
4.4.3 Visual genes ... 63
4.5 Discussion ... 66
4.5.1 Rhodopsin sensitivity ... 66
4.5.2 Opsin expression ... 67
4.5.3 Other important findings: Immune response ... 69
4.6 Conclusions ... 70
Chapter V: MtDNA Approach Resolves Ambiguity of “Redfish” Sold in Europe 5.1 Abstract ... 72
5.2 Introduction ... 72
v
5.3.2 Molecular analysis ... 75
5.3.3 Data analysis... 75
5.4 Results ... 76
5.4.1 Marker diversity ... 76
5.4.2 Sequence identification ... 76
5.4.3 Phylogenetic analysis ... 79
5.5 Discussion ... 81
5.5.1 Complicating issues for DNA barcoding for recently radiating species ... 82
5.5.2 Phylogenetic representation ... 83
5.5.3 Resolution of species-population identity ... 85
5.6 Conclusions ... 87
Chapter VI - General Discussion 6.1 Main findings ... 88
6.2 Divergence along an environmental depth gradient ... 94
6.3 Implications for fisheries and biodiversity ... 95
6.4 Future directions ... 97
6.5 Final conclusions ... 98
Supplementary Information ... 100
vi
List of figures
Figure 1.1 shows the depth that light will penetrate in clear ocean water.. ... 6
Figure 1.2 Structural differences between rods and cones.. ... 7
Figure 1.3 Model for the activation of arrestin (Arr).. ... 8
Figure 1.4 Distribution of admixture proportions of S. mentella in the North Atlantic.. ... 12
Figure 1.5 Landings from the Irminger Sea of (a) shallow pelagic redfish since 1982 and (b) deep pelagic redfish since 1991 (from Marine Research Institute, 2014). ... 14
Figure 2.1 MultiSampler attached to the trawl and consists of a steel frame with three codends.. . 20
Figure 2.2 Sample collection locations and distribution of mtDNA haploytpes.. ... 20
Figure 2.3 Haplotype genealogy of North Atlantic Sebastes mitochondrial control region sequences.. ... 27
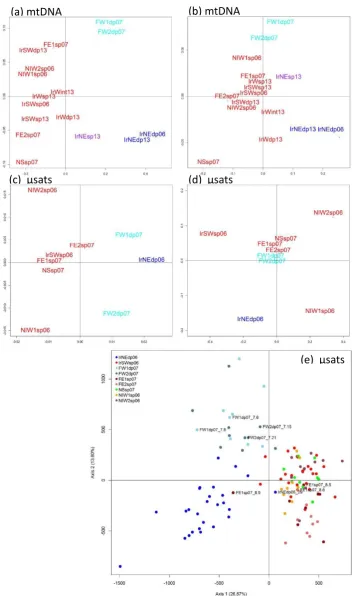
Figure 2.4 Multidimensional Scaling Plot (MDS) of Sebastes mtDNA variation from 16 collections ... 31
Figure 2.5 Spatial analysis of molecular variance. ... 32
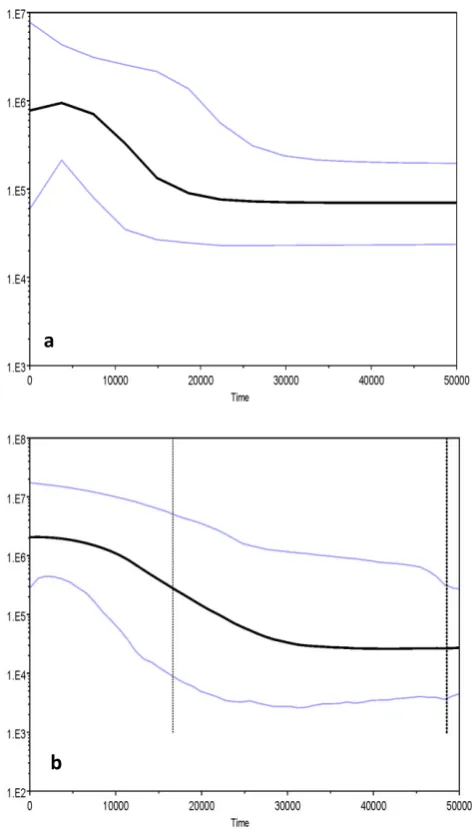
Figure 2.6 Bayesian Skyline Plots (BSPs) showing the temporal changes in mtDNA diversity. ... 33
Figure 2.7 Alternative scenarios tested using Approximate Bayesian Computation approach (DIYABC) based on combined microsatellite and mtDNA data for S. mentella.. ... 35
Figure 3.1 Illustrating the light-tight curtain covering the central codend of the multiSampler unit ... 44
Figure 3.2 Haplotype genealogy of rhodopsin sequences.. ... 46
Figure 3.3 Absorbance spectra of retinal pigment extracts from S. mentella following various bleaches of successively shorter wavelength.. ... 48
Figure 3.4 Two-dimensional representation of the structure of rhodopsin.. ... 50
Figure 4.1 Total RNA integrity of S. mentella retinal tissue on ethidium bromide-stained 1% agarose gel.. ... 58
Figure 4.2 Distribution of transcript contig length in RNA-seq data of S. mentella. ... 60
Figure 4.3 (a) Pie chart with percentages of the higher-level GO terms for S. mentella, (b) Bar chart of genes annotated with select “Cellular Component”, “Molecular Function” and “Biological Process” GO terms. ... 62
Figure 4.4 Smear plot of expression of logarithmic fold change values (shallow vs. deep) against mean normalized read counts (Anders & Huber 2010).. ... 63
Figure 4.5 Expression fold changes of selected retinal transcripts. ... 65
Figure 5.1 Neighbor-Joining tree of mtDNA COI sequences. ... 80
Figure 5.2 Neighbor-Joining tree of mtDNA control region sequences.. ... 81
Figure 5.3 Proposed North Atlantic Sebastes phylogenies of Hyde & Vetter (2007) compared to the present study. ... 86
Figure 5.4 Haplotype genealogy of North Atlantic Sebastes from Shum et al. (2015). ... 87
Figure 6.1 illustrating a plausible scenario of the historical movement and evolutionary trajectory of Sebastes mentella during the Pleistocene glaciations. ... 90
Figure S7.1 Haplotype genealogies indicating shallow- (red) and deep-pelagic (blue)..…….. ...102
Figure S7.2 Mismatch distributions for oceanic S. mentella clade A (above) and clade B (below)... 103
vii
viii
List of tables
Table 2.1 Location, Group code, and year of capture, trawl depth range, position, and number of individuals (N), nucleotide (π) and haplotype (h) diversities of S. mentella investigated for 2013 and 2006/7 data from the North Atlantic. ... 21
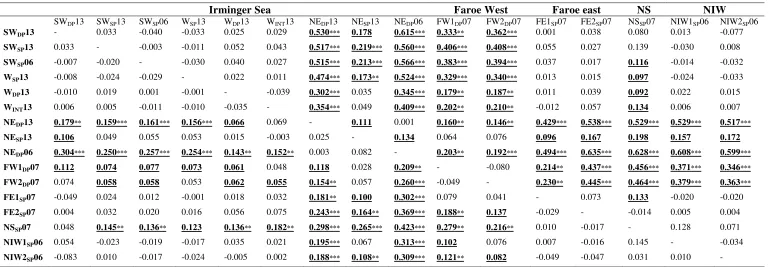
Table 2.2 MtDNA estimates of pairwise genetic differentiation among 16 S. mentella collections.
... 30
Table 2.3 Analysis of molecular variance for SAMOVA groupings for S. mentella from 16
localities in the North Atlantic. ... 32
Table 3.1 Location, Group code, and year of capture, trawl depth range, position, and number of
individuals (N), Length: mean length in cm and length range for each collection of S. mentella investigated for 2013 and 2006/7 data from the North Atlantic. MS: multi-sampler. ... 46
Table 3.2 Illustrating number of retinae examined. Sample codes refer to location and depth of
each population (refer to Table 3.1 for location codes). ... 47
Table 4.1 Location, year of capture, trawl depth range, position, and number of individuals (N), for
each collection of S. mentella for 2013 from the North Atlantic. MS: multi-sampler. ... 57
Table 4.2 Repertoire of genes associated with vision and immunity. Average fold change relative
to housekeeping gene Elongation factor 1 (alpha EF1-α). ... 64
Table 5.1 Market samples analysed for species identification with label information and results
from BOLD and Genbank databases using the mtDNA COI and control region respectively. Species i.d. is inferred from phylogenetic reconstruction based on d-loop sequences (see Figure 5.2). ... 77
Table 5.2 Blind samples analysed for species identification with label information and results from
BOLD and Genbank databases using the mtDNA COI and control region respectively.. ... 78
Table S7.1 Microsatellite estimates of pairwise genetic differentiation among nine S. mentella
collections. Pairwise FST below diagonal and RST above, based on 10,000 permutations.
Significance tested after the False Discovery Rate (FDR) correction. ... 100 Table S7.2 Genetic marker discordance among S. mentella samples for mitochondrial control
region (mtDNA clades), rhodopsin SNPs and microsatellite genotype. ‘AG’ indicates presence of a heterozygote. Samples in bold highlight mismatch between mtDNA and rhodopsin. ... 100 Table S7.3 Pairwise FST genetic differentiation among nine S. mentella collections. mtDNA
ix
x
Acknowledgements
I would like to express my sincere gratitude to Stefano Mariani, who has shown
continued support throughout my research and scholarship. I appreciate his patience, encouragement and his genuine interest to catapult my career prospects. He has provided me with the freedom and opportunity to pursue my interests throughout this project while bolstering my experience in areas of bioinformatics, population genetics, marine biology and also my experience at sea. I value his comments and advice that has allowed me to mature as a researcher (and the odd game of tennis at Mersey Bowmen). It has truly been an honour to work with him and I look forward to future collaborations.
I would like to thank collaborators Christophe Pampoulie and Ronald Douglas for
offering continued support, expertise and enthusiasm throughout the entire project. Chris played a vital role in organising the sampling campaign and making sure everything went smoothly. He was my first point of contact at the Marine Research Institute in Iceland and he provided any and all support when I needed it. Ron was an inspiration during this project and helped me throughout the visual studies on the retina. I learned a lot from him, especially how to “survive” at sea.
I am grateful to Valérie Chosson, Carlotta Sacchi, Cath Hyde and Sarah Collins for
technical assistance during periods of field work at sea and lab work that made my life a lot easier. I would like to thank Kiley Best for collecting and providing tissue samples of S. fasciatus during offshore surveys in Canadian waters.
I owe thanks to Andrew Mark Griffiths, Chrysoula Gubili, Marco Ciampoli, Sara
Vandamme, Judith Bakker, Cristina Di Muri, Stella Minoudi, Ryan Joynson, Alice Cunnington and Lauren Moore who gave me motivation during the project and helped me at various times either in the lab or crucial conversations that made my time at Salford an absolute joy.
xi
Gareth Weedall, Steve Paterson, Rachel Brenchley and the Centre for Genomic Research - University of Liverpool for technical assistance and useful advice during
bioinformatics analysis. Richard Birtles, Chiara Benvenuto, Robert Jehle, and Jean
Boubli for their advice and useful comments during my progression and development as a researcher.
I thank John Hyde and Trevor Kenchington for useful advice and insightful discussion on Sebastes during various stages of this project.
I am grateful to the crew and on board survey scientists for their gracious help during my
sampling period on the Icelandic Research Vessel Árni Friðriksson – notably Kristján
Kristinsson. The Marine Research Institute in Iceland for providing funding and facilitating transport of precious samples and the University of Salford for supporting me through the Graduate Teaching Scholarship (GTS) scheme.
Special thanks to Valérie Chosson from Marine Research Institute who assisted in
preparing for the sampling campaign and sent me various tissues and data throughout the entire project. Her help has made this project achievable.
xii
Abstract
Despite the striking physical and environmental gradients associated with depth variation in the oceans, relatively little is known about their impact on population diversification,
adaptation and speciation. The pelagic beaked redfish, Sebastes mentella, exhibits
depth-associated patterns of population genetic substructure in the central North Atlantic, with a widely distributed population inhabiting waters between 200 and 550m depth and localised putative populations dwelling at greater depths, between 550 and 900m. This PhD project implements a multidisciplinary approach to explore and understand aspects of this biological complexity, in the context of depth.
To investigate depth as a factor driving population divergence and adaptation,
sampling was carried out to target S. mentella at different depth layers and across most of
its distribution range. Through the use of mitochondrial and nuclear markers on samples spanning a period between 2006 and 2013, the existence of two strongly divergent evolutionary lineages is revealed, with significantly different geographic distribution patterns and dwelling at different depths. The first empirical evidence to explicitly test
genotype and phenotype of Sebastes vision associated with shifts in habitat depth is
presented, by conducting spectral analysis of rod visual pigments. Additionally, de novo
RNA-seq analysis of redfish retina transcriptome is presented for a subset of “shallow” and
“deep” individuals, in order to characterise differential expression of candidate genes involved in visual perception in organisms adapted to different depths. Furthermore, a market accuracy survey of redfish sampled across Europe from various retailers was cross-referenced against data currently held in public databases. Results revealed the existence of inaccurate reference sequences in data bases, likely stemming from species misidentification from previous studies, which currently hinders the efficacy of DNA
methods for the identification of Sebastes products. Overall, we cast new light on the role
1
1
Chapter I
Introduction
1.1 Introduction
There is increasing awareness of the vulnerability of fishery resources with over 60% of global marine populations now known to be overexploited or at their maximum sustainable limit (FAO Fisheries and Aquaculture Department, 2014). Therefore governments and intergovernmental organisations are devising management strategies aimed to improve the sustainability of fishery resources (Daw & Gray, 2005).
The scope of these measures is based on the best scientific information available on the nature of the resource. Within this framework, the discipline of fisheries biology has traditionally focused on identifying self-sustaining components by developing an understanding of the environmental and biological parameters that influence population dynamics and structure. This allows current or future population sizes to be determined and ultimately contribute to setting catch quotas (Beverton & Holt, 2012). However, failure to recognise the existence of population structure can lead to overexploitation, and consequently, have cascading impacts on the assessment and management of commercially valuable fish populations (Cadrin, Karr & Mariani, 2014).
2
Research on some emblematic species, such as Atlantic cod (Gadus morhua) and herring
(Clupea harengus) have played a pivotal role in the developing concepts and applications
in marine stock structure analysis (McQuinn, 1997; Ruzzante et al., 2006; Nielsen et al.,
2012; Hutchinson et al., 2015) yet, as thousands of species continue to be harvested
globally, rapid and efficient population assessment are increasingly required for many
other ‘less traditional’ fishery targets. In 1982, a pelagic fishery opened in the Irminger Sea, to target the North Atlantic beaked redfish, S. mentella Travin 1951, above 500m depth (commonly referred as shallow-pelagic). In the early 1990s, the pelagic fishery expanded geographically in the open Irminger Sea and moved to deeper layers, collecting fish beyond 500m (commonly referred to as deep-pelagic). This began to spark heated
debates about the stock structure of S. mentella, which have ensued ever since (Cadrin et
al., 2010; Makhrov et al., 2011; Cadrin et al., 2011). Initially, biologists considered that the shallow-pelagic stock could be discriminated from the deep-pelagic stock based on darker, patchy skin colour, heavier parasite infestation, and associated muscle spots, as well as a smaller size-at-maturity (Magnússon & Magnússon, 1995). However, the relationship between these stocks has been subject of strong divergence of views, especially as to whether these stocks comprise of more than one population (Saborido-Rey et al., 2004). Consequently an increase of studies followed with the aim of clarifying the depth-segregated population structure of S. mentella (Cadrin et al., 2010 and references therein), yet doubt remains as to the historical processes and selective forces that might have contributed to population divergence along a depth gradient in S. mentella in the North Atlantic (Planque et al., 2013).
The overarching theme of this research is to investigate the role of depth in shaping genetic and phenotypic patterns of variation in the beaked redfish, Sebastes mentella, in
the North Atlantic. S. mentella is a unique system to study factors driving depth-assisted
population divergence in the marine environment, yet relatively little attention has focused on mechanisms of divergence. To that end, this thesis explores the dimension of depth in facilitating population divergence.
1.2 Divergence along the population-species continuum
Population genetics has been intrumental in clarifying how genetic variation across a spatial continuum is distributed among different groups of individuals or “populations”
3
The concept of “populations” is a core theme to the fields of ecology, evolutionary biology, and conservation biology and the criteria used to define populations fall under both evolutionary and ecological paradigms (Waples & Gaggiotti, 2006). However, fisheries science requires a higher level of ecological organisation relevent to an
operational definition of a unit “stock”. A stock is generally defined as groups that exhibit
unique demographic dynamics to external forcing and cannot be considered exclusively as biological populations (Secor, 2013). This is because fishing and other external influences occur at different scales, such that some groups are affected more than others within a population, and the internal dynamics within a population and other groups are not necessarily homogeneous and are not exclusively internal (Secor, 2013). In practice however, it is often difficult to reach an agreement on what constitutes a stock (Gauldie, 1991) due to complex connectivity of marine populations, the wide variety of approaches, rapidly advancing methodologies, challenges in sampling and conflicting terminologies and interpretations (Cadrin, Karr & Mariani, 2014). Thus confronted with a common body of information, different researchers might come to different conclusions about the number of populations/stocks and their interrelationships.
Studies using molecular information continuously play a significant role in the assessment of exploited marine species and increasingly contribute to the development of management strategies (Hauser & Carvalho, 2008). Fisheries genetics has stimulated
research to investigate the factors underpinning the dynamics and resilience of exploited
species and in order to delimit the boundaries of putative fishery stocks which are the key units in the management of sustainable fisheries. DNA sequence variation is subjected to stochastic processes, such as genetic drift. For example, the DNA sequence of a specific gene (or allele) in an individual may not necessarily be the same in another individual, despite this having no effect on survival or fitness. Thus examining the homologous gene regions in different individuals can provide a measure of the frequency of allelic combinations and genetic variation both within and among individuals, populations and species. Alternatively, DNA sequence variation under the constraints of natural selection
will possess some adaptive value and thereby influence an individual’s fitness. These
4
underpinning evolutionary important traits of different lineages (Hauser & Carvalho, 2008; Mariani & Bekkevold, 2013). One of the primary lines of interest to study adaptive variation is the ability to assess variation that underlies ecologically relevant traits (Merilä & Crnokrak, 2001), whereby neutral variation would otherwise fail to detect. This approach is particularly valuable in demographically open populations of all populations sizes, allowing the potential to detect disruptive selection, which in the long run
determines adaptive divergence even in the face of gene flow (Nielsen et al., 2009;
Mariani & Bekkevold, 2013).
Contemporary population structure is a function of historical and current demographic processes, aided by ongoing selection pressures (Hauser & Carvalho, 2008; Nosil et al., 2009a). However, different evolutionary forces can produce similar genetic patterns, making it difficult to infer which processes are responsible for the observed
population structure in the absence of demographic or historical information (Strand et al.,
2012). Therefore it is important to gain an exhaustive picture of historical processes whereby allopatric divergence is initiated by past events, for example the Pleistocene glaciations. This period was characterized by glacial advances, colder temperatures and
lower sea levels than contemporary conditions (Clark et al., 2009). Consequently,
populations persisting in separate glacial refugia may have diverged into genetically distinct lineages as a result of geographical isolation. Depending on the degree of reproductive isolation that evolves in allopatry, gene flow will ultimately erode divergence (Nosil et al., 2009a). However, selective forces may continue to promote differentiation whereby loci under selection act on adjacent genomic regions and physically link to them
(Nielsen et al., 2006). Furthermore, divergent selection can promote reproductive isolation
that causes barriers to overcome the homogenizing effects of gene flow (i.e. ecological
speciation; Nosil et al., 2009a). Hence, understanding genetic diversity of marine
populations is of prime importance to help manage species persistence and its associated adaptive and evolutionary potential of populations in establising effective management strategies.
1.3 Environmental gradients
5
the absence to obvious geographical barriers. Marine species are characterised by limited geographic barriers, often high dispersal potential, and often large effective population size (Palumbi, 1994). These attributes were originally thought limit population divergence but recent empirical work has found that gene flow is much more constrained than previously
thought (Sala-Bozano et al., 2009; Pampoulieet al., 2015). A number of mechanisms have
been identified that provide a platform to successfully study the interplay between gene-flow and natural selection on population structure based on geographical distance
(Palumbi, 1994; Weersing & Toonen 2009), oceanographic features (Galindo et al., 2010;
Gaither et al., 2010; Selkoe & Toonen, 2011) and life-histories (Hare et al., 2005; Riginos et al, 2014). Yet, there is still a largely overlooked dimension along for which the gene flow/selection balance is likely to promote divergence in aquatic organisms. This dimension is depth.
There is accumulating evidence documenting patterns of genetic differentiation among populations separated by depth that frequently play a role in the adaptive diversification of marine fish (Karlsson & Mork, 2003; Pampoulie et al., 2006; Hyde et al., 2008). There are several reasons why variation in depth might influence population divergence. Many environmental factors - including temperature, salinity, hydrostatic pressure, scarce food resources and reduced light levels - co-vary dramatically with increasing depth (Somero, 1992; Michiels et al., 2008; Bergstad, 2013; Yancey et al., 2014), and the multidimensional nature of depth potentially pose strong divergent selection acting on depth-segregated populations over both ecological and evolutionary timescales. The multiple expanses across which individuals can disperse and populations can spread may either increase the strength of divergent selection on a particular feature of a
phenotype, or it could generate ‘multifarious’ divergent selection acting on multiple
genetically independent dimensions of a phenotype (Nosil et al., 2009b). Depth as a
dimension for population divergence may also depend upon ontogenetic migration, spawning habitat depth, competition for resources at different trophic levels or historical
events (Hyde et al., 2008; Vonlanthen et al., 2009; Stefánsson et al., 2009a). Thus spatial
isolation by depth may result directly in reduced gene flow and the evolution of reproductive isolation between populations.
The availability of light plays a fundamental role in the behaviour and adaptation of the sensory systems of marine animals (Douglas & Partridge, 1997; Seehausen et al.,
2008). Figure 1.1 illustrates how white light is composed of an electromagnetic spectrum of
6
Svoronos, 2005). In ocean water, factors such as turbidity, salinity, phytoplankton load and productivity modify ambient light spectra with depth (Thurman & Trujillo 2008). Light is reflected or refracted and is scattered or absorbed by solid particles within the water column. The visible spectrum ranges from 400-700nm at the surface and only a small
fraction of visible light (1%, Michiels et al., 2008) penetrates depths below 150m
(Michiels et al., 2008) of which most of the long wavelengths (red light; 600–700 nm) are
absorbed within the first 10-15m of the water column, with ultraviolet and violet
wavelengths attenuated less rapidly (Michiels et al., 2008). Only short wavelengths in the
blue-green spectra (400-500 nm) can be observed as deep as 1,000m (Michiels et al., 2008;
Warrant & Locket 2004). In the clearest ocean water, blue light (which is absorbed least) is reduced by a factor of 10 every 70m depth and all downwelling sunlight is effectively extinguished at 1,000m (Land & Nilsson, 2012). As a consequence, these processes provide a strong cline in light intensity within marine environments.
Figure 1.1 shows the depth that light will penetrate in clear ocean water.
[image:18.595.140.468.359.636.2]7 1.4 Visual perception
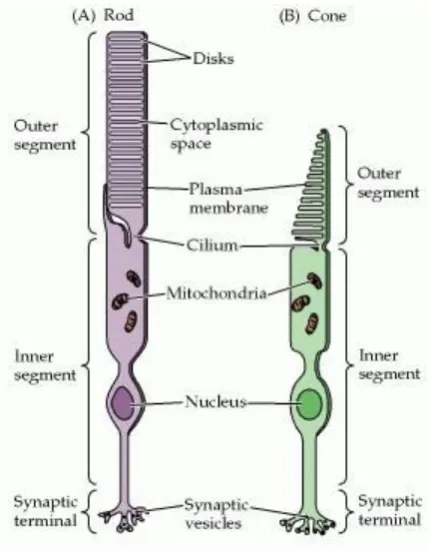
There are two types of photoreceptors, rods and cones, which are distinguished by shape, the type of photopigment they contain, distribution across the retina, and the pattern of synaptic connection (Figure 1.1, Figure 1.2; Purves et al., 2012). Rods and cones share the same principles of phototransduction, the cellular mechanism of light detection, and often employ homologous or sometimes even identical proteins in their phototransduction cascades. Despite their similarities, rods are highly sensitive and can detect a single photon
of light (Baylor et al., 1979), which makes them suited for dim light vision. On the other
hand, cones are up to 100-fold less sensitive than rods (Land & Nilsson, 2012; Kefalov, 2012). Cones are capable of colour vision and have lower absolute sensitivity with high spatial acuity. There are three types of cones commonly referred to as blue or short-wavelength, green or middle-wavelength and red or long wavelength (Land & Nilsson, 2012.
Figure 1.2 Structural differences between rods and cones. Although generally similar in structure, rods (A) and cones (B) differ in their size and shape, as well as in the arrangement of the membranous disks in their outer segments (From Purves et al., 2012).
[image:19.595.201.416.369.645.2]8
in specialized ciliary structures of the vertebrate rod and cone photoreceptors, called outer segments (Figure 1.2). Visual pigments are G protein-coupled receptors that consist of a
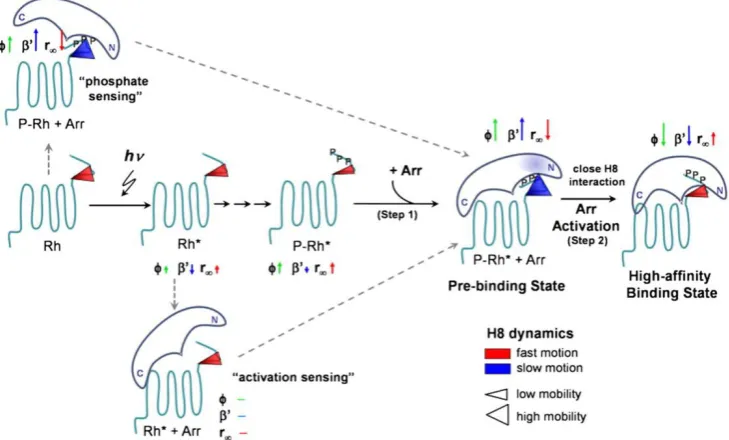
protein, opsin, covalently attached to a vitamin A-derived chromophore, 11-cis-retinal (Hargrave, 2001). Upon the absorption of a photon, the chromophore is isomerized from 11-cis-retinal, to its physiologically active metarhodopsin II (meta-II) state which binds and activates transducin, the visual G-protein (Smith, 2010). In contrast to a visual excitation, the inactivation of a photoresponse to a dark-adapted state involves a two-step process: first, G protein-coupled kinases (GRKs), involved in phosphorylation, bind to active meta-II at multiple sites thereby desensitising receptor/G protein activity; in the second step, inactivation occurs when arrestin binds phosphorylated meta-II and eventually
terminates the remaining activity of the opsin (see Figure 1.3; Burns & Baylor, 2001; Ebrey
& Koutalos, 2001; Arshavsky et al., 2002).
Figure 1.3 Model for the activation of arrestin (Arr). After phosphorylation of Rh* (e.g. meta-II) by
rhodopsin kinase (not shown), the prebinding and high-affinity binding state are successively formed. The
conformational changes around α-helix I in the prebinding state of arrestin are indicated by a transparent blue colouring. Helical 8 (C-terminal) dynamics is visualized by the size and colour of the cone representing Helical 8 conformational space (mobility) and motion (ϕ < 2.5 ns: red, ϕ > 2.5 ns: blue), respectively. The dynamics changes compared to the preceding state are indicated by the corresponding anisotropy parameters
φ (correlation time), ′ (conformational space/relative mobility), and r∞ (steric restriction) presented as
arrows. The arrow length represents the magnitude of the change and the direction indicates the increase or decrease of the respective value (from Kirchberg et al., 2011).
[image:20.595.123.488.344.564.2]9
max (Yokoyama, 2000). In animals, visual-system rhodopsins are light-sensitive G-protein-coupled receptors (GPCRs) comprised of an aromatic cluster of amino acids located in the disc membranes of the rod outer segments and are the pigment involved in
dim light vision (Smith, 2010; Yokoyama et al., 2008). Changes in amino acids within the
transmembrane domains have been documented to alter the spectral absorbance of
rhodopsin in vertebrates (Yokoyama et al., 2008). This raises the hypothesis that
shallow-water species may show red-shift in wavelength of maximal absorbance, max, while
species that occupy progressively deeper waters are expected to show amino acid
substitutions that cause blue shifts in max (Bowmaker et al, 1994). Previous studies have
demonstrated cases that predict amino acid positions in the rhodopsin gene that may result
in a functional role in different light environments for divergent groups of fishes (Spady et
al., 2005; Yokoyama et al., 2008).
Changes in gene expression have shown to play an important role in visual
sensitivity that drives adaptation in photic environments (Hofmann et al., 2010). Gene
expression is shaped by both genetic and environmental mechanisms and thus can be
considered a “molecular phenotype” (Ranz & Machado, 2006). The transcription rate of a
gene can vary considerably among genotypes and/or among environmental conditions
(Whitehead & Crawford, 2006; Roelofs et al., 2009). Consequently, gene expression might
provide novel insights into population divergence because expression profiles allow the ability to uncover phenotypes, which are not immediately visible through traditional
approaches such as behaviour and morphologically cryptic features (Pavey et al., 2010).
Thus, identifying ecologically relevant expressed genes will likely enhance the efficiency of genomic approaches to address questions about ecological divergence, and ultimately speciation.
10 1.5 Evolutionary origins
The rockfishes of the genus Sebastes are the most species rich taxa among the Order
Scorpaeniformes, comprising of approximately 110 species that occur in cold temperate waters throughout the North Pacific (NP, Love et al., 2002; Kai et al., 2003), North
Atlantic (Nedreaas et al., 1994; Roques et al., 2002), and the Southern Hemisphere
(Rocha-Olivares et al., 1999; Venerus et al., 2013). They are long-lived, viviparous fish
adapted to a variety of environments, and differ in colour, ecology and behaviour (Love et
al., 2002). The diversity of this group represents an explosive speciation event (Johns &
Avise, 1998), which has been compared to the rapid radiation of cichlids in the Great East African lakes (Greenwood, 1991), resembling a species flock (Johns & Avise, 1998). Novel adaptive traits have allowed the diversifying taxa to exploit and colonise a range of ecological environments with overlapping spatial distributions (Kai et al. 2002; Hyde & Vetter, 2007; Sivasundar & Palumbi 2010).
The development of paleo-oceanic features conducive to the evolution and spread of Sebastes species in the Pacific began during the middle Miocene (~15-17 MYA) shoaling of the Indonesian Seaway (Tsuchi, 1997). This likely led to the subsequent species expansion and growth to suitable habitats and resources, while disruption of previously favourable conditions would have led to population fragmentation and extinctions (Hyde & Vetter, 2007). Developments of productive ecosystems likely
prompted a process of local adaptation through niche partitioning. Thus Sebastes spp.
colonized much of the NP as a result of a complex oceanographic temperature regime
shift, which has created thermal barriers for many rockfish species (Love et al., 2002). As
further climatic changes and expansion to new environments followed, Sebastes
successfully colonised the North Atlantic probably as a result of the trans-arctic dispersal events approximately 3.5-4 MYA, as documented for other taxonomic groups (Dunton,
1992). It has been hypothesised that the ancestor of the S. alutus clade crossed the Bering
land bridge into the NA as warming arctic waters allowed for the expansion and diversification into the North Atlantic (Love et al., 2002).
Currently, there are four species of Sebastes in the North Atlantic, Sebastesviviparus
Krøyer 1845 (Norwegian redfish), Sebastes fasciatus Storer 1854 (Arcadian redfish),
11
found at much shallower depths compared to other NA redfish, between 10-120m, and has a distribution to the north-east Atlantic, from the Barents Sea to the west of Iceland, with rare occurrences off the coast of Greenland. S. fasciatus is restricted to the north-west Atlantic in the Gulf of Maine and along North America to the Scotian shelf and the Grand
Banks from depths of 150-300m. S. norvegicus is most commonly found at depths less
than 300-370m from the southern region of the Barents Sea, off the coast of Norway,
Iceland and Greenland. S. mentella remains the most abundant redfish species stretching
throughout the NA, from the Barents Sea, along the Norwegian coasts, around the Faroe Islands, Iceland, Greenland, the Irminger Sea and along the coasts of North America and
Atlantic waters outside Canada. S. mentella inhabit a wide range of depths from 200m to
1,000m.
1.6 Sebastes mentella
Given the wide distribution of the pelagic beaked redfish, the spatial structure of this oceanic species has been heavily debated for decades. It was historically regarded as a single panmictic population until a pelagic fishery developed in the Irminger Sea,
south-west of Iceland (Magnússon & Magnússon, 1995; Saborido-Rey et al., 2004). The fishery
explored oceanic depth layers down to 500m before expanding geographically and to deeper depths beyond 500m. Icelandic researchers observed that fish caught at shallower layers (shallow-pelagic, <500m) could be discriminated from the deep-pelagic group based
on darker patchy skin colour, heavy infestation by the parasitic copepod Sphyrion lumpi,
differences in length-weight relationships and size-at-maturity (Magnússon & Magnússon,
1995). Researchers set out to further investigate the level of sub-structure of S. mentella
and to determine if distinct stock units exist in the pelagic Irminger Sea, and there have been several hypothesis put forward to explain the life history of this exploited species. One hypothesis put forward agues for a “single stock hypothesis” which suggests that mature individuals of S. mentella comprise of a single panmictic unit that segregates by depth according to age/size across the Faroese Seas to east of Greenland. Contrary to this,
some argue that there is at least two populations (“two stock hypothesis”) that suggest that
S. mentella found on the shelves demersal) and that living in deeper pelagic (deep-pelagic, >500m) waters in the Irminger Sea constitute one stock, which is separated from
12
Therefore, a stream of research set out to explore the depth-associated sub-structure of this oceanic species (Cadrin et al., 2010).
1.7 Genetic structure by depth
Several studies have used molecular markers for species identification and to investigate
the relationships among S. mentella found in different areas. Genetic studies based on
allozymes, mtDNA and nuclear DNA have shown significant variation between shallow-
and deep-pelagic groups (Cadrin et al., 2010). Pampoulie and Daníelsdóttir (2008) used
nine microsatellite loci on S. mentella and found significant allele frequency variation between shallow and deep-pelagic types as well as a significant degree of hybridization. This finding fuelled research effort to understand this complex group. Stefánsson et al., (2009b) carried out in-depth analysis of over 1200 genetic samples of S. mentella from specific locations and depths and genotyped them at 12 microsatellite loci. They revealed the presence of three distinct gene pools that show a clear segregation with depth from fish caught in the shallow zone (cluster S, <500 m), western Icelandic shelf (Cluster I, 550 m), deep sea zone (Cluster D, >500 m) (Figure 1.4). Stefánsson et al. (2009b) first raised the possibility of an on-going speciation event in this taxon in the Irminger Sea. They found an historical signature from microsatellite data and suggest a probable split before the last glacial maximum (~27 kyr BP), segregated in allopatry into two geographically isolated environments. Postglacial re-colonisation of the Irminger Sea (7-8 kyr BP) could have established the overlapping distribution where both groups diverged in their adaptations to local depth environments.
Figure 1.4 Distribution of admixture proportions of S. mentella in the North Atlantic. Clusters D, I and S
represent genetically distinguishable deep, demersal, and shallow S. mentella in the Irminger Sea and
[image:24.595.107.500.570.714.2]13 1.8 Fisheries management
The population structure of North Atlantic S. mentella has been heavily debated for
decades (Magnússon & Magnússon, 1995; Cadrin et al 2010). They support an important
fishery industry and have become over-exploited in recent years (Marine Research Institute, 2014). Landings for the shallow-pelagic stock in the Irminger Sea and adjacent waters have been declining since 2006, effort has decreased and landings were just over
200 tonnes (t), which is the lowest they have been since fishing was first reported (Figure
1.5). In 2013, 1,500 t of the shallow pelagic redfish stock to the southeast and south of
Cape Farewell, Greenland were collected. Landings for the deep-pelagic stock ranged from 75-140 kt in 1995-2004, climaxing in 1996. Since 2005, landings have decreased and were from 30-67 kt. Landings in 2013 were estimated at 45 kt, an increase of almost 13 kt over the year before and similar to those of 2011 (Figure 1.5).
Within the Irminger Sea and adjacent waters, the International Council for the Exploration of the Sea (ICES) currently recommend a separate total allowable catch (TAC) for both groups (http://goo.gl/sZfUmC; last accessed 17/12/15). ICES in 2010 advised a moratorium on the shallow stocks due to the serious decline in recent years (Figure 1.5), and the total catch limit should not exceed 20,000 tonnes to be divided among
nations. Yet despite a holistic attempt to understand stock structure and identify
management units (Cadrin et al., 2010), international agreement is often contested because
some consider S. mentella in the Irminger Sea to be a single stock (Marine Research
Institute, 2014). This consequently leads to overexploitation and has cascading impacts on the assessment and management of these commercially valuable fish stocks, which remain
hotly debated (Makhrov et al., 2011; Cadrin et al., 2011). Hence, more exhaustive data are
needed to fully understand the population structure in this group.
North Atlantic Sebastes support an important fishery industry (Figure 1.5c), yet the pattern of redfish marketed in Europe is limited and obscured by species identification made from overlapping meristic and morphological features, which leads to these species
being often marketed under a single vernacular name, “redfish”. DNA based authenticity
techniques have been widely used in food control and appears to be the most commonly applied approach for identifying wild fishery products (Griffiths et al., 2014; Mariani et al., 2015). For example, Logan et al., 2008 used a molecular approach to determine the
identity of Pacific Sebastes (commonly known as rockfish) sold under a common name,
14
a common name have different conservation needs and removes the ability of consumers
to choose less vulnerable species. Moreover, Sebastes spp. represent a recently radiating
lineage and Steinke et al. (2009) showed that traditional molecular approaches for Sebastes
identification is challenging because the COI fails to reliably distinguish species. Thus in
order to realise the extent of Sebastes marketed in Europe, a product accuracy survey is
required to determine the number and identity of Sebastes species, particularly S. mentella
groups. Failure to recognise distinct groups within a rapidly divergent lineage will mask
population declines and the risk of extinction – which potentially leads to the elimination
of incipient species.
Figure 1.5 Landings from the Irminger Sea of (a) shallow pelagic redfish since 1982 and (b) deep pelagic
redfish since 1991. “Others” refer to catch data from other nations (from Marine Research Institute, 2014). (c) Real 2005 value (US$) of global catches of of Redfishes (Sebastes) by Exclusive Economic Zones (EEZ,
[image:26.595.89.524.278.650.2]15
To this end a thorough examination regarding the issue of depth for this widely distributed oceanic species is needed. The ability to accurately distinguish population structure will help to understand the mechanisms underpinning their divergence along an environmental depth gradient. In order to study mechanisms of divergence, a thorough analysis of population connectivity, adaptation and genome wide variation are prerequisites for understanding population divergence, and in that context the following objectives for this thesis were identified:
Use a multiple marker approach to resolve the interplay between longitudinal,
latitudinal and vertical gradients in shaping the structure of this oceanic species in
the Irminger Sea and adjacent waters (Chapter II).
Examine the sensitivity of rod visual pigments involved in dim-light vision by
conducting spectral analysis in order to link genotype with phenotype (Chapter III).
Conduct whole transcriptome sequencing of retinal tissue from a subset of
“shallow” and “deep” S. mentella to learn more about adaptation and plasticity of
their visual systems (Chapter IV).
Assess the state of Sebastes by investigating the patterns of redfish marketed from
16
2
Chapter II
Three-Dimensional Post-Glacial Expansion and
Diversification of an Exploited Oceanic Fish
2.1 Abstract
Vertical divergence in marine organisms is being increasingly documented, yet much remains to be done to understand the role of depth in the context of phylogeographic reconstruction and the identification of management units. An ideal study system to address this issue is the beaked redfish, Sebastes mentella – one of four species of
“redfish” occurring in the North Atlantic – which is known for a widely-distributed
“shallow-pelagic” oceanic type inhabiting waters between 250 and 550m, and a more
localised “deep-pelagic” population dwelling between 550 and 800m, in the oceanic
habitat of the Irminger Sea. Here, we investigate the extent of population structure in relation to both, depth and geographic spread of oceanic beaked redfish throughout most of its distribution range. By sequencing the mitochondrial control region of 261 redfish collected over a decadal interval, and combining 160 rhodopsin coding nuclear sequences and previously genotyped microsatellite data, we map the existence of two strongly divergent evolutionary lineages with significantly different distribution patterns and historical demography, and whose genetic differentiation is mostly explained by depth. Combined genetic data, analysed via independent approaches, are consistent with a late Pleistocene lineage split, where segregation by depth likely resulted from the interplay of climatic and oceanographic processes with life-history and behavioural
traits. The on-going process of diversification in North Atlantic S. mentella may serve
17 2.2 Introduction
While recent studies continue to amass evidence for notable patterns of population structure in the oceans (Sala-Bozano et al., 2009; Therkildsen et al., 2013; Silva et al., 2014), the long-standing paradigm of limited geographic barriers, high dispersal potential, and large effective population size continues to hold when comparing oceanic with continental environments (Hauser & Carvalho 2008). Despite interpretive frameworks that help explain marine population structure based on geographical distance (Palumbi, 1994; Weersing & Toonen 2009), oceanographic features (Galindo et al., 2010; Gaither et al., 2010; Selkoe & Toonen, 2011) and life-histories (Hare et al.,
2005; Riginos et al, 2014), the reconstruction of connectivity patterns and recent
evolutionary processes in oceanic species remains a difficult task, due to the
afore-mentioned “marine paradigm” (see Waples, 1998; Avise, 2004; Hauser & Carvalho
2008) and the inherent difficulty – compared to terrestrial and freshwater habitats – of
even locating populations and collecting representative samples over vast areas.
All of the above is further compounded by a conspicuous, yet seldom investigated, factor: depth. Depth physically multiplies the expanses across which individuals can disperse and populations can spread, over both ecological and evolutionary time scales. Depth is also associated with a wide variety of environmental factors, including temperature, salinity, hydrostatic pressure, food resources and light, which, independently or in combination, influence physiology, behaviour and adaptations (Somero, 1992; Vonlanthen et al., 2008; Hyde et al., 2008; Irwin, 2012; Roy et al., 2012; Yancey et al., 2014). As more studies document the emergence of depth-related patterns, it becomes apparent that this factor plays a role in the formation of distinct biological units, even in large, near-continuously distributed populations
(Doebeli & Dieckmann, 2003; Vonlanthen et al., 2008; Knutsen et al., 2009; Stefánsson
et al., 2009a; Ingram, 2010; Roy et al., 2012; Jennings et al., 2013). Sea-level fluctuations during the last glacial cycle have been shown to have a role in shaping aquatic environments (Blanchon & Shaw, 1995) and are thought to have contributed to the isolation and divergence of marine organisms (Ludt & Rocha, 2015). Furthermore, the distribution of oceanic species over vast geographical areas is impacted by complex, large-scale ocean circulation processes, interplaying with bathymetric features along
continental margins and mid-ocean ridges (Hemmer-Hansen et al., 2007; Knutsen et al.,
18
oceanography, complex life-histories and the historical backdrop appears as one main topical challenge in marine population biology, which may also have significant consequences for conservation and management.
One taxonomical group that has played a pivotal role in shaping our understanding of adaptive divergence along depth gradients in marine environments is the genus Sebastes (Alesandrini & Bernardi, 1999; Hyde & Vetter, 2007; Sivasundar & Palumbi, 2010). While most species of Sebastes are limited to the North Pacific (n >
100), with two occurring in the southern hemisphere, the four “young” North Atlantic
(NA) species are thought to have descended from an ancestor of the North Pacific S. alutus lineage that invaded the NA under 3 my ago, when the Bering strait opened as a
result of warming arctic waters (Raymo et al., 1990; Love et al., 2002; Hyde & Vetter,
2007). Sebastes spp. are ovoviviparous (i.e. internal fertilisation), long-lived (50-60 years), slow-growing (generation time 12-20 years) and late-maturing species with low natural mortality; such life-history characteristics influence complex population structuring (Cadrin et al., 2010). The beaked redfish, S. mentella, widely distributed throughout the boreal waters of the North Atlantic and Arctic Oceans, exhibits complex
depth-associated patterns of substructure (Stefánsson et al., 2009b; Cadrin et al., 2010;
Shum et al., 2014). While a demersal unit is recognised along the Icelandic continental
shelf and slopes (Cadrin et al., 2010), S. mentella exhibits a primarily pelagic, open-ocean behaviour, occurring in assemblages at different depth layers, with a widely distributed shallow-pelagic group inhabiting depths between 200 and 550m, and a deep-pelagic group between 550 and 800m mostly circumscribed to the Northeast Irminger Sea (Stefánsson et al., 2009; Cadrin et al., 2010; Planque et al., 2013; Shum et al., 2014).
Almost three decades of research investigating the geographic patterns and genetic structuring of S. mentella have resulted in intense debates (Makhrov et al.,
2011; Cadrin et al., 2011) regarding the number of genetically distinct populations, how
they are spatially structured and connected, and how and when they have a achieved their current distribution. All efforts so far had been based on traditional sampling
campaigns mostly focused on geographical/fishery coverage (Cadrin et al., 2010; Shum
et al., 2014), with a lack of adequate standardized sampling and replication across depths layers where different beaked redfish assemblages occur (Bergstad, 2013;
19
molecular and analytical toolkit (Stefánsson et al., 2009a) or the sampling coverage
(Shum et al., 2014) to robustly test specific phylogeographic hypotheses.
Here we present the first extensive sampling, compared to previous campaigns, and phylogeographic investigation of pelagic S. mentella in the North Atlantic using mitochondrial and nuclear genetic markers to resolve the interplay between longitudinal, latitudinal and vertical gradients in shaping the structure of this oceanic
species. Specifically, we aim to (1) examine the phylogeographic history of oceanic S.
mentella across the North-east Atlantic, with special attention to the main two clades
identified in Shum et al. (2014), (2) assess the degree to which mitochondrial lineage
distribution fits with the currently perceived S. mentella stock structure, and (3)
reconstruct the most realistic scenario for the evolution of this species in the North Atlantic.
2.3 Materials and methods
2.3.1 Sample collection
Samples were collected as part of the Icelandic Marine Research Institute 2013 survey,
conducted from 11th June to the 6th July 2013 throughout the Irminger Sea. Trawling for
redfish involved collecting replicated samples along a survey transect from three geographical zones at seven sites including shallow (above 500m) and deep (below
500m) habitats (Figure 2.1, Table 2.1). A MultiSampler unit with three separate cod-ends
was attached to the end of the pelagic trawl enabling the collection of several
independent discrete samples at three different depth strata in one trawl haul (Figure 2.2;
Engås et al., 1997). The opening and closing of the nets were programmed to specific
20
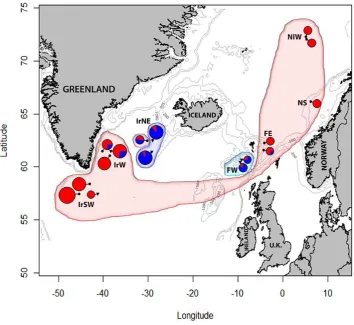
Figure 2.1Sample collection locations and distribution of mtDNA haploytpes. Shading show SAMOVA
group structure and circles show distribution of clade A (red) and B (blue) haplogroups (see Figure 2.3). Point circles and inverted triangles indicate redfish caught above and below 500m respectively. Grey lines indicate 200, 500 and 1000 metre limit. See Table 2.1 for location codes.
Figure 2.2 MultiSampler unit attached to the trawl and consists of
[image:32.595.157.424.494.644.2]Table 2.1Location, Group code, and year of capture, trawl depth range, position, and number of individuals (N), nucleotide (π) and haplotype
(h) diversities of S. mentella investigated for 2013 and 2006/7 data from the North Atlantic.
MS: multi-sampler, Dm: demersal, Pe: pelagic trawls.
Location Group code
Year Gear Trawl depth range
Latitude (N) Longitude N π+SD h+SD Irminger Sea
Northeast deep IrNEDP13 2013 MS 550-650 62.44 -29.08 26 0.003±0.0006 0.754±0.090
Northeast shallow IrNESP13 2013 MS 250-300 62.45 -30.21 11 0.006±0.0019 0.927±0.066
West shallow IrWSP13 2013 MS 200-275 61.00 -38.53 23 0.004±0.0007 0.893±0.036
West intermediate IrWInt13 2013 MS 475 61.45 -40.19 16 0.004±0.0004 0.908±0.040
West deep IrWDP13 2013 MS 600 61.44 -29.11 26 0.005±0.0006 0.898±0.029
Southwest shallow IrSWSP13 2013 MS 300 57.44 -45.40 33 0.004±0.0005 0.883±0.035
Southwest deep IrSWDP13 2013 MS 550-850 57.45 -41.04 8 0.004±0.0007 0.857±0.108
Archived samples Irminger sea
Southwest shallow IrSWSP06 2006 Pe 284 58.38 -43 25 0.004±0.0005 0.883±0.035
Northeast deep IrNEDP06 2006 Pe 786 61.44 -29.11 26 0.002±0.0005 0.578±0.114
Faroe Islands West
East FW1DP07 2007 Dm 589–644 60.59 -9.32 9 0.006±0.0014 0.917±0.092
West FW2DP07 2007 Dm 704–658 60.44 -9.57 11 0.006±0.0008 0.927±0.066
Faroe Islands east
South FE1SP07 2007 Dm 388–401 61.59 -4.19 9 0.007±0.0027 0.833±0.127
North FE2SP07 2007 Dm 366–433 62.21 -4.13 9 0.005±0.0009 0.911±0.077
Norwegian Shelf NSSP07 2007 Dm 430 66.14 6.2 10 0.002±0.0008 0.533±0.180
Norwegian international waters
South NIW1SP07 2006 Pe 440 72.01 5.3 10 0.003±0.0010 0.800±0.100
North NIW2SP07 2006 Pe 445 72.21 5.15 10 0.003±0.0009 0.822±0.097
22
Between 5-30 specimens were collected and sampled from each haul section, for a total of
143 dorsal fin clip tissue samples of S. mentella collected at 7 sites distributed throughout
the Irminger Sea and stored in 100% ethanol. The data set was also complemented by the 50 mtDNA control region and 22 rhodopsin sequences that first revealed the existence of
two depth-associated S. mentella clades in the Irminger Sea (Shum et al., 2014; GenBank
accession numbers mtDNA: KM013849-KM013898; rhodopsin: KM013899.1-KM013920.1) and by 68 randomly selected archived tissue samples (previously genotyped at 12 microsatellite loci by Stefánsson et al., 2009b), to increase cover the current biogeographical spread of the species: west Faroe (n=20) and east Faroe (n=18) collected off the Faroese shelf in 2007, Norwegian Shelf (n=10), and pelagic collections from
Norwegian International Waters (n=20), also from 2006-2007 surveys (Figure 2.1, Table 2.1).
Additional archived tissue samples of 8 S. norvegicus and 7 S. viviparus were also
analysed for downstream analysis as outgroups, as well as 36 tissue samples of S. fasciatus
collected on board the Irish research vessel RV Celtic Explorer in May 2012 off
Newfoundland, Canada. The sampling scheme and sample sizes per site are summarized in
Table 2.1.
2.3.2 Generation of molecular data
DNA was extracted using a modified salt extraction protocol (Miller et al., 1988). An
approximately 500 base pair (bp) fragment of the non-coding mitochondrial control region
was amplified using primers developed by Hyde & Vetter (2007; D-RFμ 5′-CCT GAA
AAT AGG AAC CAA ATG CCA G-γ′ and Thr-RFμ 5′-GAG GAY AAA GCA CTT GAA
TGA GC-γ′.) and sequenced using Thr-RF. The intron-free rhodopsin gene was used to
amplify an approximately 800 bp fragment in 138 S. mentella samples using primers
developed by Chen, Bonillo & Lecointre (β00γ); Rh1λγμ 5′-CNT ATG AAT AYC CTC
AGT ACT ACC-γ′ and Rh10γλrμ 5′-TGC TTG TTC ATG CAG ATG TAG A-γ′ and
sequenced using Rh193. PCR reactions and temperature profiles followed Shum et al.
(2014). PCR products were purified and sequenced by Source BioScience LifeSciences (http://www.lifesciences.sourcebioscience.com/). Resulting sequences were manually
checked for quality, edited and trimmed using Chromas Lite 2.1.1
23 2.3.3 Data analysis
Mitochondrial DNA variation and structure
Molecular diversity indices, including nucleotide (π) (Nei, 1λκ7) and haplotype (h) (Nei & Tajima, 1981) diversities, were estimated using DnaSP v5.10 (Librado & Rozas, 2009). Haplotype genealogies were constructed in the program HapView, following a method
described by Salzburger et al. (2011), based on a maximum likelihood tree implemented in
PHYLIP v3.695 (Felsenstein, 1989) for mtDNA. To gauge the level of population differentiation among collections, ARLEQUIN v.3.5.1.2 (Excoffier & Lischer, 2010) was
used to calculate pairwise population ΦST and FST, with significance of pairwise
differences at the level of 0.05 assessed with 10,000 permutations. As a correction for
multiple tests, p-values were adjusted according to the modified false discovery rate
method (Narum, 2006). The relationship among all sample collections were visualised by
multi-dimensional scaling (MDS) of pairwise ΦST and FST using the MASS (Venables &
Ripley, 2002) package in the R programming environment (Team RDC, 2005). Spatial
analysis of molecular variance (SAMOVA 1.0) (Dupanloup et al., 2002) was used to
identify distinct groups of populations within which (FSC) genetic variance is minimal and
among which (FCT) it is greatest. This method partitions populations into a specified
number of groups and the partition scheme (k) that maximizes differences between FSC and
FCT is selected. The optimum number of groups was determined by running SAMOVA
with two to eight groups with 100 annealing steps for each run.
Distribution of geographically restricted alleles SAShA – We tested the extent to which haplotypes are randomly distributed in the NA, as implemented in the program SAShA
(Kelly et al., 2010). Assuming haplotypes are identical-by-descent, non-random
distribution of haplotypes can indicate departures from panmixia and occurrences of the same haplotypes in different locations can be considered evidence of gene flow. SAShA generates observed distribution (OM) of geographic distances among instances of each haplotype which is compared to the null distribution (EM; i.e. allele distribution under panmixia) generated from the same data. An OM significantly less than EM indicates that haplotypes are under distributed, and that gene flow is somewhat restricted. For mtDNA,
we tested for significant deviation of the arithmetic mean of OM from EM (Dg) using 1000
24 2.3.3.1 Demographic changes
First, Tajima’s DT (Tajima, 1λκγ) and Fu’s Fs (Fu, 1997), calculated in DnaSP, were tested to examine deviations of the mitochondrial site frequency spectrum expected under the neutral expansion model for major clades (see results). Significant and negative DT and Fs values indicate population size changes or directional selection (i.e., selective sweep; Aris-Brosou & Excoffier, 1996). Mismatch distribution analysis was also carried out, as implemented in ARLEQUIN, whereby a unimodal frequency distribution of pairwise haplotype differences is expected for populations that have experienced recent demographic expansion, and a multimodal frequency distribution is expected for populations at equilibrium. To estimate the divergence time, we used the formula T =
Da/2µ, where 2µ represents a general mtDNA evolutionary rate, commonly assumed to be
around 11% per million years for fish mtDNA control region (Patarnello et al., 2007).
To further assess the demographic changes in effective population size since the time of most recent common ancestor (TMRCA) of the identified lineages, Bayesian skyline plots (BSPs) were generated using the software package BEAST v. 1.8
(Drummond et al., 2012). Analysis was performed using the best fit model of nucleotide
substitution (GTR+Γ) implemented using Modeltest3.7 (Hasegawa et al., 1985; Posada &
Crandall, 1998) and a fixed clock was set using 11%/million years (Myr) (Patarnello et al.,
2007). For each analysis the Monte Carlo Markov Chain (MCMC) was set at 150 million steps, which yielded effective sample sizes (ESS) of at least 200. Once the appropriate mixing and convergence was met, the first 10% of the posterior was discarded and the remainder combined for parameter inferences. BSPs were estimated in Tracer v. 1.6
(Rambaut et al., 2014) and plotted using the upper 95% highest posterior density.
2.3.3.2 Marker comparison and Approximate Bayesian Computation
To gain an exhaustive picture of genetic variation, we also investigated the nuclear intron-free, gene coding for the rhodopsin pigment, which Shum et al. (2014) reported to also
exhibit alternative genotypes associated with depth. Haplotype genealogies for 160 S.
mentella rhodopsin sequences were constructed in HapView using a maximum likelihood tree generated using PHYLIP. MtDNA haplogroup distributions and rhodopsin genotypic
Chi-25
square tests (2x2 contingency tables). Furthermore, we re-examined microsatellite data at
12 loci, previously genotyped by Stefánsson et al. (2009b), for the 118 historical samples
from 2006-2007 (Stefánsson et al., 2009b), and reanalysed them in combination with the
newly-generated mtDNA sequences. Population structure was assessed by calculating
pairwise genetic differentiation through Slatkin’s RST and Weir & Cockerham’s FST, with 9,999 permutations carried out to obtain significance levels, using GenAIEx 6.501 (Peakall
& Smouse, 2006). FST measures genetic differentiation based on allele identity whereas its
analogue RST is an allele size measure of differentiation that assumes a strictly stepwise
mutation process. RST is expected to be larger than FST if populations have diverged for a
sufficiently long time in the case of ancient isolation (Hardy et al., 2003). To visualise the
relationship among samples, MDS analysis based on FST and RST values were carried out
in the R environment, and population structure of individual genotypes was visualized by
correspondence analysis (CA) using GENETIX 4.05 (Belkhir et al., 1996).
We tested concordance of pairwise genetic distances using a Simple Mantel test
among redfish collections from available areas, based on mtDNA ΦST/FST vs.
microsatellite FST. To further illustrate the distribution pattern of horizontal and vertical genetic variation, partial mantel tests were calculated between matrices of genetic distances (using mtDNA and microsatellite markers) and depth (m) while removing the influence of
geographic distance (km), and vice versa, using the Vegan (Oksanen et al., 2011) package
in R, with statistical significance evaluated with 9,999 permutations.
We then used Approximate Bayesian Computation (ABC), implemented in
DIYABC v2.0 (Cornuet et al., 2008, 2014), to assess the evolutionary relationships among
S. mentella lineages in the North Atlantic. We compared six simple scenarios (see results), to identify the most likely evolutionary events, and the effective population sizes and times of divergence implicated. The ABC approach is used to provide inference about the posterior distribution of the model parameters in order to establish how the summary
statistics compare between simulated and observed datasets (Cornuet et al., 2008). We
used default priors and generated simulated datasets combining both mtDNA and microsatellite information, with a total of 28 summary statistics, the calculation of which is implemented in DIYABC; for microsatellites: mean number of alleles, genic diversity, size variance and Garza & Williamson’s M-ratio per population and FST pairwise divergence;