1
An Investigation into the Quantification and
Mitigation of Urban Diffuse Pollution
Thomas CURWELL
School of Computing, Science and Engineering
University of Salford
Submitted in Partial Fulfilment of Requirements of the Degree of
2
Contents
List of Figures ... 5
List of Tables ... 7
Acknowledgements ... 8
List of Acronyms and Abbreviations ... 9
Abstract ... 10
1 Chapter 1 – Introduction ... 12
1.1 Knowledge Gap ... 13
1.2 Project Objectives ... 14
1.3 Original Research ... 15
1.4 Methodology Summary ... 16
1.5 PhD Structure ... 17
2 Chapter 2 – Literature Review ... 20
2.1 Legislative Background to Urban Diffuse Pollution ... 20
2.1.1 Water Framework Directive ... 24
2.1.2 The Revised Bathing Water Directive ... 28
2.1.3 Flood and Water Management Act ... 30
2.1.4 Other Legislation ... 31
2.2 Catchment Management and Land Use ... 35
2.2.1 What is Catchment Management? ... 35
2.2.2 Land Use and Diffuse Pollution ... 37
2.3 Urban Diffuse Pollution ... 38
2.3.1 Sources of Pollutants... 38
2.3.2 Pollutant Pathways to Waterbodies ... 40
2.3.3 Combined Sewer Overflows ... 43
2.3.4 Pollutants... 45
2.3.5 The ‘First Flush’ Effect ... 51
2.3.6 Importance of Over Abstraction and Low Discharge Periods ... 52
2.3.7 Development and Use of Best Management Practices ... 53
2.4 Urban Storm Water Treatment ... 56
2.4.1 Principles of Sustainable Drainage and Stormwater management ... 57
2.4.2 Sustainable Urban Drainage Systems ... 62
2.4.3 Proprietary Treatment Systems ... 65
2.4.4 Benefits ... 67
2.4.5 Challenges and Barriers ... 70
3
2.5.1 Catchment Focused Studies ... 77
2.5.2 SuDS Focused Studies ... 82
2.5.3 PTS Focused Studies... 84
2.6 Literature Review - Summary ... 87
Chapter 3 – Methodology Phase 1 ... 90
3.1 Materials and Methods ... 90
3.2 Project Background and Development ... 92
3.3 Identification of Study Area ... 92
3.4 River Sampling Regime ... 94
3.5 Analysis of River Sample Data ... 99
Methodology – Phase 2 ... 101
3.6 Selection of Treatment Systems and Locations ... 101
3.7 Monitoring of Treatment Systems... 104
3.8 Stakeholder Engagement ... 105
3.9 Pre Site Works ... 106
3.10 Design, Installation and Monitoring ... 107
3.10.1 Downstream Defender ... 107
3.10.2 Storm X4 Heavy Traffic ... 114
3.10.3 Auto-Sampler Monitoring Methodology ... 117
3.10.4 Smart Sponge Passive Skimmers - Cage ... 122
3.10.5 Smart Sponge Passive Skimmers - Road Gullies ... 127
3.11 Analysis of Treatment System Monitoring Data ... 130
3.12 Summary ... 131
4 Chapter 4 – Results and Discussion ... 133
Phase 1 - River Monitoring Results and Analysis ... 133
4.1 Analysis of Central Wigan Discharge Data ... 133
4.2 Long Term and Seasonal Analysis of Rainfall in Wigan Study Area ... 136
4.3 Analysis of River Sampling Results ... 140
4.3.1 Nutrient Concentrations at Sample Sites ... 143
4.3.2 FIO Concentrations at Sample Sites ... 147
4.3.3 Metals and TSS ... 157
4.3.4 Polycyclic Aromatic Hydrocarbons ... 172
4.3.5 Halogenated Solvents... 174
4.3.6 Biochemical Oxygen Demand, Chemical Oxygen Demand and Total Organic Carbon 175 4.4 SAGIS Analysis ... 179
4
Phase 2 - Proprietary Treatment System Sampling Results... 188
4.6 Downstream Defender... 190
4.6.1 Example Event ... 190
4.6.2 Summary of All Events ... 193
4.7 Storm X4 Heavy Traffic ... 199
4.7.1 Example Event ... 200
4.7.2 Summary of All Events ... 204
4.8 Principle Component Analysis of Water Quality Data ... 207
4.9 Smart Sponge ... 209
4.9.1 Scott Lane ... 209
4.9.2 Little Wigan Theatre ... 212
4.10 Characterisation of Stormwater Pollutants ... 214
4.10.1 Cherry Gardens Sample Site ... 214
4.10.2 Coppull Lane Sampling Site ... 216
4.10.3 Comparison with other Data ... 219
4.11 Summary of Findings from Monitoring of the PTS ... 221
4.11.1 Downstream Defender ... 221
4.11.2 Storm X4 Heavy Traffic ... 221
4.11.3 Smart Sponge ... 222
4.11.4 Estimation of Pollutant Load from Catchment Area ... 223
5 Chapter 5 – Conclusion ... 226
5.1 What is the Urban Diffuse Pollution Problem? ... 226
5.2 What are the Key Findings of This Work? ... 228
5.2.1 Quantifying the Problem of Urban Diffuse Pollution ... 229
5.2.2 Evaluation of Methodology ... 230
5.2.3 Mitigating the Problem of Urban Diffuse Pollution ... 231
5.2.4 Evaluation of Methodology ... 234
5.3 Recommendations for Further Work... 235
References ... 238
5
List of Figures
Figure 1 - Urban Water System: Hybrid System (Butler and Davis, 2011)... 41
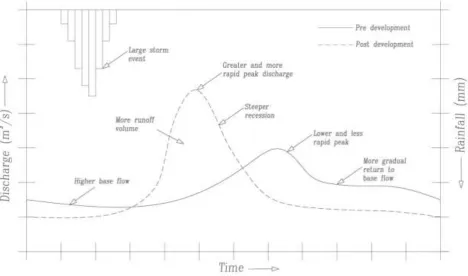
Figure 2 - Effect of development on river discharge (CIRIA. et al., 2007). ... 42
Figure 3 - Average Rainfall in England, Wales and Scotland (2001-13) (Met Office, 2014). ... 53
Figure 4 - Average Rainfall Northern and Southern Britain (2001-13) (Met Office, 2014) ... 53
Figure 5 - Sustainable Drainage Objectives (CIRIA. et al., 2007) ... 57
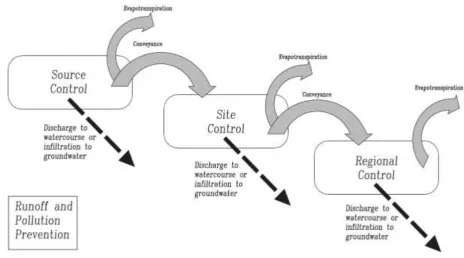
Figure 6 - SuDS Management Train (CIRIA. et al., 2007). ... 59
Figure 7 - Sample plot from Chiew and McMahon (1999) ... 81
Figure 8 - Research Methodology Flow Chart ... 91
Figure 9 - Study Area and Final Sample Locations ... 94
Figure 10 - Land use across study catchment (CEH.,2007) ... 95
Figure 11 - Map of known CSO and WWTWs Discharge locations ... 96
Figure 12 - Proposed WQV for Testing ... 98
Figure 13 - Treatment system effect pollutant concentration during storm event ... 102
Figure 14 - DD Long Section Detail ... 108
Figure 15 - DD Sump placement ... 109
Figure 16 - DD being lowered in to place ... 109
Figure 17 - Upstream Diversion chamber construction ... 110
Figure 18 - ISCO 6712 Sample Unit ... 111
Figure 19 - Sampler with Cover Removed ... 111
Figure 20 - (left) View up the pipe showing the placing of the flow sensor ... 111
Figure 21 - (above) View showing fixing of the sample line in the chamber ... 111
Figure 22 - Sampler winched out of sample chamber ... 112
Figure 23 - Sampler and Winch ... 112
Figure 24 - Long sections showing location of sampling components ... 112
Figure 25 - The carousel units separated from the auto sampler ... 113
Figure 26 - Decanting of sampler bottles ... 113
Figure 27 - Decanted Samples ... 113
Figure 28 - X4 Construction Drawings ... 114
Figure 29 - X4 chamber installation ... 115
Figure 30 - X4 chamber (foreground) and upstream diversion manhole (background) ... 115
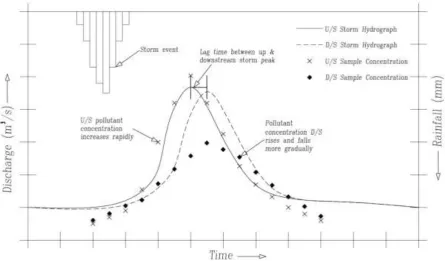
Figure 31 - Demonstration of lag time on sample concentration ... 118
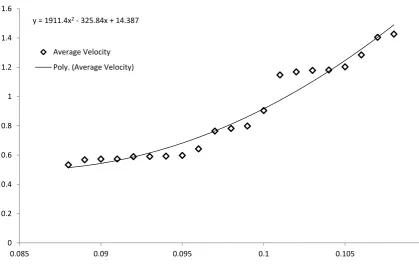
Figure 32 - Average Velocity against Level ... 121
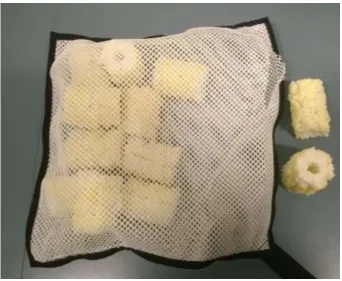
Figure 33 - Clean Smart Sponge Skimmer ... 122
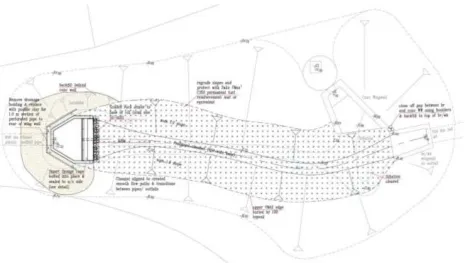
Figure 34 - Scott Lane design, plan view ... 123
Figure 35 - The discharge at Scott Lane ... 124
Figure 36 - View down the site away from the discharge ... 124
Figure 37 - View of the new wing wall ... 125
Figure 38 - View from site outlet ... 126
Figure 39 - Smart sponge in operation ... 126
Figure 40 - Cleaning of the road gully prior to skimmer installation ... 127
Figure 41 - Fixing of skimmer to manhole lid ... 127
Figure 42 - Weighing of individual passive skimmer prior to cleaning... 128
Figure 43 - Piece of SS prior to washing ... 128
Figure 44 - A jet wash was used to clean Smart Sponge pieces ... 128
Figure 45 - Cleaned smart sponge pieces being weighed ... 129
Figure 46 - Boxplot of annual discharge at central Wigan gauging station ... 133
Figure 47 - River Douglas Flow Duration Curve... 134
Figure 48 - Wigan Annual Average Rainfall 1996-13 ... 136
Figure 49 - Average Annual Rainfall Volume, Duration and Intensity (1996-2013) ... 137
Figure 50 - Average Monthly Rainfall Volume, Duration and Intensity (1996-2013) ... 138
Figure 51 - Average Monthly Rainfall Volume, Duration and Intensity in 2012 ... 139
6
Figure 53 - Average Ammonia Change Downstream ... 145
Figure 54 - Range of E.coli concentrations at sample sites ... 150
Figure 55 - E. coli Concentrations (Low Event) ... 151
Figure 56 - E. coli Concentrations (Medium Event) ... 152
Figure 57 - E. coli Concentrations (High Event) ... 153
Figure 58 - Average E.coli Change Downstream ... 155
Figure 59 - Range of TSS concentrations at sample sites ... 158
Figure 60 - Range of Zinc concentrations at sample sites ... 159
Figure 61 - Range of Aluminium concentrations at sample sites ... 160
Figure 62 - Range of Copper concentrations at sample sites ... 160
Figure 63 - Heavy Metal Concentrations (Low Event) ... 162
Figure 64 - TSS Concentrations (Low Event) ... 163
Figure 65 - Heavy Metal Concentrations (Medium Event) ... 164
Figure 66 - TSS Concentrations (Medium Event) ... 165
Figure 67 - Heavy Metal Concentrations (High Event) ... 166
Figure 68 - TSS Concentrations (High Event) ... 167
Figure 69 - Average TSS Change Downstream ... 169
Figure 70 - Average Zinc Change Downstream ... 169
Figure 71 - Average Aluminium Change Downstream ... 170
Figure 72 - Average Copper Change Downstream ... 171
Figure 73 - Range of COD concentrations at sample sites ... 176
Figure 74 - Range of BOD concentrations at sample sites ... 177
Figure 75 - Range of TOC concentrations at sample sites ... 178
Figure 76 - Comparison of SAGIS predictions against Wigan values - Orthophosphate ... 180
Figure 77 - Comparison of SAGIS predictions against Wigan values - Nitrate ... 181
Figure 78 - Comparison of SAGIS predictions against Wigan values – Zinc ... 182
Figure 79 - Comparison of SAGIS predictions against Wigan values – Copper ... 183
Figure 80 - Comparison of SAGIS predictions against Wigan values - Nickel ... 184
Figure 81 - TSS plotted against discharge from storm event 9 (7/3/14) ... 191
Figure 82 - Aluminium plotted against discharge from storm event 9 (7/3/14) ... 192
Figure 83 - PSD Graph (output from Horiba la-950) ... 197
Figure 84 - TSS plotted against discharge from storm event 2 (2/6/14) ... 201
Figure 85 - Aluminium plotted against discharge from storm event 2 (2/6/14) ... 201
Figure 86 - Dissolved Aluminium plotted against discharge from storm event 2 (2/6/14)... 202
Figure 87 - Dissolved Zinc plotted against discharge from storm event 2 (2/6/2014) ... 203
Figure 88 - PCA Component Plot and Clusters Formed ... 208
Figure 89 - Pollutant weight of skimmers removed from Scott Lane Site ... 210
Figure 90 - (Left) Disintegrated piece of Smart Sponge ... 211
Figure 91 - (Above) Some sections were significantly degraded ... 211
Figure 92 - Pollutant weight of skimmers removed from Little Wigan Theatre Site ... 212
Figure 93 - 5 minute totals of discharge against TSS ( DD Site) ... 215
Figure 94 - 5 minute totals of discharge against Aluminium ( DD Site) ... 215
Figure 95 - Aluminium against TSS ( DD Site) ... 215
Figure 96 - Cadmium against TSS (DD Site) ... 215
Figure 97 - 5 minute totals of discharge against TSS (X4 Site) ... 217
Figure 98 - 5 minute totals of discharge against Aluminium (X4 Site) ... 217
Figure 99 - 5 minuet totals of discharge against Aluminium Dissolved (X4 Site) ... 217
Figure 100 - Aluminium against TSS (X4 Site) ... 217
Figure 101 - Cadmium against TSS (X4 Site) ... 218
Figure 102 - Aluminium Dissolved against TSS (X4 Site) ... 218
Figure 103 - Aluminium Dissolved against Aluminium (X4 Site) ... 218
7
List of Tables
Table 1 - Summary of SuDS Components ... 63
Table 2 - Summary of PTS ... 66
Table 3 - Summary of System Maintenance (CIRIA, 2014). ... 73
Table 4 - Project Sites and PTS ... 104
Table 5 - Number of Samples Collected at Sites ... 141
Table 6 - Orthophosphate and Ammonia T-Test Values ... 143
Table 7 – Average nutrient concentrations in Horwich WWTWs discharge ... 146
Table 8 - FIO T-Test Values ... 147
Table 9 - Comparison of RBWD and Wigan project values ... 148
Table 10 - Bacteriological Assessment Guide ... 149
Table 11 - TSS and Metal T-Test Values ... 157
Table 12 - Summary of PaH Detections in the Study ... 172
Table 13 - Summary of HS Detections ... 174
Table 14 - Toxicology Data for Dichloroethane ... 174
Table 15 - COD, BOD and TOC T-Test Values ... 176
Table 16 - Summary of Monitoring Sites ... 189
Table 17 - Summary of Monitored DD Events (TSS) ... 194
Table 18 - Summary of Monitored DD Events (Aluminium) ... 194
Table 19 - Summary of Monitored X4 Events (TSS) ... 205
Table 20 - Summary of Monitored X4 Events (Aluminium) ... 205
Table 21 - Summary of Monitored X4 Events (Aluminium Dissolved) ... 205
Table 22 - KMO and Bartlett's Test form PCA ... 207
8
Acknowledgements
There are a number of people to whom I owe a debt of gratitude for their help and support
without which this work could not have been completed. Firstly for their guidance with the
overall scope and focus as well as detailed advice in all aspects of the work completed I
would like to extend my sincere thanks to my supervisors, Dr Prasad Tumula and Dr Neil
Entwistle of the School of Computing, Science and Engineering at the University of Salford
I am very grateful the Environment Agency and EPSRC for providing funding and resources
for this project and to the agency staff at Richard Fairclough House, Warrington, Lutra
House, Preston and the National Lab Service. In particular I would like to thank Jo Bradley,
Sam Billington, Shirley Nield, Bill Derbyshire, Richard Wood, Louise Cramp, Tony
Callaghan, Dan Bond, Angela Gallagher, Tina Round, Mike Cooney, Tracy and Steve Smith.
Thanks are due to Tim Booth and Dan Slattery of TJBA Structural Engineering Consultancy,
Rochdale for help and advice in designing the treatment systems installed in Wigan and for
teaching me to use Autocad to produce the construction drawings for the project. Many
thanks also go to William Pye for their efforts in the ground and engineering construction
works for the project, in particular Richard Thornhill.
Finally I would like to thank all of my family and friends for their encouragement throughout
the project. In particular, I would like to thank my dad Steve Curwell for all the tireless
efforts in correcting drafts and the advice for further improvements, also my mum Janet for
all the packed lunches which kept me sustained when out sampling. Finally I would like to
thank my partner Harriet Smith who has been supportive throughout the process of my PhD,
for always being prepared to take my side and for help with proof reading and overall, even at
9
List of Acronyms and Abbreviations
AMP Asset Management Plan
BMPs Best Management Practices
BOD Biochemical Oxygen Demand
BWD Bathing Water Directive
CIRIA Construction Industry Research and Information Association
COD Chemical Oxygen Demand
CSO Combined Sewer Overflow (Outfall)
DCLG Department for Communities and Local Government
DD Downstream Defender
DFRA Department of Environment, Food and Rural Affairs
DETR Department of Environment, Transport and the Regions
DWD Drinking Water Directive
A Environmental Agency (England and Wales)
EEA European Environment Agency
E.coli Escherichia coli
EC European Commission
EQS Environmental Quality Standards
EQSD The Environmental Quality Standards Directive
EU European Union
FIO Faecal Indicator Organism (faecal bacteria indicator)
FWMA Flood and Water Management Act
HDVS Hydro Dynamic Vortex Separator
GR Grid Reference
IE Intestinal Enterococci
IPPC Integrated Pollution Prevention and Control
KMO Kaiser-Meyer-Olkin measure of sampling adequacy
MAC Maximum Allowable Concentrations
MS European Union Member State
Ofwat The Water Services Regulation Authority
ONS Office of National Statistics
PAHs Polyaromatic Hydrocarbons
PCA Principle Component Analysis
PS Priority Substances
PSD Particle Size Distribution
PTS Proprietary Treatment Systems (and Products)
RBWD Revised Bathing Water Directive
RSPB Royal Society for the Protection of Birds
SAGIS Source Apportionment Geographical Information System
SEPA Scottish Environmental Protection Agency
X4 Storm X4
SuDS Sustainable Urban Drainage (and Systems)
SWD Surface Water Drains
TOC Total Organic Carbon
TSS Total Suspended Solids
UWWTD Urban Waste Water Treatment Directive
WFD Water Framework Directive
WQV Water Quality Variables
10
Abstract
The overall aim of this work is to extend the knowledge of Urban Diffuse Pollution (UDP)
and to assess the effectiveness of available remediation solutions in a confined urban context,
where disruption from retrofitting proprietary treatment systems and products (PTS) to
existing infrastructure causes major difficulties. The research presented addresses the
quantification and remediation of UDP across a study area of the River Douglas in Wigan in
the North of England.
This study has involved an extensive programme of water quality sampling which has
allowed micro-level changes in pollutant concentration to be observed as a result of weather
event based urban runoff and enabling diffuse pollutants to be quantified. Following this the
study goes on to suggest solutions to remediate sources of UDP exploring the use of vortex
separation as a tool to treat polluting surface water drains. It provides performance data on
several available PTS some of which were installed in outfalls into the study area in the River
Douglas. These systems were monitored and further water quality data has allowed the
quantification of the effectiveness in pollutant removal of different PTS.
The study identifies the significant contribution of urban areas to diffuse pollution of river
water and shows that similar studies need to become widespread if the problem of UDP is to
be effectively addressed. Based on the significant contribution to knowledge in terms of the
new water quality data generated both in relation to river water quality and treatment
products and systems, a series of practical recommendations are proposed in relation to the
11
12
1
Chapter 1 – Introduction
The North West of England has a significant industrial heritage, and the region led the world
during the industrial revolution (Burton, 2003). However, the effluents generated by
industrial growth left a legacy of some of the most highly polluted rivers in Europe (Wood
and Handley, 1999). Major improvements were made with the introduction of basic waste
water treatment (Rosenthal, 2014), but it was not until the introduction of the Rivers
(Prevention of Pollution) Act of 1961, followed by the Control of Pollution Act in 1974, that
considerably more progress was made to improve the water quality of the region’s rivers.
As a consequence of this legislation, by the mid 1990’s, pollution from point discharges, such
as factory effluents and waste water treatment works (WWTWs), were under much tighter
control. As a result of these improvements the Environment Agency’s (EA) 2007 General
Water Quality Assessment showed, that over two-thirds of all rivers in the UK were of good
or very good biological and chemical quality (Environment Agency, 2007). However, several
papers (Davies and Neal, 2007; Rothwell et al., 2010a) demonstrate that, while improvements
have been made in the water quality of the rivers in the North West and subsequent
downstream waters over the last 25 years, mobilisation of pollutants along the rivers
continues to occur from point and diffuse sources. The removal of major point source
pollution has allowed identification of intermittent background pollution and the concept of
‘diffuse pollution’1
has become more prominent. The EA also suggest that 87 per cent of UK
rivers, and half of all UK lakes are at risk from diffuse pollution; and it has become the
limiting factor preventing further water quality improvements (Environment Agency, 2007).
Diffuse Pollution in urban areas has also come under increasing scrutiny, with the EA
reporting in 2005 that one in seven urban rivers were of poor or bad chemical and biological
quality. Primarily the pollution from urban areas can be attributed to two main sources:
1. Contamination from Combined Sewer Overflows (CSOs), leaky sewers, cross connections
and WWTWs discharges.
2. Surface wash off from highways, industrial, residential and other land uses associated with urban areas.
1
13
There a wide range of pollutants observed from these sources, but typically they include
heavy metals, suspended solids, nutrients, hydrocarbons as well as faecal contamination, and
a range of other contaminants specific to the land use of the drained area.
The introduction of three new pieces of legislation in the UK in the last decade has presented
a clear and pressing case to address urban diffuse pollution (UDP) within UK towns and
cities, this legislation is:-
the Water Framework Directive (WFD)
the Flood and Water Management Act (FWMA)
the Revised Bathing Water Directive (RBWD)
To explore this further, a proposal to identify and treat UDP was developed. The EA were
approached and they concurred that there was a clear need to undertake such a study. With
input from the EA, and through analysis of historical EA sample data the River Douglas
which flows through the town of Wigan, was identified as a suitable study area.
Wigan was identified as a suitable study area for several reasons. Firstly, the upper course of
the river was failing to meet several WFD water quality criteria, and secondly, the river’s
catchment has a wide mixture of land use including a substantial urban area as well as
agricultural pasture and woodland. The Douglas is a tributary of the river Ribble, which
discharges into the North Sea on the Fylde coast. Kay et.al, (2005) identified that half of the
sewerage inputs to the Ribble basin are associated with the relatively small Douglas
sub-catchment. The mixture of pollution inputs in Wigan are representative of the typical
problems faced in many post-industrial towns and cities across the UK. Therefore it was felt
that data and findings produced from the study would be applicable and relevant to address
UDP in other similar waterbodies.
1.1 Knowledge Gap
With the increasing importance of addressing diffuse pollution evident, it is crucial that
research is undertaken to investigate both its causes and solutions to mitigate its effects.
Before the introduction of the WFD there was little or no legislation which sought to address
the problems posed by UDP, therefore a fresh approach by regulatory authorities to river
14
investigating UDP and how to quantify and treat it. UDP is difficult to assess due to the
episodic nature of polluting events, and the diffuse nature of sources are difficult to identify
specifically. Existing estimates of UDP are very likely to be inaccurate when considering that
the monitoring systems for urban water courses currently in place fail to take account of this
episodic nature of pollution (J. Bryan Ellis and Mitchell, 2006).
Through an extensive literature review into the subject area surrounding the problem of
diffuse pollution (Chapter 2), it is clear that it is a multidisciplinary problem requiring clear
understanding of several different knowledge areas which include river chemistry and
ecology, water sampling methodology, the physical mechanics of surface water wash off and
sediment transport, as well as that of legislation and policy in relation to water quality and
flooding. Therefore the review has collated and analysed a wide series of papers from
multiple fields to produce a thorough and holistic view of the subject area. The review has
identified a series of gaps in existing knowledge and highlighted a series of key problems
with current approaches to the subject. These include:-
Difficulties around identifying the contribution of diffuse sources;
Unsuitable existing sampling regimes to identify diffuse pollution;
A lack of data on the water quality performance of SuDS and PTS;
A lack of consensus on the significance of the first flush effect;
Significant barriers to the retrofit of SuDS and PTS in urban environments.
These problems are covered in detail in the literature review and summarised in section 2.6
and they indicate that there is a clear and pressing need to identify the sources and mitigate
the impacts of UDP in UK Rivers; however given the complex nature of the overall problem
this presents significant challenges. They also highlight a shortage of data available on the
performance and effectiveness of different treatment solutions in the field.
1.2 Project Objectives
When considering these issues (section 1.1), it is clear there is a need to increase knowledge
and understanding of UDP and its treatment. This PhD project aims to fill this gap in
knowledge by setting and investigating the following objectives:-
1 To identify a suitable riverine study area and develop a micro level sampling regime
15
2 To use collected sample data to observe pollutants in the river channel, identify those
subject to the greatest fluctuation during storm events. This sample data will be used
to indicate those which are most significant in terms of diffuse sources, as well as
identifying any other trends that are apparent.
3 Using collected sample data, and other available information, to identify a series of
locations for the installation of suitable SuDS or PTS in order to provide mitigation of
the pollutants observed in the river monitoring.
4 Undertake monitoring of installed mitigation measures to assess their performance in
respect to water quality improvement. The collected data will then be used to estimate
the volume of pollutants discharged from each of the monitored sources.
1.3 Original Research
To provide answers to these questions it was necessary to undertake an original study.
Although, as it will be shown in the literature review, previous studies have addressed some
aspects of the overall problem of UDP, this is the first study to attempt an holistic approach
addressing all the variables in real time trials of Hydrodynamic Vortex Seperators (HDVSs)
in the field. This is certainly the case from a UK perspective. Specifically the novel aspects
of the work completed in this thesis can be summarised as follows:-
Use of a micro level sampling regime (multiple sample points across a small
catchment) to monitor water pollution fluctuation accurately over short distances.
Clear quantification of the contribution of diffuse pollution during a series of recorded
rainfall events
Completing real time monitoring of two off the shelf HDVS retrofitted to an existing
drainage infrastructure using automatically triggered auto sampling units.
Through this new approach it was anticipated that insights would be gained into the
suitability of existing sample regimes and water quality data to accurately quantify the
contribution of diffuse pollution and to identify where improvements are needed in the
16
1.4 Methodology Summary
To address these objectives the work completed for this PhD has been undertaken in several
stages, as set out below:-
Project Background and Development
River Water Quality Sampling and Assessment o Develop and Complete a Sample Regime
o Analysis of River Sample Data
Treatment System Monitoring and Sampling
o Selection of Treatment Systems and Locations
o Monitoring of Treatment Systems
o Analysis of Monitoring Data
Preliminary analytical work consisted of developing the research question as well as the
project objectives and a literature review (Chapter 2). This work focused on identifying gaps
in the literature, as well as developing a viable project that would yield sufficient new
primary data. During this stage the EA were successfully approached to collaborate on the
project.
The river water quality sampling commenced with selection of the River Douglas as a study
area and the development of a holistic and extensive sample regime to be applied at the micro
level. The purpose of the sampling programme was to identify the key pollutants in the river
and to highlight those which contribute most significantly as diffuse pollutants. Samples were
collected at 25 locations over a 4 month period between July and October 2012. Water
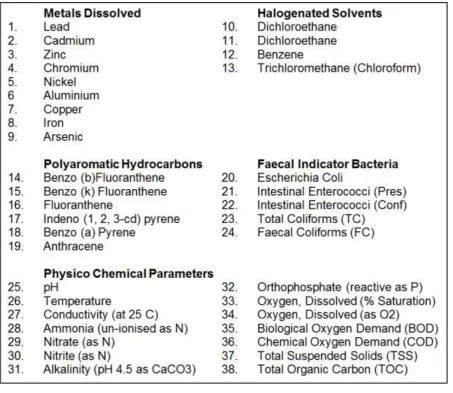
samples were tested at EA laboratories for a wide spectrum of pollutants comprising 37
different variables, including nutrients, faecal bacteria indicators (FIOs), polyaromatic
hydrocarbons (PAHs) and heavy metals. Supplementary rainfall and discharge data was used
to further support analysis.
Following the characterisation of river pollutants, the study went on to investigate the
different methods available to remediate them. Off-the-shelf proprietary water treatment
(PTS) systems and products were utilised over SuDS due to their space saving properties, in
the context of retrofitting treatment capacity to the confined urban study area. Informed by
17
selected and paired with existing drainage assets (such as surface water drains (SWD) and
road drainage assets) where PTS could be installed to provide treatment of storm runoff and
discharges. Drainage Assets were selected through a mixture of analysis of river sample data,
the use of the local water company asset register and other practical considerations.
Construction drawings were created for the construction design management process and the
EA appointed a contractor to install the PTS. Budgetary limitations meant that only 4 of the 7
originally planned sites and their associated PTS were progressed to completion. With
construction work completed the PTS were monitored to assess their performance.
Automated sampling equipment was utilised to undertake storm monitoring at some sites
whereas others were monitored by observing the accumulated weight of captured pollutants
on an annual basis. The exact method of monitoring differed between products and more
specific details for each are given in the methodology Chapter. The results obtained from
monitoring enabled the removal efficiency of each product system to be calculated.
Parts of the work that were undertaken for this PhD were completed in partnership with the
EA. Principally the EA provided a project management role, funding for all stages of the
project as well as access to computer systems and laboratory resources. All data collection
and analysis supporting this thesis was completed primarily by the student with some
technical instrumentation and sample methodology support being supplied by the EA. The
student also provided significant input to the construction design management process,
including background research into which PTS were suitable to utilise, selection of sites to
install them, development of all AutoCAD designs (under supervision), contractor
appointment and liaising on site with the contractor on site during in product installation.
1.5 PhD Structure
This document provides a review of the literature in the subject area, it explains the
methodology used, gives details of results collected and their analysis and makes a series of
proposals for both river water management and further research work. The work completed is
18
Chapter 1 provides an overview of the project and explains the knowledge gap that exists
around the effect of the urban land cover on river water quality. It also states the project
objectives, summarises the methodology and gives an overview of the report structure.
Chapter 2 goes on to make a critical review of relevant literature concerned with diffuse
pollution and its relevance to this study. It is divided into four main sub-sections:-
Legislative background
Catchment Management and Land Use
UDP
Urban Storm water treatment
Chapter 3 describes the methodology undertaken. It gives full details about the type of
sampling; testing and analysis that was undertaken to identify pollution sources in the River
Douglas. A detailed explanation of the range of mitigation methods identified to treat
pollutants follows, including the criteria for selecting sites, drainage assets and the individual
products that were used. The necessary design work completed which allowed the contractor
to install products is also described as well as the methods used to monitor each installation.
Chapter 4 provides a full analysis and discussion of the results. This is divided into two parts
to reflect the two phases of the project work. The first explains the results generated from the
river sampling and the second contains the results from PTS monitoring. It also gives full
details of the analysis completed to assess the UDP in the river Douglas. Secondly it presents
the results from monitoring completed to assess the effectiveness of the different PTS
products selected for application in the project.
Finally, Chapter 5 summarises the findings of this project and draws conclusions from the
analysis of the data collected. It gives recommendations for the improvement and control of
19
20
2
Chapter 2 – Literature Review
In the introduction gaps in current knowledge and understanding around diffuse pollution
were identified. In particular it was observed that the current regulatory framework which
seeks to quantify and mitigate diffuse pollution in an urban context certainly fails to take
account of the episodic nature of pollution from diffuse sources. This indicates the need for
further research to better understand the contribution of diffuse pollution to rivers and to
investigate methods and systems that are available to provide mitigation of this pollution. The
work undertaken on this project therefore spans several different disciplines and subject areas
that relate to this problem which constitutes a large body of relevant literature. To deal with
this effectively the Chapter is divided into four main topics, which are:-
1. Legislative background to Urban Diffuse Pollution;
2. Catchment Management and Land Use;
3. Urban Diffuse Pollution;
4. Urban Storm Water Management.
2.1 Legislative Background to Urban Diffuse Pollution
Legislation in the UK has helped increase awareness and action over the problem of surface
water runoff polluting rivers and lakes. After defining UDP this section explains the laws and
mechanisms put in place by three key pieces of legislation: the Water Framework Directive,
The Revised Bathing Water Directive and The Flood and Water Management Act. The issue
of UDP is complex and understanding the nature of the problem is key to addressing it. In the
absence of a statutory definition in England and Wales B. J. D'Arcy et al. (2000) defines it as:
“Pollution arising from land-use activities (urban and rural) that are dispersed across a
catchment, or sub-catchment, and do not arise as a process effluent, municipal sewerage
effluent, or an effluent discharge from farm buildings”
D’Arcy’s report on the Environmental and Economic Impacts of Diffuse Pollution in the
UK, also provides a useful insight for regulators observing that diffuse pollution sources are
“scattered, discrete or dispersed inputs of contaminants which are collectively significant, but
which regulatory agencies either could not or would not wish to try and control with
discharge consents” (B. J. D'Arcy et al., 2000). The Scottish Environmental Protection
21
“….the release of potential pollutants from a range of activities that individually may have
no effect on the water environment, but at the scale of a catchment can have a significant
impact (i.e. reduction in water quality, decrease in wildlife, etc.)….” (SEPA, 2012a).
Applying these concepts in the urban environment, diffuse pollution may be more accurately
defined as:-
“the contamination of rainfall and subsequently runoff, by interaction with deposited
materials on urban surfaces and areas, which individually may not be significant but
collectively lead to contamination and subsequent degradation the aquatic environment of
receiving waters”.
This is the working definition used in this project.
As urban diffuse pollution is a complex and multidisciplinary problem there is currently no
single piece of legislation which addresses it. Holistic environmental management is
increasingly a key objective of government policy, with decision making taking account of
ecological, social and economic values (Jakeman and Letcher, 2003). However although
integrated sustainable catchment management of which addressing urban diffuse pollution is
a crucial part, it is still not being achieved in the UK (Macleod et al., 2007). Schemes to
address flood risk and water quality are completed independently of each other with one
rarely taking much more than superficial consideration of the other. Nevertheless, there is
still significant existing legislation which obligates UK authorities to take account of diffuse
pollution both in urban and rural situations. The following paragraphs provide a brief
historical review of development of UK legislation affecting water quality before focusing on
the three of the most important current pieces of legislation, which are: The Water
Framework Directive (WFD, 2000/60/EC), The Revised Bathing Water Directive (RBWD
2006/7/EC) and The Flood and Water Management Act (FWMA, 2010/DEFRA).
Historically the main driver behind improving water quality and preventing pollution was the
protection of human health from infectious diseases such as cholera. Even before John Snow
demonstrated in 1854 that the prevailing theory that disease and fever were spread
miasmically was incorrect and established germ theory, legislation to protect public health
was being introduced (Rosenthal, 2014). Had reforms such as the Public Health Act (1848)
22
achieved. In reality the 1848 Act resulted in degradation in river quality as it saw the
introduction of a large scale water carriage system and piped sewerage discharges. As there
was no reliable treatment available and no demand from agriculture to use the resulting
liquefied effluent the only other option was for disposal to river courses (Rosenthal, 2014).
The construction of reservoirs throughout the 19th Century provided major improvements to
water supplies; however it was only in the latter part of the 20th century that it can be
considered environmental concern over river water quality became a mainstream
consideration. This is reflected in the legislation introduced during this period; particularly
the Rivers (Prevention of Pollution) Act of 1951which made it an offense to cause pollution
to a river, with new discharges having to achieve certain standards. However existing
discharges were exempt and it wasn’t until the act was updated in 1961 that this was rectified.
In 1963 the Water Resources Act was passed creating ‘River Authorities’ who became
responsible for enforcing law in relation to river pollution, water resources, land drainage,
fisheries and water space recreation. The Act also regulated the abstraction and impounding
of water resources on a regional basis. This was the beginning of river basin management
(Porter, 1978).
The scope of legislation was increased and consolidated throughout this period eventually
spread over 20 separate acts, and much of the substantive law remained unchanged until the
1990’s legislation regarding water quality and pollution. The 1991 Water Resources Act
consolidated water resources legislation but water quality improvement objectives were also
a key feature with several sections directly concerned with this. Section 82.4 required the
introduction by the secretary of state of a classification system for the water bodies and for
the EA to enforce the water quality standards set in the act and ensure that controlled waters
have their quality objectives maintained. Section 85 of the 1991 Water Resources Act placed
a statutory requirement for each discharge of sewerage or trade effluent made directly into
surface water to have a discharge consent obtained from the EA. It also made polluting
controlled water an offence (Department of Environment Transport and the Regions, 1991).
Several other sections of the act outline preventative measures and precautions against
pollution entering controlled rivers, including the creation of water protection zones free from
pesticides and other potential pollutants as well as the creation of Nitrate sensitive areas with
23
practice for agriculture promoted river water quality improvement through encouragement of
good farming practices. Another key target of this act was to protect areas where Nitrate
levels were likely to breach the 50mg/l limit set by the earlier EC Drinking Water Directive
(80/778/EEC) and this target highlights the importance of the link between river water quality
and drinking water quality (Department of Environment Transport and the Regions, 1991). In
many parts of the UK river water abstraction for drinking water supply is an essential source
for water companies, so protection of supplies against contamination from diffuse sources is
important. The 1991 Water Resources Act was introduced shortly after the 1989 Water Act
which saw the privatisation of the water supply and treatment section of the ten publicly
owned regional water authorities, with regulatory responsibility being transferred to the
National Rivers Authority which was soon to be renamed the Environment Agency by the
1995 Environment Act.
Up to this point legislation was focused towards control of point discharges, and although the
importance of diffuse inputs from agriculture was beginning to be recognised, the
contribution of diffuse inputs from urban sources was still not really considered. In addition
the objectives outlined in the 1991 Water Resources Act were ‘use-led’ (Helmer and
Hespanhol, 1997) and, whilst the act identifies the importance of diffuse agricultural
pollutants such as nutrients and pesticides, the appreciation of the importance of management
at catchment level, was still absent. A focus on just one portion of the watershed has limited
effectiveness and the weakness of this approach has been documented (Born and Sonzogni,
1995). It is evident in many cases, that management of water resources has been focused on
physical control of water and the associated economic implications, leading to ecological
issues becoming subservient (Jakeman and Letcher, 2003).
The introduction of the WFD in 2000 (2000/60/EC) characterised the next stage of
environmental policy evolution, emphasising that protection of public health and protection
of the environment are synergistic, requiring a mixture of approaches beyond simple
‘‘end-of-pipe’’ solutions to encompass preventative and integrated management. The concept that
restoration of the natural conditions of a river catchment can have a beneficial impact upon
multiple management objectives has steadily gained momentum and become more accepted
since the introduction of the WFD. This has seen the introduction of national legislation to
implement the WFD, designed to more sensitively manage catchment areas through control
24
2.1.1 Water Framework Directive
The introduction in June 2000 of the WFD was the culmination of three and half years of
institutional negotiation and debate. Setting a common approach and goals for the
management of water in 27 countries (15 member states (MS) and 12 pre-accession countries,
which have since become MS) (WFD; 2000/60/EC); its introduction indicates an
understanding that previous less integrated and disconnected management was not delivering
required environmental improvements (Kallis and Butler, 2001). It gives clear evidence that
managing rivers at a catchment level has moved into mainstream thinking and that when
catchment management activity is conducted correctly it can achieve multiple benefits
(European Commission, 2000). Provisions set in earlier directives are integrated within the
WFD, allowing them to be gradually repealed (Macleod et al., 2007).
The WFD also introduces new standards, criteria, institutions and processes which shift
management of Europe’s rivers towards an integrated ecosystem based approach (Kallis and
Butler, 2001). While the WFD does not define or make specific reference to UDP, Article II
specifies that identification and quantification of diffuse sources needs to be undertaken, with
Articles IV and VII requiring the development of a program of measures to be laid out in a
River Basin Management Plan (European Commission, 2000).
2.1.1.1 Responsibilities of Member States under the WFD
The WFD introduces a number of important changes, especially with respect to institutions
and planning processes. Activities need to be co-ordinated at a geographical/administrative
level of the “river basin district”. Basins must be designated along with competent authorities
who are responsible for them. A River Basin Management Plan must be produced by
authorities every 6 years and cover:-
1. A description and maps of the catchment;
2. Identification and mapping of protected areas;
3. Identification and mapping monitoring networks;
4. Identification and assessment of significant pressure on the aquatic environment (including,
estimation of point and diffuse pollution, summary of land use, estimation of abstractions);
5. Economic analysis of the cost of water;
6. A summary of the measures taken to achieve goals and comply with exiting legislation and
25
The directive requires monitoring of progress, with a progress report at the end of each 6 year
period detailing the implementation of improvement measures and the recording of
achievements and goals along with detailed mapped data from monitoring. Plans are required
to be reviewed and revised as necessary for the following 6 year period (European
Commission, 2000).
2.1.1.2 Implementation of the WFD in Member States
As well as the appointment of competent authorities and the development of River Basin
Management Plan, the primary duty of member states (MS) is to comply with the
environmental objectives laid out in articles IV, V and VI of the directive. The WFD
classifies water bodies as surface waters, ground waters and protected areas. The obligations
of MS for each of these defined water bodies varies slightly, but largely this means they must
ensure that there is no further deterioration of water quality and implement a number of
measures intended to reduce and phase out pollutants. In addition states must establish a
register of all protected areas.
Each River Basin Management Plan has a series of basic measures required to conform to the
directive; firstly this means implementation of the other relevant legislation for water
protection such as the Integrated Pollution Prevention and Control Directive (IPPC,
2008/1/EC), Urban Waste Water Treatment Directive (UWWTD, 91/271/EC) and the
Drinking Water Directive (DWD, 98/83/EC). If fulfilment of the terms of these various acts
fails to ensure receiving waters achieve ‘good’ status as defined by the directive then further
supplementary measures may be required.
These supplementary measures include additional pollution control measures consisting of
emission limit values and recipient quality standards with the more stringent being applied to
any point source not covered by the IPPC directive. At the time of publication there are no
enforceable regulations covering diffuse discharges or sources. However in the UK a range of
best management practice advice and associated schemes have been developed to help
mitigate the contribution from diffuse sources to pollution of receiving waters. One of these
schemes is the Catchment Sensitive Farming Delivery Initiative; a national policy which aims
to address diffuse water pollution from agriculture in rivers, groundwater and other water
sources. It is being run by the EA in coordination with Natural England and with funding
26
which provides funding for improvements under the Catchment Sensitive Farming Delivery
Initiative (CSF Evidence Team, 2011; Natural England, 2011).
In Scotland the Sustainable Land Management Incentive Scheme is a programme run by
Scottish Water which aims to mitigate the effects of diffuse pollution by offering financial
incentives to land owners and farmers and to provide advice and technical support in respect
of farm diffuse pollution management, installation of a biobeds (soil and straw lined pits to
collect pesticide washings), stock fencing and livestock watering. The aim of this scheme is
to improve river quality and thus reduce water treatment costs (Morris, 2013).
The Sustainable Catchment Management Programme is an example of one scheme in
England run by United Utilities and the RSPB. Its key objectives are improvements to water
quality in respect of colour and sediment load, mitigation of downstream flooding issues and
enhancement of biodiversity. This has been achieved by a series of measures which included
large scale blocking of moorland drains (grips), re-vegetation of bare and exposed peat and
degraded blanket bog and introduction of more sustainable management of grazing
(Anderson, 2010).
In urban areas there are no schemes offering financial incentives to reduce pollutant runoff.
Also there are no examples of action taken at a wider scale with efforts only being directed at
a local level and primarily being concerned with flood mitigation rather than water quality.
This probably reflects the greater number of vested interests in urban areas and the associated
difficulty in achieving consensus between land owners. However there are examples of note,
such as the work completed by the Council in Lambeth in 2011-12 where green roofs,
highway soakaways and filter trenches as well as rain gardens in communal green spaces
have been constructed, although again this was aimed at reducing flooding rather than surface
water quality (Stovin et al., 2013).
2.1.1.3 The EQS Classification System
The EQS Directive (section 2.1.4.3) is utilised by the EA to classify UK surface and coastal
waters under the WFD. There is no specific method of determining sample locations for
routine EQS sampling, where catchments are divided into separate waterbodies and sample
location selected to be the most representative for the whole of each waterbody. This is
27
additional sample points are added in tributaries. However there is no specific requirement
that governs the distance between sample locations where operational, surveillance and
investigational monitoring is undertaken by the EA.
Operational and surveillance sample locations are fixed, and see the collection of all
biological (collected triennially), hydro morphological and physio-chemical (collected
annually) elements. Investigational monitoring is used to collect further samples in different
locations when water quality concerns are observed, or to monitor the impact of pollution
incidents. As stated in section 2.1.4.3, the requirements of the EQS and Priority Substances
(PS) Directives are transposed into UK law by the ‘River Basin Districts Typology, Standards
and Groundwater threshold values (Water Framework Directive) (England and Wales)
Directions 2010’. Parts 3-6 of this document contain limits for the various substances listed
within the directives. For each of the different parts, samples intervals are: monthly for part 3
and 5 substances and quarterly for part 4 and 6 substances. An automated scheduling system
programs sampling runs, so samples can be taken on any day of the week within working
hours, although sampling is spread evenly across the year to account for seasonal variation.
The EA operational instruction 034_08 “Routine environmental monitoring in rivers
supporting information for chemistry” covers much of this detail (Anon, 2014). As mentioned
above the vast majority of sample locations are fixed but the document states that for diffuse
inputs, an appropriate sampling network will be determined by the EA national office,
although no further detail on how this is to be done is provided. From the guidance offered in
this document the sample point located within a defined ‘waterbody’ is considered to be
representative of its water quality.
The actual process of classifying a waterbody under the WFD has several stages. The
physio-chemical quality elements for surface water are covered by parts three to six of the ‘River
Basin Districts Typology, Standards and Groundwater threshold values Directions 2010’.
Using collected samples, defined water bodies can then be classified to a certain ‘status’,
which are: high, good, moderate, poor or bad for quality elements under ‘part 3’ of the WFD.
For most other elements listed under parts 4, 5 and 6 a pass/fail criteria against an annual
average or 95th percentile value is defined. To classify quality elements in ‘part 3’ a further
classification of a site is required, based on the altitude of a site and the average alkalinity (in
28
alkalinity having more stringent standards. For some quality elements listed under ‘part 5’
standards are also expressed as maximum allowable concentrations (MACs) that are
permissible in single samples. This details the method of river site classification; there are
further steps to complete for lake, coastal and transitional site classification.
2.1.2 The Revised Bathing Water Directive
The Revised Bathing Water Directive (RBWD 2006/7/EC) came into force on the 24th of
March 2006, to supersede the previous directive (BWD 76/160/EC CEC, 1976). The RBWD
is a daughter directive of the WFD, and Annex VI of the WFD includes areas covered by the
RBWD which require competent authorities in MS to limit concentrations of indicator
bacteria in bathing waters, through a combination of point and diffuse source control.
The RBWD has several goals, but the main ones of interest here are to:
Deliver a more scientific based approach to health and environmental protection as well as environmental management.
Deliver more accurate and timely information to citizens about the quality of bathing
waters.
Integrate bathing water protection with other EU measures which seek to protect and
improve other water bodies and sources, through progression from simple sampling
and monitoring schemes to a more integrated management programme for bathing
waters.
Although introduced in 2006 the RBWD will not be fully enforced until 2015 due to the
transitional period to allow member states time to implement new requirements. The RBWD
significantly simplifies the classification of bathing waters cutting the 19 water quality
parameters specified in the previous BWD, to an assessment of just two FIOs, i.e.,
Escherichia coli (E.coli) and Intestinal Enterococci (IE). These parameters allow the
classification of the quality of bathing waters, through the monitoring of bacterial levels in
collected water samples. Another purpose of the transitional period of the directive is to allow
member states to build-up data sets for all bathing water sites, as assessments require a
comparable data set which covers a consecutive 4 year period for both FIO parameters.
Water bodies controlled by the directive will be classified into 4 different groups using the
29
Excellent (approximately twice as stringent as the current Excellent Guideline
standard);
Good (similar to the current good guideline);
Sufficient (approximately twice as stringent as the current mandatory standard)
Poor, for waters which do not comply with the Directive’s standards.
The classification of each bathing water site is then calculated taking the 95 and 90 percentile
of each data set. All MS should ensure that all bathing waters attain a minimum quality
threshold of “sufficient”, at the latest by the end of the 2015 season. For sites classified as “poor”, MS should take measures such as the provision of information to the public, banning
of bathing or advising against it and the implementation of suitable corrective measures.
After the collection of the initial 4 year data set in the transitional period MS must continue to
monitor bathing waters on an annual basis during the bathing water season, which varies
between MS (in the UK the bathing water season is between May and September). A
minimum of four water samples should be provided in a bathing water season (subject to
short seasons or special geographic constraints) and intervals between samples should be no
greater than one month apart.
Member states should also produce ‘profiles’ for bathing water sites which give a description
of the site, details of the potential threats and impacts to water quality such as sources of
pollution and the location of water quality monitoring points. Profiles are meant to provide
information to citizens and to function as a management tool for responsible authorities.
Profiles had to be produced by 2011.
The EC and the EEA publishes an annual summary report on bathing water quality, based on
the reports that all MS submit at the start of each bathing season. The EU wide report is
produced in both paper and electronic formats whereas reports from individual MS are only
required to be available electronically. Member States are also required under the RBWD to
ensure that during the bathing water season timely information is disseminated to the public
in relation to bathing water quality. Specifically this should include easily identifiable notices
and signs advising against, or banning bathing, as necessary. From June 2008 interactive
30
water quality in individual bathing areas became available at the Water Europe website:
www.water.europa.eu (European Commission, 2006).
The vast majority of bathing water sites are coastal, so the RBWD is not primarily concerned
with inland river water quality. However due to the often significant volumes of faecal
contamination released via rivers into estuaries, it is important to address faecal
contamination in rivers, in order to ensure there is no degrading effect in estuarine bathing
waters. A good example of this is detailed by both Kay et al. (2005) and Wither et al. (2005)
who identified significant bacterial contamination from the River Douglas into the Ribble
estuary and although it accounted for only 8% of the total discharge volume, it contributed
over 60% of the Faecal Coliform load during both base and high flows.
This contribution from catchments indicates a clear driver for improved reduction of the
contribution from urban sources, such as, outdated waste water treatment works, leaky CSOs
and polluted surface water outfalls. Rural and poorly managed agricultural sources also need
to be tackled, such as, private package sewerage treatment works, incorrect live stocking in
riparian zones, livestock sheds which drain directly to rivers, etc. This clearly indicates a
need for greater integration between different policy mechanisms and the science base that
supports them to help achieve effective sustainable catchment management (Macleod et al.,
2007).
2.1.3 Flood and Water Management Act
In 2010 the FWMA legislation was introduced primarily as a response to the 2007 review by
Sir Michael Pitt into the widespread flooding in the UK of that year, which was largely
caused by surface water runoff inundating poorly maintained drainage networks and systems
(M. Pitt, 2007). The FWMA is concerned with improving the management of flood risk in the
UK, providing improved protection for consumer’s water supplies as well as protection of
surface water drainage discharges. It also gives the EA the lead responsibility for
development of a national flood and coastal risk management strategy whilst also giving local
authorities the duty as Lead Local Flood Authorities to co-ordinate local flood risk
management (Coulthard and Frostick, 2010; Department for Environment Food and Rural
31
While not primarily concerned with achieving improvements in urban water quality the act
does include a requirement for sustainable drainage of surface water in developments which
require planning permission, or which have drainage implications. This requirement is
outlined in schedule 3 of the act, the introduction of which has remained subject to continual
delays. This also removes the automatic right, which was established by the water industry
act, to connect to public sewers and it was intended to move the responsibility for granting
permission for connection to local authorities SuDS approval boards who were to assess
proposed SuDS against a new national standard which has yet to be published. These
standards will detail the design, construction, operation and on-going maintenance of SuDS
and consider runoff destinations, peak flow rates, and anticipated runoff volumes from
developments as well as water quality considerations (Flood and Water Management Act,
2010).
Some details are still not known but it is likely that developments and projects not requiring
planning consent and covering less than 100m2 will be excluded from the requirements. The
provisions were initially proposed to be phased in over 3 years and at first to cover only
major developments. Once fully implemented this schedule of the FWMA has the potential to
provide a significant river water quality benefit, though not only through the provision of
treatment capacity of SuDS such as filter strips, swales and infiltration trenches etc., but also
the removal of surface water loading of foul sewers reducing their spill frequency into rivers.
However implementation of schedule 3 has been subject to on-going consultations by the
Department for Communities and Local Government (DCLG). Originally set to be introduced
in January 2014, it was announced in early January 2015 that it is to be implemented from 6th
April 2015, when responsibility for its implementation is to be handed to local authority
planning departments with the creation of SuDS Approval Boards scrapped (DCLG, 2014).
2.1.4 Other Legislation
The other overlapping regulations which are also important when considering diffuse
pollution and river water quality are explained below.
2.1.4.1 The Urban Waste Water Treatment Directive
The Urban Waste Water Treatment Directive (91/271/EC) addresses the collection, treatment
and discharge of urban waste water and the treatment and discharge of waste water from
32
cause by the discharge of urban waste water. Annex II of the directive requires MS to
produce a regularly updated list of both sensitive and less sensitive areas which receive
treated waters. The degree to which urban waste water is required to be treated varies
depending upon the sensitivity of the receiving water.
The directive was required to be implemented by December, 2005 when MS should have
ensured that all discharges of urban waste water into non sensitive waters (those with
bacterial population equivalent concentrations between 2000 and 15000 colony-forming units
(cfu)) and for sensitive receiving waters (concentrations between 2000 and 10000 cfu) must
have a connection to a treatment system. Monitoring of WWTWs and discharges is the
responsibility of each MS and competent national authorities are required to publish a
situation report every 2 years (UWWTD, 91/271/EEC).
The UWWTD in conjunction with the RBWD are the drivers for the on-going improvement
of CSOs and other urban outfalls contaminated with wastewater from cross connections and
other sources of FIO contamination. The introduction of the UWWTD led to a major upgrade
programme for the 6000 estimated CSOs identified in the UK. This improvement is achieved
through the identification of Unsatisfactory Intermittent Discharges by the EA and the
subsequent improvement or replacement under the asset management plan of the water
company in ownership of the asset (Myerscough and Digman, 2008).
Although the directive was introduced over 15 years ago, the issue of sewerage waste water
discharge, primarily from CSOs, during storm events remains an on-going issue. As recently
as October 2012 the Court of Justice of the European Union determined that the UK had
breached the UWWDT, as a result of storm water overflows. The court concluded that the
UK had not demonstrated through the use of best practice and while not incurring excessive
costs, that measures to prevent the illegal discharges (CSOs) were technically impossible
(Stovin et al., 2013). The directive was also a driver for the introduction of biological water
quality assessments alongside chemical assessments, and assessments of macro invertebrates