R E S E A R C H
Open Access
A systematic screen reveals new elements acting
at the G2/M cell cycle control
Francisco J Navarro
1*and Paul Nurse
1,2,3Abstract
Background:The major cell cycle control acting at the G2 to mitosis transition is triggered in all eukaryotes by cyclin-dependent kinases (CDKs). In the fission yeastSchizosaccharomyces pombethe activation of the G2/M CDK is regulated primarily by dephosphorylation of the conserved residue Tyr15 in response to the stress-nutritional response and cell geometry sensing pathways. To obtain a more complete view of the G2/M control we have screened systematically for gene deletions that advance cells prematurely into mitosis.
Results:A screen of 82% of fission yeast non-essential genes, comprising approximately 3,000 gene deletion mutants, identified 18 genes that act negatively at mitotic entry, 7 of which have not been previously described as cell cycle regulators. Eleven of the 18 genes function through the stress response and cell geometry sensing pathways, both of which act through CDK Tyr15 phosphorylation, and 4 of the remaining genes regulate the G2/M transition by inputs from hitherto unknown pathways. Three genes act independently of CDK Tyr15
phosphorylation and define additional uncharacterized molecular control mechanisms.
Conclusions:Despite extensive investigation of the G2/M control, our work has revealed new components of characterized pathways that regulate CDK Tyr15 phosphorylation and new components of novel mechanisms controlling mitotic entry.
Background
An important aspect of the eukaryotic cell cycle control is the co-ordination of cell cycle progression with the growth of the cell. The investigation of this problem, extensively studied in the yeasts Saccharomyces
cerevi-siae and Schizosaccharomyces pombe, elucidated the
basic molecular mechanisms of cell cycle control, which in many aspects are common to all eukaryotes. Genetic studies in the yeasts revealed that this co-ordination occurs at both the G1/S and the G2/M transitions, with G1/S being the major point of control for S. cerevisiae and G2/M forS. pombe [1,2]. Useful mutants for defin-ing genes involved in the rate limitdefin-ing steps of these transitions are those that advance cells prematurely into cell division, resulting in cells with a smaller cell size than normal [3,4]. The first of these mutants in fission yeast, wee1-50, was defective in a protein kinase that phosphorylates Tyr15 of the cyclin-dependent kinase
(CDK) Cdc2 [5,6]. Phosphorylation of this conserved residue inhibits the CDK, and its dephosphorylation by the phosphatase Cdc25 activates the CDK and triggers mitosis [7-9]. This posttranslational modification is the major rate-limiting control of mitotic onset in fission yeast. Two pathways, the mitogen-activated protein kinases stress-nutritional response (SR) and the cell geo-metry sensing (CGS) pathways, regulate Tyr15 phos-phorylation upstream of Wee1 and Cdc25 [10-15]. The SR pathway connects the nutrient-responding target of rapamycin (TOR) pathway to the recruitment of Polo kinase to the spindle pole body and CDK activation [15,16]. This pathway is responsible for nutritional mod-ulation of mitotic entry. The other pathway that con-trols mitotic entry is formed by the Cdr1 and Cdr2 kinases, which regulate Wee1 activity in response to cell geometry, and involves a gradient of the protein kinase Pom1 along the long axis of the cell [13,14,17].
Tyr15 phosphorylation is considered the major regula-tory mechanism of the G2/M transition in fission yeast. However, the observation that cells driven by a simpli-fied cell cycle system lacking this control are still able to * Correspondence: [email protected]
1
Cell Cycle Lab. Cancer Research UK-London Research Institute, Lincoln’s Inn Fields 44, London WC2A 3LY, UK
Full list of author information is available at the end of the article
divide and coordinate cell division with mass increase suggests the existence of additional regulatory mechan-isms [18]. The availability of near genome-wide collec-tions of gene delecollec-tions provides an exceptional tool for systematically identifying components of the pathways that regulate the G2/M transition.
In this work we have screened theS. pombegene dele-tion collecdele-tion for mutants that prematurely enter into mitosis. We found 18 genes that function as negative regulators of mitosis, 7 of which have not been asso-ciated with cell cycle control before. Further analysis of these mutants identified putative new elements that reg-ulate the G2/M transition acting upstream of the SR and CGS pathways. Additionally, we found genes that regulate the G2/M transition independently of Tyr15 phosphorylation, defining new rate limiting controls for mitotic entry. Therefore, our work provides a more complete view of the regulatory mechanisms acting at the G2/M transition.
Results and discussion
Systematic screen for small cell size mutants
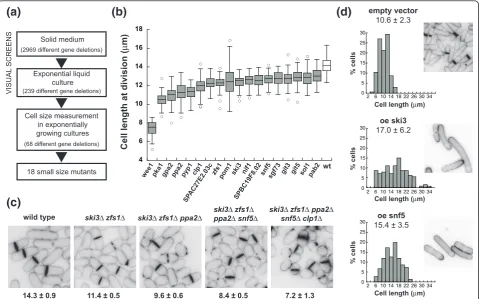
Given the importance of the G2/M transition for cell cycle control, we have screened a near genome-wide fis-sion yeast gene deletion collection [19] to search sys-tematically for gene deletion mutants that divide prematurely, with the objectives of characterizing more comprehensively the components and mechanisms act-ing in a negative manner at the G2/M control.
We screened 82% of all fission yeast non-essential genes for mutants dividing prematurely at a small cell size, but with minimal effects on growth to avoid muta-tions influencing cell size indirectly [20]. The screening procedure is summarized in Figure 1a and consisted of an initial microscopic visual screen followed by length and width measurements at cell division of candidate mutants (see Material and methods). Fission yeast cells grow by linear extension and therefore cell length corre-lates with cell volume, facilitating the identification of a relatively subtle size phenotype. We identified 18 mutants that divided at least 1 μ;m shorter than the wild-type strain, which, under the growth conditions used, divided at a length of 14.1 μ;m (Figure 1b; Table 1; Additional file 1; Figure S1 in Additional file 2). We confirmed that cell volume, calculated from length and width at division, was also reduced in the selected mutants (Table 1). The smallest mutant found was wee1Δ, which divided at 7.4 μ;m, around half the cell length of the control strain. The rest of the mutants divided with cell lengths of 75 to 93% of the control strain. In the course of our screen we also observed mutants with significant heterogeneity in cell size at division due to the presence of longer cells. Because these long cells could have arisen from a transient arrest
of the cell cycle or delayed mitosis, they were not stu-died further.
All mutants grew with doubling times essentially simi-lar to wild type (Table 1), except for the wee1Δ and gpa2Δstrains, with doubling times 66% and 40% longer than the wild-type strain. All mutants showed cell cycle phase distributions similar to the wild-type strain (Fig-ure S2 in Additional file 2) except for the wee1Δ mutant, which had an extended G1 phase as previously noted [21]. Deletions of five other genes (ypa2, SPAC227.01c, sft1, cpp1 and Lac1) showed cell sizes smaller than wild type but were not analyzed any further because of their sick and slow growing phenotype.
All 18 genes identified are conserved across eukar-yotes and most can be grouped into four categories based on their biological functions: (1) regulation of the G2/M CDK activity and cytokinesis (wee1, clp1, pom1, nif1, ppa2,pyp1); (2) glucose sensing/cAMP signaling pathway (pka1, gpa2, git5, git3); (3) mRNA metabolism (zfs1,ski3,pab2); and (4) chromatin structure (snf5,sol1, sgf73). Other genes not found in these categories were SPAC27E2.03c and SPBC19F8.02, with unknown func-tions. Eleven of the genes identified have been pre-viously reported to be involved in the G2/M control, validating our screen. We cannot give an estimate of the false negative rate of our screen, but it is informative that all gene deletions reported previously to signifi-cantly reduce cell size that were present in the set of mutants we screened were found in our study. Our list of mutants does not include several other loss-of-func-tion mutaloss-of-func-tions previously reported to divide at a small cell size. This was because these other mutant strains did not divide at a sufficiently small cell volume to attain the cutoff we used in our growth conditions (YE4S media, 32°C; Table S2 in Additional file 2). Inter-estingly, we found seven genes for which the small size phenotype has not been previously described; ski3,snf5,
sol1, sgf73, pab2, SPBC19F8.02 and SPAC27E2.03c
(Tables 1 and 2).
yeast genes that result in small size when deleted, and 23 were contained in the set of mutant strains screened. Only four (GPA2/gpa2, SWE1/wee1, SCH9/sck2 and
SLT2/pmk1) genes passed to the liquid screen and
finally onlyGPA2/gpa2and SWE1/wee1showed a signif-icant small cell size phenotype in both yeasts. Interest-ingly, none of the genes identified in our study are directly involved in ribosome biogenesis, which was the major pathway represented in the small size mutants found by Jorgensen et al. [22]. This was not because of a low representation of‘ribosome biogenesis’annotated genes in our set of mutant strains, since approximately a third of all S. pombe genes annotated to this Gene Ontology category were present in this set (103 out of 325). The absence of genes involved in ribosome bio-genesis from our list of small size mutants could be due to the different strategies used for coordinating cell
division with growth in the two organisms, which in budding yeast occurs at G1/S while in fission yeast is usually at G2/M [2]. It is possible that the G1/S control could be more sensitive to the ribosome biogenesis than the G2/M control. It is also possible that the small size phenotype of the budding yeast ribosome biogenesis gene mutants results as a response of the cell to the reduction in the growth rate in these mutants rather than to a direct involvement of these genes in cell mass-cell cycle coordination.
Most of the identified mutations had only modest effects on cell size, but we found that combining differ-ent mutations reduced cell length further. The quintuple mutantski3Δzfs1Δppa2Δsnf5Δclp1Δdivided with a cell length of 7.2μ;m, 50% smaller than the wild type (Figure 1c). The additive interaction between mutations regarding cell size suggests that these genes define
(b)
4 6 8 10 12 14 16 18
Cell length at division (
μ
m)
wt
pka1
wee1 gpa2 ppa2 pyp1 clp1 zfs1
SPAC27E2.03c
pom1ski3 nif1 snf5
SPBC19F8.02
sgf73git3 git5 sol1 pab2
(a)
VISUAL
SCREENS
(2969 different gene deletions)
Solid medium
(239 different gene deletions)
Exponential liquid culture
(68 different gene deletions)
Cell size measurement in exponentially growing cultures
18 small size mutants
(c)
(d)
oe ski3 17.0 ± 6.2
Cell length (μm)
% cells
0 5 10 15 20 25 30
2 6 10 14 18 22 26 30 34
oe snf5 15.4 ± 3.5
Cell length (μm)
% cells
0 5 10 15 20 25 30
2 6 10 14 18 22 26 30 34
Cell length (μm)
empty vector 10.6 ± 2.3
% cells
0 5 10 15 20 25 30
2 6 10 14 18 22 26 30 34
wild type
14.3 ± 0.9 11.4 ± 0.5
ski3Δ zfs1Δ ski3Δ zfs1Δ ppa2Δ
9.6 ± 0.6
ski3Δ zfs1Δ
ppa2Δ snf5Δ
8.4 ± 0.5
ski3Δ zfs1Δ ppa2Δ
snf5Δ clp1Δ
[image:3.595.59.539.89.388.2]7.2 ± 1.3
different pathways regulating the G2/M transition. Furthermore, the heterozygous diploid strainski3+/ski3Δ zfs1+/zfs1Δ ppa2+/ppa2Δsnf5+/snf5Δ clp1+/clp1Δ was 23% smaller than the control diploid strain (16.6 μ;m
[image:4.595.57.540.101.443.2]versus 21.4 μ;m), establishing that these genes have a quantitative effect on the G2/M transition. Additionally, it has been reported before that an increase in the levels of Wee1, Pka1, Ppa2, Pyp1, Clp1, Pom1 and Nif1 caused Table 1 Small size mutants identified in the genome-wide screen in fission yeast
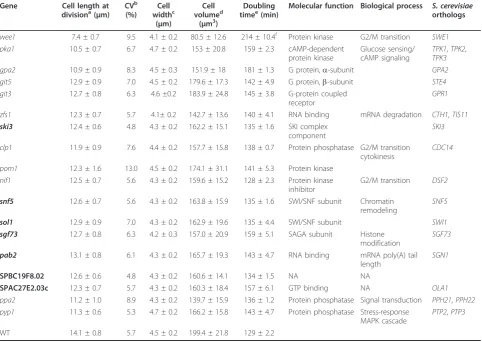
Gene Cell length at divisiona(μm)
CVb (%)
Cell widthc
(μm)
Cell volumed
(μm3)
Doubling timee(min)
Molecular function Biological process S. cerevisiae orthologs
wee1 7.4 ± 0.7 9.5 4.1 ± 0.2 80.5 ± 12.6 214 ± 10.4f Protein kinase G2/M transition SWE1 pka1 10.5 ± 0.7 6.7 4.7 ± 0.2 153 ± 20.8 159 ± 2.3 cAMP-dependent
protein kinase
Glucose sensing/ cAMP signaling
TPK1,TPK2, TPK3 gpa2 10.9 ± 0.9 8.3 4.5 ± 0.3 151.9 ± 18 181 ± 1.3 G protein,a-subunit GPA2 git5 12.9 ± 0.9 7.0 4.5 ± 0.2 179.6 ± 17.3 142 ± 4.9 G protein,b-subunit STE4 git3 12.7 ± 0.8 6.3 4.6 ±0.2 183.9 ± 24.8 145 ± 3.8 G-protein coupled
receptor
GPR1
zfs1 12.3 ± 0.7 5.7 4.1± 0.2 142.7 ± 13.6 140 ± 4.1 RNA binding mRNA degradation CTH1,TIS11 ski3 12.4 ± 0.6 4.8 4.3 ± 0.2 162.2 ± 15.1 135 ± 1.6 SKI complex
component
SKI3
clp1 11.9 ± 0.9 7.6 4.4 ± 0.2 157.7 ± 15.8 138 ± 0.7 Protein phosphatase G2/M transition cytokinesis
CDC14
pom1 12.3 ± 1.6 13.0 4.5 ± 0.2 174.1 ± 31.1 141 ± 5.3 Protein kinase nif1 12.5 ± 0.7 5.6 4.3 ± 0.2 159.6 ± 15.2 128 ± 2.3 Protein kinase
inhibitor
G2/M transition DSF2
snf5 12.6 ± 0.7 5.6 4.3 ± 0.2 163.8 ± 15.9 135 ± 1.6 SWI/SNF subunit Chromatin remodeling
SNF5
sol1 12.9 ± 0.9 7.0 4.3 ± 0.2 162.9 ± 19.6 135 ± 4.4 SWI/SNF subunit SWI1 sgf73 12.7 ± 0.8 6.3 4.2 ± 0.3 157.0 ± 20.9 159 ± 5.1 SAGA subunit Histone
modification
SGF73
pab2 13.1 ± 0.8 6.1 4.3 ± 0.2 165.7 ± 19.3 143 ± 4.7 RNA binding mRNA poly(A) tail length
SGN1
SPBC19F8.02 12.6 ± 0.6 4.8 4.3 ± 0.2 160.6 ± 14.1 134 ± 1.5 NA NA
SPAC27E2.03c 12.3 ± 0.7 5.7 4.3 ± 0.2 160.3 ± 18.4 157 ± 6.1 GTP binding NA OLA1 ppa2 11.2 ± 1.0 8.9 4.3 ± 0.2 139.7 ± 15.9 136 ± 1.2 Protein phosphatase Signal transduction PPH21,PPH22 pyp1 11.3 ± 0.6 5.3 4.7 ± 0.2 166.2 ± 15.8 143 ± 4.7 Protein phosphatase Stress-response
MAPK cascade
PTP2,PTP3
WT 14.1 ± 0.8 5.7 4.5 ± 0.2 199.4 ± 21.8 129 ± 2.2
Genes in bold are those that have not been previously implicated in cell cycle control.a
Mean ± standard deviation (SD), n = 60.b
Coefficient of variance.c
Cell width was measured at the center of the cell. Mean values ± SD (n = 60).d
Cell volume was estimated assumingS. pombecell shape as a cylinder topped with two hemispheres (V = (4/3) ×π× (Width/2)3
+π× (Width/2)2
× (Length - Width)). Mean values ± SD (n = 60).e
Mean ± standard error (n = 3).f
The doubling time forwee1Δwas longer than that reported for the temperature sensitivewee1-50mutant at restrictive temperature [3]. This is likely due to the accumulation of diploid cells and cells with aberrant septa in the deletion mutant. MAPK, mitogen-activated protein kinase; NA, not available.
Table 2 Function of the genes identified on the G2/M control
Through CDK Tyr15 phosphorylation Independent of
Upstream Sty1 Upstream Cdr1 Upstream Sty1, Cdr1 CDK Tyr15 phosphorylation Not determined
wee1 pyp1 pom1 nif1 snf5 ppa2
clp1 gpa2 ski3 sol1 sgf73
pka1 zfs1
git3 git5 pab2
SPAC27E2.03c SPBC19F8.02
[image:4.595.57.541.582.707.2]cell elongation, which is a sign of mitotic delay or arrest [5,14,24-28]. We tested whether the overexpression of any of the remaining genes identified in our screen (SPAC27E2.03c,zfs1, ski3, SPBC19F8.02, snf5,sgf73,sol1 and pab2) also caused cell elongation, and found that overexpression of ski3 and snf5significantly increased cell size (Figure 1d), establishing that they act as gene dosage-dependent regulators of the G2/M transition.
Novel elements of regulatory pathways of the G2/M transition
We next investigated if the genes identified encoded components of the upstream pathways that regulate the activation of the G2/M CDK. For example, Pom1 and Pyp1 are respectively components of the CGS and the SR pathways [10,13,14]. We examined genetic
interactions with the regulators Sty1 and Cdr1, which act at the base of each respective pathway (Figure 2a; Table S4 in Additional file 2). The plot in Figure 2a graphically summarizes our results. The sgf73Δ gene deletion in both cdr1Δ and sty1Δbackgrounds (Table S4 in Additional file 2), or in a double mutant cdr1Δ sty1Δ(Figure S3 in Additional file 2), reduced growth rate dramatically and resulted in cells with cytokinesis defects, so this gene was excluded from this analysis. All the remaining double mutants showed cell lengths similar to or smaller than cdr1Δ and sty1Δ single mutants. Approximately half the mutations tested (8 out of 17) did not reduce cell length of the sty1Δ mutant, indicating that the factors encoded by these genes function upstream of Sty1. This group is made up of Pyp1, Pab2, SPAC27E2.03c, SPBC19F8.02 and
additive phenotype non-additive phenotype
snf5
sol1clp1snf5zfs1
ppa2
sol1
clp1
0.7 0.8 0.9 1.0 1.1
0.7 0.8 0.9 1.0 1.1 pom1
SPBC19F8.02
pab2 git5 git3 pka1
pyp1
SPAC27E2.03c gpa2
ppa2 sol1
nif1 snf5
clp1 ski3
zfs1
Interaction with sty1Δ
hti
w
n
oit
ca
re
t
nI
1r
dc
Δ
(a)
(b)
(c)
(d)
ppa2 Δ
sol1 Δ snf5
Δ clp1
Δ zfs1
Δ
-
-sty1Δ cdr1Δ
(
n
oi
si
vi
d t
a
ht
g
nel ll
e
C
μ
)
m p<10-7
16 18 20 22 24 26 28 30
nif1 Δ
ski3 Δ
% cells
Cell length at division (μm) wt 14.3 ± 1.0
cdr1Δsty1Δ
22.6 ± 1.7
0 10 20 30 40 50
11 13 15 17 19 21 23 25 27 29
0 10 20 30 40 50
11 13 15 17 19 21 23 25 27 29
[image:5.595.58.536.303.632.2]% cells
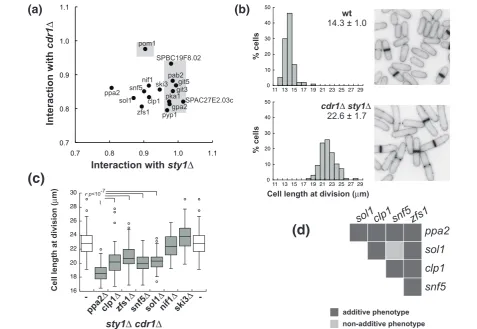
Figure 2Small size mutants are defective in the signaling of different G2/M regulatory pathways.(a)Genetic interactions between identified mutations and thecdr1andsty1genes. Horizontal axis represents the ratio of cell length at division of the double mutant of each identified mutation in combination withsty1Δover the singlesty1Δmutant. The vertical axis represents the cell length ratio of the double mutant withcdr1Δover the singlecdr1Δmutant cell length. Shaded areas indicate genes that showed interaction with eithersty1Δorcdr1Δ.(b)
factors involved in glucose sensing-signaling, Git3, Git5, Gpa2 and Pka1. A connection between the glu-cose sensing/cAMP signaling pathway and Sty1 has previously been noted [29-31] and our work addition-ally establishes a key role for glucose sensing in the activation of the CDK. Conversely, all deletions reduced the size of the cdr1Δ strain except forpom1Δ as previously shown [13,14], indicating that Pom1 is the only component of the CGS pathway in our set of mutants. Interestingly, we also show that Nif1, which physically interacts with and inhibits Cdr1 [28], also appears to have a Cdr1-independent role in the G2/M transition.
The fact that a group of gene deletions (ppa2Δ,sol1Δ, snf5Δ, zfs1Δ, clp1Δ,ski3Δ, nif1Δ) reduced the cell size of both thesty1Δand cdr1Δstrains indicated that these genes have roles in the G2/M control independently of these two pathways. To confirm the additive phenotype to both the sty1 and cdr1 gene deletions, we deleted these genes in a sty1Δcdr1Δstrain. The double sty1Δ cdr1Δ mutant was viable and divided with a larger size than any of the parental mutants (Figure 2b; Table S5 in Additional file 2). Neither the ski3 nor nif1 deletion reduced cell length at division of the cdr1Δ sty1Δ mutant, suggesting that Ski3 and Nif1 function upstream of both Cdr1 and Sty1.
The ppa2, sol1, snf5, zfs1 and clp1 gene deletions reduced cell length at division of the sty1Δ cdr1Δ mutant (Figure 2c; Table S5 and Figure S4 in Additional file 2), confirming that their function in the G2/M is independent of both Sty1 and Cdr1. We investigated the genetic interactions within this group of genes (Figure 2d; Table S6 in Additional file 2) and found that, in all cases, mutants carrying pairs of deletions were smaller than the parental single mutant strains, with the one exception of the double mutantsnf5Δsol1Δ, which was similar to thesnf5Δalone. The additive genetic interac-tions within this group suggest that these genes function in different pathways. The non-additive snf5Δ sol1Δ result is consistent with the fact that Snf5 and Sol1 pro-teins are two subunits of the same complex [32]. Dele-tion of snf22, which encodes the ATPase subunit of this complex (not present in the deletions screened), also showed an advanced mitosis phenotype similar to the snf5Δandsol1Δmutants (cell length at division 12.7 ± 0.6μ;m), confirming a role of the SWI/SNF complex in the G2/M control.
This analysis has revealed new components in the G2/ M control that function upstream of Sty1 (Pab2, SPAC27E2.03c and SPBC19F8.02), has shown that Ski3 and Nif1 function through both Cdr1 and Sty1, and has identified other elements that function in the G2/M transition independently of the CGS and SR pathways (Ppa2, Sol1, Snf5, Zfs1 and Clp1).
Tyr15 phosphorylation-independent regulation of the G2/ M transition
We next investigated howppa2,sol1, snf5,zfs1andclp1 act at the G2/M transition. It is known that Clp1 regu-lates Cdc25 stability and consequently CDK Tyr15 phos-phorylation [33,34]. We tested if the other genes of this group also had a role in Tyr15 phosphorylation or in other aspects of CDK activation. We first analyzed if CDK protein levels were altered. It is known that co-overexpression of the mitotic cyclin Cdc13 and CDK Cdc2 advances cells into mitosis [35]. However, the levels of Cdc13 and Cdc2 proteins determined both by western blot (Figure 3a) and by single cell fluorescence-activated cell sorting (FACS) analysis (Figure 3b) in the ppa2Δ, snf5Δ and zfs1Δ mutants, and in the double mutant snf5Δzfs1Δwere similar to or lower than in the control strain. Therefore, the mitotic advancement observed in these mutants cannot be the result of an increase in CDK protein level. We also tested if the effects of these genes on the G2/M transition involve the CDK stoichiometric inhibitor Rum1, which inhibits the CDK during G1 [36,37]. Mutants carrying the rum1 deletion and thezfs1,ppa2 orsnf5deletions were viable, and the lengths at division were similar to the corre-sponding single mutants (Figure 3c). Therefore, the effects ofsnf5,zfs1and ppa2on the G2/M transition do not act through Rum1.
Finally, we investigated if these genes alter the phos-phorylation levels of Cdc2 at residue Tyr15. The levels of phosphorylated Cdc2 in ppa2Δ, snf5Δ,zfs1Δand the double mutant snf5Δ zfs1Δ were similar to those in the wild-type strain (Figure 3a), suggesting a role in the G2/ M transition independent of Tyr15 phosphorylation reg-ulation. To further support this observation, we tested if the effect of these gene deletions was also observed in a background containing a non-phosphorylatable Cdc2 mutant protein. We used a strain expressing a mutant Thr14Ala Tyr15Phe Cdc2 kinase (Thr14 is occasionally phosphorylated [38]) fused to the cyclin Cdc13, which is well tolerated by the cell [18] contrary to the non-fused mutant CDK [8]. Cells with this Cdc13-L-Cdc2 fusion protein have a wild-type doubling time, cell length and cell cycle distribution. In agreement with the roles of the SR and CGS pathways regulating the G2/M transition through CDK Tyr15 phosphorylation, the non-phosphorylatable CDK fusion protein and not the wild-type fusion protein specifically abolished most of the effects on mitotic onset ofsty1 andcdr1gene dele-tions (Figure 3d; Table S7 and Figure S5 in Additional file 2), establishing that this system can be used for test-ing if Snf5, Sol1, Ppa2 and Zfs1 act on the G2/M con-trol through CDK Tyr15 phosphorylation. We deleted these genes individually in strains with Cdc13-L-Cdc2
Deletions reduced cell length at division of the strain carrying the Cdc13-L-Cdc2 fusion protein in a similar way to that observed in the wild-type background (Fig-ure 3d, upper panel; Table S7 and Fig(Fig-ure S6a in Addi-tional file 2). The deletion of ppa2 in the Cdc13-L-(T14A Y15F)Cdc2 background rendered cells inviable, similar to the lethal phenotype of the double mutant wee1-50 ppa2Δat restrictive temperature [25]. We mea-sured cell length at division of the remaining viable strains and found that cells harboring these deletions were shorter than the control strain, although the CDK could not be phosphorylated on Tyr15 (Figure 3d, bot-tom panel; Table S7 and Figure S6b in Additional file 2). The snf5Δand sol1Δdeletions were not additive in the Cdc13-L-(T14A Y15F)Cdc2 background, while snf5Δ and zfs1Δ were additive, reducing cell length by 23%. These results show that the premature mitosis of snf5Δ, sol1Δand zfs1Δmutants is independent of Tyr15 phosphorylation and establishes that there must be additional regulatory mechanisms acting at the G2/M transition.
This systematic screen of more than 80% of fission yeast non-essential genes has identified a significant proportion of the genes acting negatively at the G2/M transition. The 18 genes identified are listed in Table 2 together with their connection to the G2/M control. We found that most of these genes function through CDK Tyr15 phosphorylation. Eight of these genes function upstream ofsty1, and of these, three,pab2, SPAC27E2.03c and SPBC19F8.02, are described here for the first time as negative regulators of mitotic onset and define new components of the SR path-way. Only one gene,pom1, acts solely in the CGS pathway. However, our data indicate thatski3andnif1function in both the SR and CGS pathways, suggesting a cross-talk between these two pathways previously thought to act independently.
We found thatsnf5,sol1,zfs1,ppa2andclp1function independently of both sty1andcdr1, and thatsnf5,sol1 and zfs1 act on mitotic onset independently of CDK Tyr15 phosphorylation. The advanced mitotic phenotype of their deletions, described for first time for snf5 and sol1, was not due to changes in CDK protein level or
(b)
(a)
Cdc13
Atb2
snf5 Δ
zfs1 Δ
WT
zfs1
Δ snf5
Δ ppa2
Δ
Cdc2 Tyr15-P
(c)
8 10 12 14 16 18
rum1 + ¨ + ¨ + ¨ + ¨
snf5Δ zfs1Δ
WT ppa2Δ
Cell length at division (
μ
m)
(d)
( )
Cdc2-YFP200 300 400
FL1-H
100 200 300 400 500 FSC-H
snf5Δ
zfs1Δ
WT zfs1Δ snf5Δ
ppa2Δ
+
+
+ +
160
0 40 80 120
100 200 300 400 500
FL1-H
FSC-H
Cdc13-YFP
8 12 16 20 24 28
Cell length at division (
μ
m)
snf5 Δ
zfs1 Δ
WT sol1
Δ ppa2
Δ cdr1
Δ sty1
Δ WT
Cdc13-L-Cdc2
4 8 12 16 20 24
Cell length at division (
μ
m) Cdc13-L-(T14A Y15F)Cdc2
snf5 Δ
zfs1 Δ
WT sol1
Δ ppa2
Δ cdr1
Δ sty1
Δ WT
zfs1
Δ snf5
Δ
sol1
Δ snf5
Δ
p<10-12
[image:7.595.57.538.87.373.2]Lethal
Rum1 deregulation, indicating that they represent com-ponents of uncharacterized rate-limiting controls acting at the G2/M transition. We suggest that the lethality of ppa2Δ when combined with the Tyr15 mutant CDK could be due to a role in the G2/M transition also inde-pendent of Tyr15 phosphorylation. These proteins could be involved in regulating the dephosphorylation of CDK substrates given that, in Xenopus laevis eggs, PP2A phosphatase controls cell cycle progression by counter-acting the CDK-dependent phosphorylation of mitotic substrates [39], and inS. cerevisiae, Cdc14 (homolog of Clp1) dephosphorylates CDK substrates [40]. Alterna-tively, these proteins could function in some other way on CDK targets or could inhibit the CDK by unknown regulatory pathways. However, they would not be expected to have a role in the assembly of the CDK complexes given they still exert effects in the presence of the fusion protein Cdc13-L-Cdc2 (Figure 3d; Table S7 and Figure S6b in Additional file 2). Alternatively, these proteins might be involved in the cellular localiza-tion of the complex and their absence could facilitate access of the CDK to its substrates. Another possibility is that these proteins are involved in an as yet uncharac-terized posttranslational modification of the CDK. The elucidation of the molecular details of the mechanism of action of these proteins on the G2/M transition will require further study.
Conclusions
Much emphasis has been put on Cdc2 Tyr phosphoryla-tion as the regulatory mechanism that ensures the coor-dination between cell growth and cell division. However, the fact that a synthetic CDK lacking the regulatory phosphorylation site still exhibits a significant degree of cell size homeostasis [18] argues strongly for the exis-tence of other layers of regulation. Furthermore, we have shown here regulation of mitotic onset without involving CDK Tyr15 phosphorylation. Our work has identified new components of characterized pathways and has revealed the existence of new regulatory mechanisms, and therefore provides a more complete view of the regulatory network of G2/M control.
Materials and methods
Strains and growth conditions
S. pombemedia and methods are described in Morenoet
al. [41]. Strains used are listed in Table S8 in Additional file 2. Experiments were carried out in yeast extract com-plex media supplemented with 0.15 mg/ml L-Histidine, L-Leucine, Adenine and Uridine (YE4S) at 32°C.
Screen for small size mutants
The viable set of a near genome-wideS. pombe haploid deletion collection [19] was screened for mutants that
divide prematurely with a smaller size than the wild-type strain. In total, we screened the cell size phenowild-type of 2,969 different gene deletions (82% of fission yeast non-essential genes). Our strategy consisted of an initial microscopic visual screen of mutants growing on agar plates of complex media (YE4S) followed by measure-ments of cell size at division of candidate mutants grow-ing exponentially in liquid culture. Mutant strains were arrayed in 96-well plates and 150 μ;l of YE4S per well was inoculated and incubated at 32°C for >16 h with shaking. We then inoculated a solid YE4S media plate using a pin tool and incubated this plate for 12 to 20 h until small colonies (40 to 60 cells) formed. Each mutant strain was inoculated in quadruplicate and was compared with the control strain PN558 (ade6-M210
leu1-32 ura4-D18 h+) growing in the same plate. The
visual screen for cell size phenotypes was carried out using a Zeiss Axioskop 40 microscope equipped with a 20×/0.4 NA objective and an additional 1.8× magnifica-tion. From this first screen, we selected 239 different mutant strains for a second screen in liquid culture, in which growth conditions were better controlled. Candi-date mutants were grown in individual flasks containing 15 ml of YE4S media at 32°C, and cell size was screened when the culture was growing in exponential phase (0.35 to 0.45 OD595). Cell wall and septum were stained with Blankophor (1:100,000; MP Biochemicals, Solon, OH, USA) and cells were observed with a Zeiss Axios-kop microscope, equipped with a QICam Fast camera and using a 63×/1.4 NA objective. We selected 68 mutant strains selected at this stage, which were grown again under the same conditions, and the width and length of dividing cells measured from pictures. We selected mutants that divided at least 1 μ;m shorter in cell length than the control strain. Wide mutants that showed reduced cell length but wild-type volume were discarded as these mutants are altered in morphology rather than in the control of the cell cycle. Finally, mutants were backcrossed with the wild-type strain to confirm the co-segregation of the phenotype with the deletion marker and to remove auxotrophies, and the specificity of the gene deletion was verified by PCR. Genes in our set of small size mutants were deleted for more than 91% of the ORF [19]. Cell size phenotypes of the new small size mutants identified in our screen have been annotated in PomBase [42].
width values were determined from 60 to 150 cells, and comparison between strains was done using a two-tailed unpaired Student’s t-test. In box-and-whisker plots, boxes are delimited by the first quartile, median and third quartile, and whiskers mark maximum and mini-mum values within a range of up to 1.5 standard devia-tions. Values outside this range are displayed as individual dots.
Gene deletion and overexpression
Gene deletion was performed as in [43]. Gene targeting oligos were designed using the tool‘Gene deletion’from the Bähler Lab web site [44]. Overexpression of genes was done using the multicopy plasmid REP3X under the thiamine-repressible nmt1 gene promoter [45]. ORFs were amplified by PCR with specific oligos carrying restriction enzyme sites for cloning into REP3X. In over-expression experiments, cells were grown in synthetic media (EMM) containing 5 μ;g/ml thiamine and expres-sion of the gene was induced upon thiamine removal by filtration and incubation in thiamine-free medium for 20 h.
Protein extracts and western blots
Total protein extracts were prepared from 108 cells, col-lected by centrifugation and resuspended in the same volume of HB buffer (60 mMb-glycerol phosphate, 15 mM MgCl2, 15 mM EGTA, 1% (v/v) Triton X-100, 150 mM NaCl, 25 mM MOPS-NaOH pH7.2), containing protease inhibitor (1 mM phenylmethylsulfonyl fluoride (PMSF and Roche Complete Mini protease inhibitor cocktail) and phosphatase inhibitors (Roche PhosStop, Roche, Indianapolis, IN, USA). Cell suspensions were boiled for 5 minutes, and then transferred to a tube containing 1.2 ml of glass beads (0.4 mm; Sigma, St Louis, MO, USA). Cells were disrupted in a FastPrep cell disruptor (ThermoSavant, Waltham, MA, USA) for 3 × 20 s. HB buffer plus inhibitors (50 μ;l) was added and the crude extract was recovered and mixed with 5× sample buffer (20% (v/v) b-mercaptoethanol, 20% (w/v) SDS, 0.05% (w/v) bromophenol blue, 25% (v/v) glycerol, 300 mM Tris-HCl pH6.8). Finally, extracts were boiled for 5 minutes and centrifuged at 13,000 rpm for 1 min-ute. In western blots, Cdc13 was probed with rabbit polyclonal SP4 antibody [9] (1:3,000); Cdc2 with com-mercial rabbit polyclonal anti-PSTAIRE (1:250; Santa Cruz Biotech, Santa Cruz, CA, USA); phoshorylated Tyr15 Cdc2 with commercial rabbit polyclonal (1:500; Cell Signaling Technology, Danvers, MA, USA); and Atb2 with monoclonal TAT1 antibody (1:5,000; gift from K Gull [46]). Horse radish peroxidase-conjugated goat anti-mouse or goat anti-rabbit IgG (Pierce-Thermo, Waltham, MA, USA) were used at a dilution of 1:10,000 as secondary antibodies.
Flow cytometry
DNA content per cell was determined from 104cells that were fixed with 70% (v/v) ethanol and then washed with 1 ml 50 mM sodium citrate. Cells were resupended in 0.5 ml 50 mM sodium citrate containing 0.1 mg/ml RNase A and incubated at 37°C overnight. DNA was stained with 2μ;g/ml propidium iodide and samples were sonicated before analysis in a BD FACSCalibur instrument. Single cell analysis of CDK protein levels was performed from strains expressing yellow fluorescent protein (YFP)-tagged Cdc13 or Cdc2 proteins under their native pro-moters. Cells were grown in YE4S at 32°C and 1 ml of culture at 0.2 OD595(approximately 4 × 10⁶cells) was fixed with 1% (w/v) formaldehyde for 15 minutes; then cells were washed and resuspended in 1 ml phosphate-buffered saline. Cells were briefly sonicated prior to mea-suring fluorescence signal in a FACSCalibur instrument (BD Biosciences, San Jose, CA, USA) equipped with a 488 nm excitation laser and a 530 nm bandpass filter. Autofluorescence from a non-YFP tagged strain was sub-tracted from the YFP fluorescent signal.
Additional material
Additional file 1: Table S1 - strains analyzed and selected in every step of the cell size screen.
Additional file 2: Supplementary Figures S1 to S6 and Tables S2 to S8. Figures S1 and S4 to S6: histograms of cell length at division of different size mutants. Figure S2: cell cycle distributions of the small cell size mutants identified. Figure S3: photomicrographs showing the cytokinetic defects of thesgf73Δsty1Δcdr1Δtriple mutant. Table S2: loss-of-function mutations reported previously to decrease cell length at division in fission yeast. Table S3: comparison of mutants obtained in this study withS. cerevisiaesmall size mutants. Tables S4 to S7: cell length measurements of size mutants. Table S8: yeast strains used in this study.
Abbreviations
CDK: cyclin-dependent kinase; CGS: cell geometry sensing; ORF: open reading frame; PCR: polymerase chain reaction; SR: stress-nutritional response; YFP: yellow fluorescent protein.
Acknowledgements
We thank D Coudreuse, J Hayles, F Kelly, A Moldón, F Neumann, J Wu and members of the Nurse lab for critical reading of the manuscript, E Johnson for experimental support and Fred Winston (Harvard Medical School) for strains. FN was funded by postdoctoral fellowships from the Spanish Ministry of Science and Ibercaja Foundation, and PN by the Breast Cancer Research Foundation, the Anderson Cancer Research Center at The Rockefeller University, Cancer Research UK and the Wellcome Trust, UK.
Author details
1
Cell Cycle Lab. Cancer Research UK-London Research Institute, Lincoln’s Inn Fields 44, London WC2A 3LY, UK.2Laboratory of Yeast Genetics and Cell Biology, The Rockefeller University, York Avenue 1230, New York 10065, USA. 3Francis Crick Institute, Euston Road 215, London, NW1 2BE, UK.
Authors’contributions
Competing interests
The authors declare that they have no competing interests.
Received: 21 February 2012 Revised: 3 May 2012 Accepted: 24 May 2012 Published: 24 May 2012
References
1. Mitchison JM, Novak B, Sveiczer A:Size control in the cell cycle.Cell Biol Int1997,21:461-463.
2. Jorgensen P, Tyers M:How cells coordinate growth and division.Curr Biol 2004,14:1014-1027.
3. Nurse P:Genetic control of cell size at cell division in yeast.Nature1975,
256:547-551.
4. Carter BLA, Sudbery PE:Small-size mutants ofSaccharomyces cerevisiae. Genetics1980,96:561-566.
5. Russell P, Nurse P:Negative regulation of mitosis bywee1+, a gene encoding a protein kinase homolog.Cell1987,49:559-567. 6. Parker LL, Atherton-Fessler S, Piwnica-Worms H:p107wee1 is a
dual-specificity kinase that phosphorylates p34cdc2 on tyrosine 15.Proc Natl Acad Sci USA1992,89:2917-2921.
7. Russell P, Nurse P:cdc25+ functions as an inducer in the mitotic control of fission yeast.Cell1986,45:145-153.
8. Gould KL, Nurse P:Tyrosine phosphorylation of the fission yeastcdc2+ protein kinase regulates entry into mitosis.Nature1989,342:39-45. 9. Moreno S, Hayles J, Nurse P:Regulation of p34cdc2 protein kinase during
mitosis.Cell1989,58:361-372.
10. Millar JB, Buck V, Wilkinson MG:Pyp1 and Pyp2 PTPases dephosphorylate an osmosensing MAP kinase controlling cell size at division in fission yeast.Genes Dev1995,9:2117-2130.
11. Shiozaki K, Shiozaki M, Russell P:Heat stress activates fission yeast Spc1/ StyI MAPK by a MEKK-independent mechanism.Mol Biol Cell1998,
9:1339-1349.
12. Russell P, Nurse P:The mitotic inducernim1+functions in a regulatory network of protein kinase homologs controlling the initiation of mitosis. Cell1987,49:569-576.
13. Martin SG, Berthelot-Grosjean M:Polar gradients of the DYRK-family kinase Pom1 couple cell length with the cell cycle.Nature2009,
459:852-856.
14. Moseley JB, Mayeux A, Paoletti A, Nurse P:A spatial gradient coordinates cell size and mitotic entry in fission yeast.Nature2009,459:857-860. 15. Petersen J, Nurse P:TOR signalling regulates mitotic commitment
through the stress MAP kinase pathway and the Polo and Cdc2 kinases. Nat Cell Biol2007,9:1263-1272.
16. Petersen J, Hagan IM:Polo kinase links the stress pathway to cell cycle control and tip growth in fission yeast.Nature2005,435:507-512. 17. Hachet O, Berthelot-Grosjean M, Kokkoris K, Vincenzetti V, Moosbrugger J,
Martin Sophie G:A phosphorylation cycle shapes gradients of the DYRK family kinase Pom1 at the plasma membrane.Cell2011,145:1116-1128. 18. Coudreuse D, Nurse P:Driving the cell cycle with a minimal CDK control
network.Nature2010,468:1074-1079.
19. Kim D-U, Hayles J, Kim D, Wood V, Park H-O, Won M, Yoo H-S, Duhig T, Nam M, Palmer G, Han S, Jeffery L, Baek S-T, Lee H, Shim YS, Lee M, Kim L, Heo K-S, Noh EJ, Lee A-R, Jang Y-J, Chung K-S, Choi S-J, Park J-Y, Park Y, Kim HM, Park S-K, Park H-J, Kang E-J, Kim HB, Kang H-S,et al:Analysis of a genome-wide set of gene deletions in the fission yeast
Schizosaccharomyces pombe.Nat Biotechnol2010,28:617-623. 20. Fantes P, Nurse P:Control of cell size at division in fission yeast by a
growth-modulated size control over nuclear division.Exp Cell Res1977,
107:377-386.
21. Fantes PA, Nurse P:Control of the timing of cell division in fission yeast: cell size mutants reveal a second control pathway.Exp Cell Res1978,
115:317-329.
22. Jorgensen P, Nishikawa JL, Breitkreutz BJ, Tyers M:Systematic identification of pathways that couple cell growth and division in yeast.Science2002,
297:395-400.
23. Zhang J, Schneider C, Ottmers L, Rodriguez R, Day A, Markwardt J, Schneider BL:Genomic scale mutant hunt identifies cell size homeostasis genes inS. cerevisiae.Curr Biol2002,12:1992-2001.
24. Tallada VA, Daga RR, Palomeque C, Garzún A, Jimenez J:Genome-wide search ofSchizosaccharomyces pombegenes causing overexpression-mediated cell cycle defects.Yeast2002,19:1139-1151.
25. Kinoshita N, Yamano H, Niwa H, Yoshida T, Yanagida M:Negative regulation of mitosis by the fission yeast protein phosphatase ppa2. Genes Dev1993,7:1059-1071.
26. Ottilie S, Chernoff J, Hannig G, Hoffman CS, Erikson RL:The fission yeast genespyp1+andpyp2+encode protein tyrosine phosphatases that negatively regulate mitosis.Mol Cell Biol1992,12:5571-5580. 27. Trautmann S, Wolfe BA, Jorgensen P, Tyers M, Gould KL, McCollum D:
Fission yeast Clp1p phosphatase regulates G2/M transition and coordination of cytokinesis with cell cycle progression.Curr Biol2001,
11:931-940.
28. Wu L, Russell P:Nif1, a novel mitotic inhibitor inSchizosaccharomyces pombe.EMBO J1997,16:1342-1350.
29. Stettler S, Warbrick E, Prochnik S, Mackie S, Fantes P:The wis1 signal transduction pathway is required for expression of cAMP-repressed genes in fission yeast.J Cell Sci1996,109:1927-1935.
30. Kishimoto N, Yamashita I:Cyclic AMP regulates cell size of
Schizosaccharomyces pombethrough Cdc25 mitotic inducer.Yeast2000,
16:523-529.
31. Zuin A, Carmona M, Morales-Ivorra I, Gabrielli N, Vivancos AP, Ayte J, Hidalgo E:Lifespan extension by calorie restriction relies on the Sty1 MAP kinase stress pathway.EMBO J2010,29:981-991.
32. Monahan BJ, Villen J, Marguerat S, Bahler J, Gygi SP, Winston F:Fission yeast SWI/SNF and RSC complexes show compositional and functional differences from budding yeast.Nat Struct Mol Biol2008,15:873-880. 33. Esteban V, Blanco M, Cueille N, Simanis V, Moreno S, Bueno A:A role for
the Cdc14-family phosphatase Flp1p at the end of the cell cycle in controlling the rapid degradation of the mitotic inducer Cdc25p in fission yeast.J Cell Sci2004,117:2461-2468.
34. Wolfe BA, Gould KL:Fission yeast Clp1p phosphatase affects G2/M transition and mitotic exit through Cdc25p inactivation.EMBO J2004,
23:919-929.
35. Hayles J, Fisher D, Woollard A, Nurse P:Temporal order of S phase and mitosis in fission yeast is determined by the state of the p34cdc2-mitotic B cyclin complex.Cell1994,78:813-822.
36. Moreno S, Nurse P:Regulation of progression through the G1 phase of the cell cycle by therum1+ gene.Nature1994,367:236-242.
37. Correa-Bordes J, Nurse P:p25rum1 orders S phase and mitosis by acting as an inhibitor of the p34cdc2 mitotic kinase.Cell1995,83:1001-1009. 38. Den Haese GJ, Walworth N, Carr AM, Gould KL:The Wee1 protein kinase
regulates T14 phosphorylation of fission yeast Cdc2.Mol Biol Cell1995,
6:371-385.
39. Mochida S, Ikeo S, Gannon J, Hunt T:Regulated activity of PP2A-B55δis crucial for controlling entry into and exit from mitosis inXenopusegg extracts.EMBO J2009,28:2777-2785.
40. Visintin R, Craig K, Hwang ES, Prinz S, Tyers M, Amon A:The phosphatase Cdc14 triggers mitotic exit by reversal of Cdk-dependent
phosphorylation.Mol Cell1998,2:709-718.
41. Moreno S, Klar A, Nurse P:Molecular genetic analysis of fission yeast Schizosaccharomyces pombe.Methods Enzymol1991,194:795-823. 42. PomBase.[http://www.pombase.org].
43. Bähler J, Wu J-Q, Longtine MS, Shah NG, III AM, Steever AB, Wach A, Philippsen P, Pringle JR:Heterologous modules for efficient and versatile PCR-based gene targeting inSchizosaccharomyces pombe.Yeast1998,
14:943-951.
44. Bähler Lab Resources.[http://www.bahlerlab.info/resources/]. 45. Forsburg SL:Comparison ofSchizosaccharomyces pombeexpression
systems.Nucleic Acids Res1993,21:2955-2956.
46. Woods A, Sherwin T, Sasse R, MacRae TH, Baines AJ, Gull K:Definition of individual components within the cytoskeleton ofTrypanosoma brucei by a library of monoclonal antibodies.J Cell Sci1989,93:491-500.
doi:10.1186/gb-2012-13-5-r36