Synthesis and characterization of sol-gel derived
single-phase PZT nanoparticles in aqueous polyol solution
A. KHORSAND ZAK*, W. H. ABD. MAJID, M. DARROUDIa
Solid State Laboratory, Department of Physics, University of Malaya, Kuala Lumpur 50603, Malaysia.
aAdvanced Materials and Nanotechnology Laboratory, Institute of Advanced Technology (ITMA), Universiti Putra
Malaysia, 43400 UPM Serdang, Selangor, Malaysia
Lead zirconate titanate nanoparticles (PZT-NPs) were synthesized by the modified sol-gel method in aqueous poly ethylene glycol (PEG) solutions. The mixed metal alkoxide precursor was prepared by moderate refluxing using lead acetate, zirconium n-propoxide, titanium iso-propoxide and acetic acid in aqueous PEG media. The properties of PZT-NPs were studied as a function of calcination temperatures. Results from the Fourier transform infrared (FTIR), powder X-ray diffraction (XRD) and thermal analysis (TGA/DTA), indicated that the single-phase perovskite PZT-NPs were obtained after heat treatment at temperature of 650°C. The average particle size of synthesized PZT-NPs was calculated by using the Debye-Scherrer formula and was found to be around 25 nm, which was in a good agreement with the microstructures obtained performed by scanning electron microscopy (SEM) and transition electron microscopy (TEM).
(Received March 22, 2010; accepted August 12, 2010)
Keywords: PZT, Sol-gel process, X-ray diffraction
1. Introduction
Lead zirconate titanate materials, Pb(Zr,Ti)O3 (PZT), in their perovskite structure form, display unique ferro-, piezo-, pyro-, dielectric and electrooptic responses when subjected to an applied electric field, and have many potential applications [1]. In the Pb(ZrxTi1-x)O3 phase diagram, the morphotropic phase boundary between the tetragonal (Ti rich) and rhombohedral (Zr rich) phases lies in the vicinity of x=0.535 [2], with the highest dielectric constant being observed for 52 percent of the Zr atoms in the B sites of the ABO3 perovskite phase [3].
The processing of PZT powder has evolved from a conventional approach, where the oxides of the individual components were mechanically mixed, to various chemical methods, which have significantly improved the homogeneity and as a consequence the quality of the final product. In recent years, researchers have focused on the synthesis of nano-sized PZT powder particles to improve the final properties, primarily due to the better sintering at low temperature and reduction of lead loss by reducing the sintering temperature. Lead volatilization at high temperature hinders the densification process and also makes it difficult to control the composition of the final product and the reproducibility of the product with good piezoelectric properties [4].
In order to overcame the above mentioned problems, many wet-chemical routes have been developed to prepare high-quality PZT powders, such as hydrothermal [5, 6], sol-gel combustion [7-11], sol-gel co-precipitation [12], electro hydrodynamic atomization [13], ultrasonic spray combustion synthesis (USCS) [14] and sol-gel [15, 16]. The sol-gel process is the most widely used wet-chemical route to prepare PZT powders, thin films and bulks in the literature. This technique is particularly important for the
preparation of ceramic powders, since the mixing of the reagents occurs on an atomic rather than a particulate scale. This allows control over stoichiometry and is thus advantageous for the synthesis of multi-component oxides. Another advantage comes from the low processing temperatures that facilitate integration with semiconductors [17]. Many different sol-gel systems are used to synthesize PZT, with lead acetate, zirconium and titanium alkoxides used as common reagents and methoxyethanol or acetic acid used as common solvents [18,19]. In these systems, the hydrolysis and condensation reactions are sensitive to the presence of water and the humidity of the air, so it is necessary to add a stabilizing agent, such as acetyl acetone, to control the reaction process. Steven J. Milne et al. [20, 21] researched some sol-gel processes with complex polyalcohols, such as propanediol, butanediol and 1, 1, 1-trihydroxymethyl ethane, as solvents and acetylacetonate modified zirconium alkoxides and titanium alkoxides as starting reagents. They found that, in the polyalcohol system, the sensitivity of the sol-gel reaction to water and humidity was reduced, and the stable sol was easily obtained.
2. Experimental
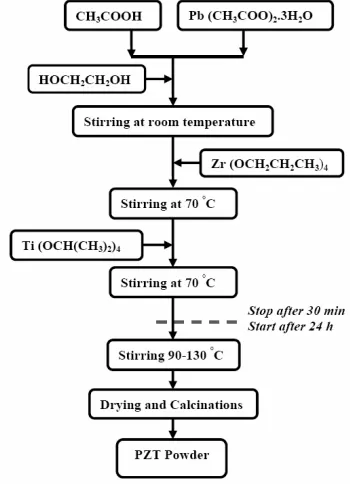
[image:2.612.317.540.297.446.2]PZT-NPs was prepared by sol-gel synthesis according to the scheme shown in Fig. 1. The ratio of material was chosen as Pb:Zr:Ti, 1:0.52:48 respectively. Lead(II) acetate trihydrate, Pb(CH3COO)2.3H2O (Aldrich, >99%), titanium isopropoxide, Ti(OCH(CH3)2)4 (Aldrich, >97%), zirconium n-propoxide, Zr(OCH2CH2CH3)4 (Aldrich, 70 wt.% in 1-propanol) and PEG (Merck, MW=600) were used as starting materials. The lead solution was prepared by dissolving lead acetate in a minimum amount of acetic acid and stirred for 30 min. 5% additional lead was added, in order to compensate for the loss of Pb in the subsequent thermal treatment. The lead solution was added to an equal volume of PEG. The solution was stirred for 15 min to achieve a homogenous solution. Then, Zirconium n-propanol was added to the solution and stirred at 70 °C for 30 min. The mixture was then cooled to ambient temperature and titanium isopropoxide was added following the same procedure, and stirring continued until a milky colored solution was obtained. The sol was placed in a closed flask for 24 hrs and then stirred at 90 °C for 1 h. Finally, the temperature of the solution was increased to 130 °C to achieve a clear yellow gel. As the process continued, the gel color gradually changed to dark brown. The temperature was increased to 300 °C for 3 days to produce a black xerogel. This xerogel was then milled by a ball milling machine to get a black dry gel powder. In order to prepare the PZT-NPs, the black powder was calcinated at different temperatures of 500, 550, 600 and 650 °C for 2 hrs, with a heating rate of 2 °C/min. The PZT-NPs obtained from the different calcination temperatures were characterized by using XRD, FTIR and SEM.
Fig. 1. Flowchart of synthesis of PZT-NPs by sol-gel method.
3. Results and discussion
3.1 FTIR Analysis
[image:2.612.97.272.450.692.2]The FTIR absorption spectra of PZT-NPs synthesized at different calcination temperatures were collected at room temperature from 4000 to 280 cm−1 (Fig. 2). In these spectra, vibration peaks of metal-oxygen bands mainly appeared in the low frequency domain, about 280–700 cm -1. The band that appeared around 343 cm-1 is attributed to the vibrations of the M-O band, and the centered shoulder around 543 cm-1 is attributed to cyclic M-O-M structure [23]. The vibration bands at 1053 and 1414 cm-1 are related to C-O bonds in the PEG structure [24]. Moreover, the band at 1582 cm-1 represents the asymmetric stretching vibrations of carboxyl groups C=O, and the bands at 810, 1414 and 3362 cm-1 are characteristic of the stretching bands of C-H. The mid band around 3362 cm-1 is attributed to the O-H groups in the matrix [25].
Fig. 2. FTIR spectra of prepared PZT-NPs at different calcination temperatures for 2 hrs; 500 (a), 550 (b),
600 (c) and 650 °C (d).
3.2 Thermal Analysis (TGA-DTA)
3.3. XRD and Phase Evaluation
[image:3.612.77.289.233.371.2]The XRD patterns of calcinated PZT-NPs at different temperatures (500-650 °C) are shown in Fig. 4. The preparation of the single PZT phase was started at calcination temperature of 550 °C with rhombohedral (R) crystal structure, and by increasing the calcination temperature to 600 °C, the rhombohedral phase was transformed to the tetragonal phase (T). The comparison of XRD results (Fig. 5) showed that the pyrocholore phase was completely removed at 650 °C and the pure perovskite phase of PZT-NPs is obtained at this temperature. This phase change can be related to quantum size effect.
[image:3.612.321.534.307.561.2]Fig. 3. Thermal analysis (TGA-DTA) of dried gel of PZT.
Fig. 4. Typical XRD patterns of prepared PZT-NPs at different calcination temperatures.
The fraction of the atoms or the molecules located at the surface on the particles plays a great role, since they are more active than those inside the solid particles because of the free hand, which leads to easy bonding with the contacting materials and causes various changes in
particle properties. the fraction of surface atoms of a 20μm cubic particle is only 0.006%, but it increases to 0.6% for a 200 nm particle and then it is estimated almost half of the atoms are situated at the surface of a 2 nm particle.
On the other hand, as the micronization of solid particles, the specific surface area increases generally in reversal proportion to the particle size. In the above-mentioned case, when the particle of 1cm is micronized to 1μm and 10nm, the specific surface area becomes ten thousand times and million times, respectively. As the increase in the specific surface area directly influences such properties like the solution and reaction rates of the particles, it is one of major reasons for the unique properties of the nanoparticles different from the bulk material together with the change in the surface properties of the particles itself. When the calcination temperature was increased the size of the PZT-NPs was increased and according to the above the structure of the particle was affected by atom of the surface [30].
Fig. 5. XRD patterns of calcinated PZT-NPs at different temperatures; 500 (a), 550 (b), 600 (c) and 650 °C (d)
for 2 hrs.
The values of the distance d between adjacent (hkl) planes were calculated from Bragg’s equation, λ=2dSinθ, while the lattice constants a, b, c, the interplanar angle φ
between the plane (h1k1l1), of spacing d1, and the plane
(h2k2l2), of spacing d2, and the cell volumes were found
[image:3.612.74.292.428.629.2]Tetragonal:
Rhombohedral:2
[image:4.612.112.499.264.410.2]
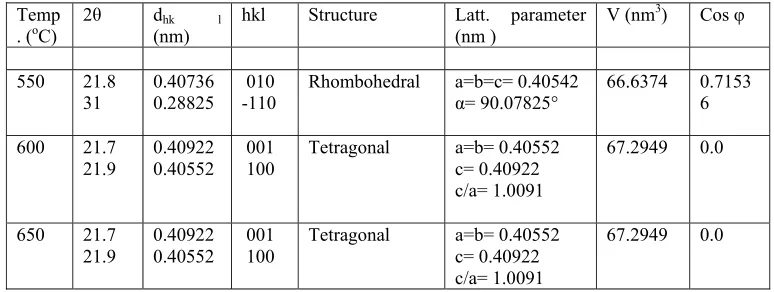
Table 1. Lattice parameters of PZT-NPs prepared at different temperatures of (b) 550, (c) 600 and (d) 650 °C for 2 hrs.
Temp
. (oC) 2θ dhk l (nm) hkl Structure Latt. (nm ) parameter V (nm
3) Cos φ
550 21.8
31 0.40736 0.28825 010 -110 Rhombohedral a=b=c= α= 90.07825°0.40542 66.6374 0.71536 600 21.7
21.9
0.40922 0.40552
001 100
Tetragonal a=b= 0.40552 c= 0.40922 c/a= 1.0091
67.2949 0.0
650 21.7
21.9 0.40922 0.40552 001 100 Tetragonal a=b= c= 0.40922 0.40552 c/a= 1.0091
67.2949 0.0
The particle sizes of nanopowders were determined by means of the X-ray line broadening method using the Debye-Scherrer equation: D=kλ/Bcosθ, where D is the particle size in nanometers, λ is the wavelength of the radiation (1.5406 A° for CuKα radiation), k is a constant equal to 0.94, B is the corrected peak width at half-maximum intensity and θ is the peak position; the positions of the (101) and (111) peaks were used for the
[image:4.612.114.499.545.732.2]tetragonal, and (-110) and (111) peaks were used for rhombohedral specimen lines [32]. It can be observed that the average particle sizes increased with increasing calcination temperatures. The main particle size was found to be about 25±2 nm for a sample that was calcinated in 650 °C and free of the pyrocholore phase. A summary of the particle sizes of PZT-NPs calcinated at different temperatures is shown in Table 2.
Table 2. Average particle size of prepared PZT-NPs at different calcination temperatures for 2 hrs; 550 (a), 600 (b) and 650 °C (c).
Temperature (oC) 2θ (degrees) FWHM (rad) Size (nm) Average size (nm)
550 31.0
38.2 7.87×10
-3
7.94×10⁻³ 19.09 19.30 19.20 ±2
600 31.0
38.3
6.25×10⁻³
6.16×10⁻³ 24.05 24.74 24.40 ±2 650 31.0
38.2 5.71×10
-3
6.02×10⁻³ 26.33 25.45 25.88 ±2 Other Works:
450 [12] 31.1 - - 35
350 [13] 27.8 - - 50
650 [14] 15.01* - - 78
800 [17] 31.5 - - 150
500 [28] 31 - - 14.5
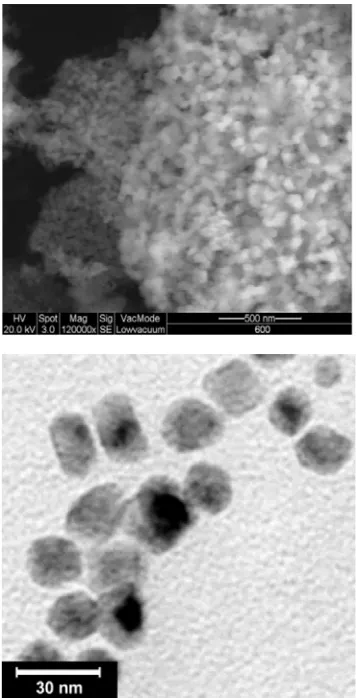
[image:5.612.96.274.221.570.2]3.4. The powder morphology
Fig. 6 shows the SEM and TEM of PZT-NPs. After calcination, the powders have similar morphologies, and they consist of small agglomerates of fine particles that were easily broken after dispersal in ethanol by ultrasonic agitation. The TEM images show that the individual particles had size ~25 nm for PZT-NPs prepared at 600 °C.
Fig. 6. SEM micrograph of the prepared PZT-NPs at different calcination temperatures of 600 (a) and 650 °C (b) for 2 hrs.
4. Conclusions
Single phase nanoparticles of PZT were successfully synthesized by the sol-gel method in aqueous polyol solution. The role of PEG in this work was as a stabilizer and control size agent for the preparation of PZT powders on the nano scale. The XRD patterns revealed that the rhombohedral-tetragonal phase transition occurred between 550 °C and 600 °C, and a single perovskite phase
was detected at 650 °C. the rhombohedral-tetragonal phase transition can be related to quantum size effect. The particle sizes of PZT-NPs, calculated from the Debye-Scherrer formula, showed that the particle size distribution was narrow and the size of the particles was about 25 nm and it is in good agreement with TEM results.
Acknowledgement
This work was supported by the University of Malaya through grant No: PS 217/2009 A.
References
[1] G. Lucovsky & M. Popescu, Non-Crystalline Materials for Optoelectronics, Optoelectronic Materials and Devices. Vol.1, 2004, Eds. INOE, Bucharest, (2004).
[2] B. Jaffe, R.S. Roth, S. Marzullo, J. Appl. Phys. 25, 809-815 (1954)
[3] K. Kakegawa, J. Mohri, T. Takahashi, H. Yamamura, S. Shirasaki, Sol. St. Com., 24, 769-772 (1977) [4] S. S. Chandratreya, R.M. Fulrath, J.A. Pask, J. Am. Ceram. Soc., 64, 422-425 (1981)
[5] H. Cheng, J. Ma, B. Zhu, Y. Cui, J. Am. Ceram. Soc., 76, 625-629 (1993)
[6] A.T. Chien, J. Sachleben, J.H. Kim, J. S. Speck, F.F. Lange, J. Mater. Res., 14, 3303-3311(1999) [7] M. Cernea, G. Montanari, C. Glassi, A.L. Casta, Nanotechnology, 17, 1731-1735 (2006)
[8] M. Ghasemifard, S.M. Hosseini, A. Khorsand Zak, Gh.H. Khorrami, Physica E, 41, 418-422 (2009) [9] N.S. Gajbhiye, P.K. Pandey, P. Smitha, Metal- Organic, and Nano-Metal chem., 37, 431-435 (2007) [10] A. Banerjee, S. Bose, Chem. Mater.,
16, 5610-5615 (2004)
[11] J. Schafer, W. Sigmund, S. Roy, F. Aldinger, J. Mater. Res., 12, 2518-2521 (1997)
[12] C. Liu, B. Zou, A.J. Rondinine, Z.J. Zhang, J. Am. Chem Soc. 123, 4344-4345 (2001)
[13] S. N. Iayasinghe, R. A. Dorey, M. J. Edirisinghe, Z.B. Luklinsha, Appl. Phys. A, 80, 723-725 (2005) [14] S. Lee, B. Jun, Ceram. Inter., 31, 53-56 (2005) [15] I. Chilibon, J. Marat-Mendes, R. Igreja, C.J. Dias, J. Optoelectron. Adv. Mater., 7, 2727-2735 (2005) [16] M. Cernea, J. Optoelectron. Adv. Mater.,
7, 3015-3022 (2005)
[17] D.G. Wang, C.Z. Chen, J. Ma, T.H. Liu, Appl. Surf. Sci., 255, 1637-1645 (2008)
[18] A. Wu, I.M. Miranda Salvado, P.M. Vilarinho, J.L. Baptista, J. Am. Ceram. Soc.,
81, 2640-2644 (1998)
[19] R. Zimmermann-Chopin , S. Auer, J. Sol-Gel Sci. Tech., 3, 101-107 (1994)
J. Am. Ceram. Soc., 79, 441-448(1996) [21] N. Sriprang, D. Kaewchinda, J.D. Kennedy, S.J. Milne, J. Am. Ceram. Soc., 83, 1914 (2000). [22] B. Pejova, R.W. Buckley, Editor, Progress in Solid State Chemistry Research, Nova Science Publishers Inc., New York, (2007).
[23] F.S. Rubia Lenza, L. Wander Vasconcelos, J. Non- Crystalline Sol., 330, 216–225 (2003).
[24] Z. De-Qing, W. Shao-Jun, S. Hong-Shan, W. Xiu-Li, C. Mao-Sheng, J. Sol-Gel Sci. Tech., 41, 157 (2007).
[25] M. Stefanescu, M. Stoia, O. Stefanescu, J. Sol-Gel Sci. Tech., 41, 71 (2007).
[26] H. Brunckova, L. Medvesky, J. Briancin, K. Saksl, Ceram. Inter., 30, 453 (2004).
[27] Y.F. Chen, R. Nass, S. Vilminot, J. of Sol-Gel Sci. and Tech., 8, 385 (1997).
[28] R. Bel H. Taher, N. Bel H. Taher, A. Ben Salah, J. Mater. Sci., 42, 9801 (2007).
[29] Y. Faheem, M. Shoaib, J. Am. Ceram. Soc., 86, 2034-2037 (2006).
[30] M. Hosokawa, K. Nogi, M. Naito, T. Yokoyama, Nanoparticle Technology Handbook, Elsevier, Amsterdam, (2007).
[31] B.D. Cullity, Elements of X-ray diffraction, Addison- Wesley Publishing Company Inc., California, (1956). [32] S. Lele, T.R. Anantharaman, Proceedings
Mathematical Sci., 64, 261-274 (1966).
_________________________