www.arpnjournals.com
DEVELOPMENT OF RED BLOOD CELL ANALYSIS
SYSTEM USING NI VISION BUILDER AI
Razali Tomari
a,
Jalil Lias
b, Rabiatuladawiah Musa
b, Wan Nurshazwani Wan Zakaria
aa
Advanced Mechatronic Research Group (ADMIRE), Faculty of Electrical and Electronic Engineering, Universiti Tun Hussein Onn Malaysia, Parit Raja Batu Pahat 86400, Malaysia,
b
Department of Biomedical Electronics Engineering, Kolej Kemahiran Tinggi MARA Ledang, Serom 4&5, Jalan Serom-Bukit Gambir , 84410 Sungai Mati, Ledang, Johor, Malaysia,
ABSTRACT
Red blood cell (RBC) diagnosis is very important process for early detection of blood related disease such as malaria and anemia before suitable follow up treatment can be proceed. Conventional method is conducted by pathologist by manually count and classifies the viewed cell under light microscope. Such process is tedious and required highly skill and experience pathologist to analyze the shape of the red blood cell and consequently counting its number. In this paper an automated RBC counting and classification system is proposed by using National Instrument (NI) Vision Builder Automated Inspection (AI) tool to speed up the time consumption to analyze the RBC and to reduce the potential of the wrongly identified RBC. Initially the RBC image undergoes image pre-processing steps which involved global threshold of method applied green channel color image. Then it continues with RBC counting by using particle area and calculator numeric function method. Eventually, Heywood Circularity Factor method is applied for normal and abnormal RBC classification. The proposed method has been tested on blood cell images and the effectiveness and reliability of the system has been demonstrated.
Key words: Red Blood Cell NI Vision Builder AI Particle Area Heywood Circularity Factor
INTRODUCTION
Blood is a connective tissue consisting of red blood cells (RBC), white blood cells (WBC), and platelets suspended in plasma. As a medium of transportation for the whole body, blood composition is very vital to be monitored when it comes to medical inspection. RBC analysis contributes information of pathological diseases and condition. It helps doctors to determine the appropriate treatment to the patient. Any condition which there is an abnormally low of haemoglobin concentration or red blood cell count is indicating to anaemia (Fox, 2009) and also low of specific vitamin ( Sharif, 2012). The shape of RBC and its deformability or abnormality has connection to the relevant disease such as Huntington’s disease, Myalgic Encephalomyelitis (ME) and Multiple Sclerosis (MS)(Vromen, 2009).
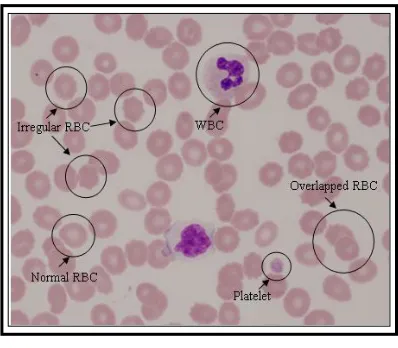
Complete blood count (CBC) is a compilation test of blood component including for RBC analysis. Normally the blood sample is taken and processed in the laboratory by using chemical electronic devices such as haemocytometer or haematology analyzer. This work is manually done by lab technologist and it is very dependent to their skill especially to count the cell through microscope (Sharif, 2012). The counting and analysis process is difficult when the cells are overlapped as shown in Figure 1. The conventional method is time-consuming to complete and the counting task is laborious (Natsution, 2008).
Image processing is an alternative method to identify each single cell in blood samples. Comparing to the conventional method, image processing provide various advantages that y helpful in the RBC analysis. Classification of each cell in blood samples is the ultimate
process to be conducted to identify each single cell in the blood cell. This classification process will lead to the counting process. From counting process the total quantity of each single cell in blood samples can be gained. It will be used as a reference for a doctor to make a conclusion about the patient health status.
[image:1.595.337.536.471.645.2]Nowadays many researchers have interest in developing algorithm to automatically count and analyze the blood cells. They applied advanced technology of image processing in conjunction with artificial intelligent and computer graphic system to provide methods that are accurate, faster and easy to use. Source of blood samples are obtained from the lab and the images are captured using light microscope that attached with a digital camera (Tomari, 2014, Venkatalaksmi, 2013). For the image processing part, many advance software are used such as MATLAB (sharif, 2012), Lab VIEW (Ajay, 2014) Microsoft Visual Studio and Open CV (Tomari, 2015). The
image processing can be broadly divided into two main categories which are segmentation and classification. The former extract the RBC area while the latter process the extracted area into cell morphology information.
Segmentation process is an important step in image processing to differentiate objects from the background. In the previous study, there are variety of methods proposed for segmenting the RBC image such as threshold and morphological operation (Ajay, 2014, Venkatalakshmi, 2013, Berge, 2011), pulse coupled neural network (PCNN) (Adagale, 2013), colour based segmentation (Mahmood, 2013), masking and watershed algorithm (sharif, 2012), active appearance model(Cai, 2012), shape reconstruction (Wang, 2010) and region based segmentation (Vromen, 2009). In this paper, RBCs image is segmented using threshold and morphological operation. The value of threshold is set in green channel since it gives the best contrast between RBC and background (Tomari, 2014). Morphological operation then works on binary image for changing shape, size, structure, and extract clear feature of RBCs. It includes remove border, remove small object, fill holes, reverse and equalize steps.
Classification of RBC process can be carried out using several methods such as neural network (Tomari, 2014, Poomcokrak, 2008), template matching (Adagale, 2013), edge detection (Cai, 2012), and depth map and surface feature (Wang, 2008). This process is to identify or recognize the pattern of RBC into normal and abnormal considering single or overlapped condition. Besides, it also aids in counting process. This paper uses Heywood circularity factor technique for RBC classification added with mathematical numeric function for calculation purpose.
RBC counting and analysis using image processing is ongoing research in medical diagnosisimaging. It always goes through improvement as a new research is carried out. The researchers offered many different methods that can provide better accuracy and promising solution. However there are still weaknesses and constraints due to the image itself such as colour similarity, weak edge boundary, overlapping condition, image quality, contrast, brightness, illumination and noise. Thus, more studies must be done to handle those matters to produce strong analysis approach for medical diagnosis purpose.
SYSTEM OVERVIEW
The proposed method flow diagram of RBC counting and classification system is outlined in Figure 2. It starts with the input image acquired from a light microscope that attached with eye piece static camera. The pre-processing start with global threshold RGB colour under green color channel. The range of the value is finely selected to extract only the blood cells from its background. After that image smoothing process continues with remove border object, remove small object and fill the hole. Once the pre-processing step completed, the counting process starts by using selection range of particle area to classify
single, two-overlap, three- overlap of RBC and so on. Following that, the calculator numeric function is used to sum up all of the RBC quantity.
[image:2.595.310.549.240.584.2]For classification, since the unique feature between the normal and abnormal RBC is the spike border, hence Heywood circularity factor can be used to differentiate between them. The significant value of Heywood circularity is finely tuned until it can significantly distinguish between the two cells. For this project, all of the mentioned methods are applied using NI Vision Builder AI. Towards the end, the performances and accuracy of this counting and classification method are evaluated.
Figure 2:RBC counting and classification flow diagram
Image Acquisition
Figure 3: Image Acquisition Equipment
Image Segmentation and Processing.
Before proceed for RBC identification, the initial stage is pre-process the acquired image. This image cannot be process straight away as it is. It needs to be prepared in monochrome or binary representation for convenience and fast processing. Binary image represents the image as 1 or 0 and from this representation then the next process can be proceed. Threshold method is the easiest way to separate the object in image from its background. The color property that is selected for this project is RGB. Under RGB segregation, the most prominent color to qualitatively and quantitatively differentiate between RBC and its background is the Green channel.
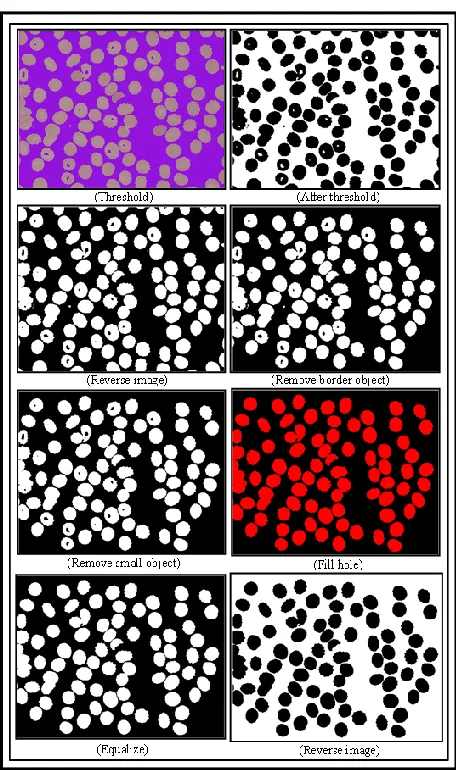
Figure 3: Image pre-processing stages.
The threshold value can be selected between 0 until 255 and among this value the most significant threshold that matches for the whole sample images is in the range of 148-154. There are total four images that be used in this project for RBC counting and classification and sample of the threshold image is shown in the first row of Figure 3. In the image, the background is in the white representation while the foreground is in black.
After the thresholding process, the next process is applying the Vision Assistant function to pre-process the image. Due to the process only focusing on the complete RBC shape, thus the RBC in the border location can be ignored due to its incomplete shape. Under the tab of “Processing Function: Binary” by selecting “Advanced Morphology” function follow by “Remove border object” option, the RBC that located in the image border can be removed. Sample of the outcome of this process is shown in the second row of Figure 3.
From the segmentation process there are small objects and holes exist in the image that needs to be cleared. These small objects are come from the platelet area and from the imperfection of background identification. To diminish such noise a “Remove small object” function is selected and minimum area that constitute to noise is empirically determined as 50. Due to hemoglobin shape of the RBC, after the threshold process some of the inner RBC area becomes hollow. These holes need to be filled due to it affects in the classification stage that using object particle area property. To solve this matter, a “Fill hole” function is selected under the “Processing Function: Binary” tab of Vision Assistant function. Sample of the output of the filtering step is shown in the third and fourth row of Figure 3.The image is then ready to be fed into the next stage which are RBC classification and counting.
RBC Counting and Classification
To determine the RBC morphology, in this project two features are extracted which are the area of particle and Heywood circularity. The first feature can determine single and overlap RBC while the latter classify the single RBC region between normal and abnormal. In NI Vision Builder this method is located under “Detect Objects” function under the tab of “Inspection Steps: Locate Feature”. From empirically analysis, it is found that the single non overlap RBC particle area is around (524-3047) thus for area higher than this value the RBC can be classified as overlap. The single RBC can be count directly and percentage error count can be determined by using following equation.
Heywood circularity factor function is applied to identify the normal RBC region. It works by dividing the object perimeter with the circumference of a circle with the same area. The closer the shape of a particle is to a disk, the closer the Heywood circularity factor is to 1. The equation for calculating the factor is as follow:
(2)
(3)
Once the normal RBC area is found, the abnormal RBC location can be identified by subtracting the area of non overlap RBC with the normal RBC regions as in equation (3). This method function is located in “Calculator” function under the tab of “Inspection Steps: Use Additional Tools”.
Abnormal RBC = Non_overlap RBC - Normal RBC
EXPERIMENTAL RESULT AND DISCUSSION
[image:4.595.315.546.262.567.2]In this section, analysis of the developed RBC counting and classification system is tested using four blood smeared images as shown in Figure 4 which are labeled as RBC_1, RBC_2, RBC_3 and RBC_4.The analysis is conducted to determine an optimal parameters and consequently the system performance for distinguishing between single and overlap RBC, and normal and abnormal RBC.
Figure 4: Four samples of RBC image.
From the analysis of four sample images shown in Figure 4, it is found that the range of particle area of RBC in the images is from 574-16841 (RBC_1), 528-15905 (RBC_2), 814-30838 (RBC_3), and 1352-7196 (RBC_4). From this range, empirically the single RBC region can be identified when the area is within 524 to 3047 pixels. Above this value the RBC is identified as an overlap cell.
In the overlap case, generally there will be a situation where more than two RBCs in overlapped region and hence the exact number is unknown. To solve this issue, the range particle area is further manipulated. The range is set according to following formulation : 0-3047 for single RBC, 3048- 5000 for two RBCs, 5001-7000 for three RBCs, 7001-9000 for four RBCs, 9001-11000 for five
RBCs and 11001-20000 is for six RBCs. With this simple procedure, the estimated number of total RBCs in the blood smeared image can be determine easily with an acceptable accuracy.
For analysis of normal and abnormal RBCs from the single RBC cells, Heywood circularity factor function is applied. From the mentioned four sample images above, preliminary testing indicate that the range of Heywood circularity factor for normal RBC is 1.029-1.964 (RBC_1), 1.008-2.221(RBC_2), 1.004-2.757 (RBC_3) and 1.002-1.723 (RBC_4). For generalizing this finding, the value is set within 1-1.026 for normal RBC region and abnormal beyond this range. The number of each respective cluster will be counted after the identification process completed.
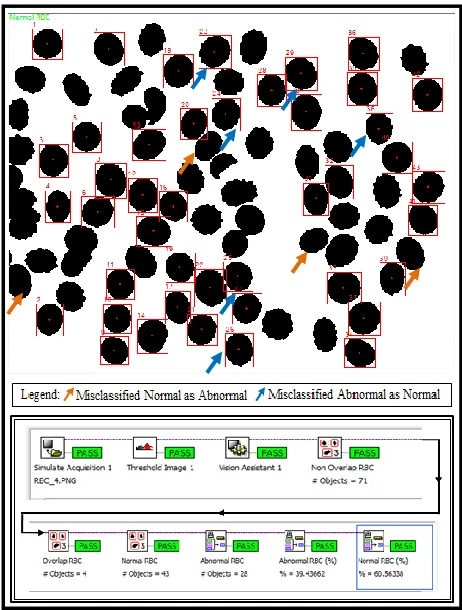
Figure 5: Image RBC_4 classification result.
Figure 5 shows sample of the classification and counting result of image RBC_4 by using the developed system. From the image it can be seen that the total quantity of the three clusters which are single RBC, overlap RBC, normal RBC and abnormal RBC is successfully obtained. The general system performance is assed based on the system ability to correctly identify and count the number of normal RBC cell and abnormal RBC cell. For each images, the quantitative measurement is performed based on True Positive (TP), False Positive (FP), True Negative (TN), and False Negative (FN) parameters. All the related formulas are shown in equation (4). Precision provides information about how many of the detected fraction cells are correct, and recall tells how many cells are correctly detected in each class from the whole image. The accuracy on the other hand, gives evaluation about how well the overall system performance with respect to the ground truth data
(RBC_3) (RBC_4)
[image:4.595.45.288.377.586.2](4)
;
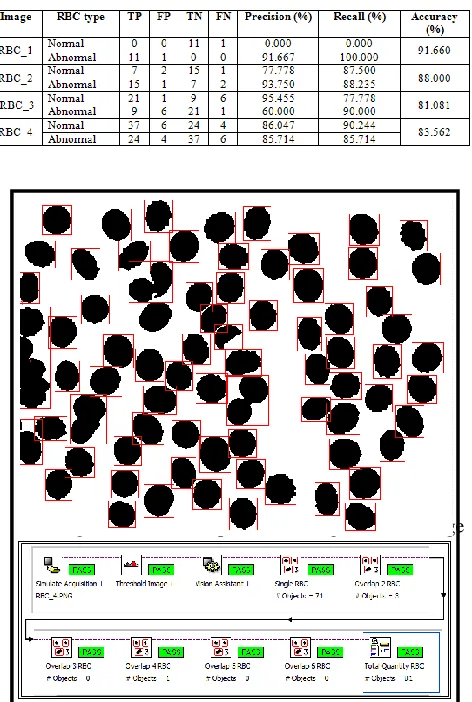
Table 1 summarized the result of RBC classification. Overall the proposed method performs quite well with an average accuracy of 86.076%, average normal precision of 64.820% and 63.881% of average recall. This means that most of the object classes are correctly identified with an acceptable error rate. Actually the classification process only focused on normal RBC identification and the abnormal one is identified based on the subtraction function. Therefore, the quantity of abnormal RBC is highly depending on the correctness of the normal RBC detection. It can be seen that in image RBC_ 4, there are quite a lot FP of abnormal RBC detected. This misclassification occurs due to the shape of the RBC that is in the form of oval shape. Therefore it is out of the range of the defined normal RBC shape. If the maximum range of Heywood circularity factor is changed from 1.026 to 1.030 some of this normal RBC can be classified, but unfortunately the number of misclassified abnormal as normal become higher.
[image:5.595.310.549.253.325.2]Table 1: Result for identifying and count the number of normal and abnormal RBC.
Figure 6 shows sample of counting result of image
Figure 6: Image RBC_4 counting result.
RBC_4. In the image processing, the objects that touch border are neglected. For obtaining the better result of counting as well as the accuracy, the threshold value in
earlier process is very important. Overall counting performance is summarized in Table 2. It shows the overall error rate for every sample is less that 10% and hence it is quite acceptable. Image RBC_4 has less error since the number of single RBC is dominant and only three group of overlapped RBC is in it. For image RBC_1, RBC_2 and RBC_3, the overlapped cells number are quite high and with the existing of white blood cell and platelet make the counting and the classification task quite difficult. The error percentage of image RBC_1 is highest because of the condition of overlapped cells is very complicated. It is quite hard to exactly put the number because of the size and the shapes of the overlapped cells are different for each group.
Table 2: Error percentage of RBC counting
CONCLUSION.
In this paper a method of RBC counting and classification is proposed. The system consists of two main process which is image pre-processing and RBC counting and classification. The platform that is used is NI Vision Builder AI. The main function which is applied in this project in the software is “Vision Assistant” under the tab of “Inspection Step: Enhance Images and “Detect Object” under the tab of “Inspection Steps: Locate Features”. Vision Assistant if for image pre-processing and Detect Object is for counting and classification.
We have shown that by using area of particle function, each of single RBC can be identified. Particle area specialized applied for non-overlap RBC quantity. For overlap RBC, there is additional method that was tested which is selection the range of particle for two overlap RBC, three overlap RBC, four overlap RBC and so on. It is noted that selection particle area range is not accurate and not robust for instance in RBC total overlap case. In future for counting process, it suggested to apply Hough transform due to it can detect circle image in overlap region. NI Vision Builder AI is not supported for this function.
Classification of normal and abnormal RBC was defined by using Heywood circularity factor. The tested system was successfully done with the acceptable precision, recall and accuracy of the normal and abnormal RBC if compared to the ground truth data. In this project the classification only focused on normal RBC and the abnormal RBC data is not independent. By the way, there is limitation of using Heywood circularity factor method for oval shape of normal RBC.
[image:5.595.52.288.360.711.2]the accurate result of the total quantity of non-overlap normal and abnormal RBC. It is also suggested to use Particle Classification method under Vision Assistants function due to its function can train samples of images to be classified.
In the other hand, during image pre-processing stage, the image of white blood cell is proposed to be removed earlier for better RBC counting and classification result. Method that is suggested for this purpose is by using CMYK color threshold segregation function.In future if more image of RBC samples can be provided then the performance of the system can be tested more thoroughly for multi condition and shape of RBC.
ACKNOWLEDGMENTS.
The authors would like to thank to Ministry of Education (MOE) and Universiti Tun Hussein onn Malaysia (UTHM) for supporting this research under Research Acculturation Collaborative Effort (Vot. no. 1448).
REFERENCE
Ajay P. Dhawale and S. R. Hirekhan, Real- Time Image Processing for Biological Applications Through Morphological Operations using LabVIEW , International Journal of Engineering research & Technology (IJERT), vol. 3 issue 5, May 2014.
Adagale, S.S. and Pawar, S.S. Image Segmentation using PCNN and Template Matching for Blood Cell Counting, IEEE International Conference on Computational Intelligence and Computing Research, pp. 1-5, 2013.
Berge, H., Taylor, D., Krishnan, S. and Douglas, T.S. Improved Red Blood Cells Counting in Thin Blood Smear, IEEE- ISBI, pp.204-207, 2011.
Cai, R., Wu, Q., Zhang, R., Fan, L. and Ruan, C. Red Blood Cell Segmentation using Active Appearance Model, IEEE 11th International Conference on Signal Processing, pp. 1641-1644, Vol. 3, 2012.
Fox, S.I. Human Physiology, Mc Graw Hill International Ed., 11th Ed., New York, 2009.
Jambhekar, N. J. Red Blood Cells Classification using Image Processing, Science Research Reporter, 1(3): p151-154, November 2011.
Mahmood, N.H. Poon C.L., Mazalan, S.M. and Abdul Razak, M. A. Blood Cells Extraction using Color Based Segmentation Technique, International Journal of Life Science Biotechnology and Pharma Research, Vol.2 No. 2, pp. 233-240, April 2013.
Natsution A.M.T, and Suryaningtyas, E.K. Comparison of Red Blood Cells Counting using two Algorithms: Connected
Component Labelling and Backprojection of Artificial Neural Network, IEEE, Singapore, pp. 1-4, 2008.
Poomcokrak, J. and Neatpisarnvanit, C. Red Blood Cells Extraction and Counting, The 3rd International Symposium on Biomedical Engineering, 2008.
Sharif, J. M., Miswan, M. F., Ngadi, M. A., Salam, M. S. and Abdul Jamil, M. M., Red Blood Cell Segmentation Using Masking and Watershed Algorithm: A Preliminary Study, International Conference of Biomedical Engineering (ICoBE), Penang Malaysia, 27-28 February 2012.
Tomari, R., Wan Zakaria, W. N., Abdul Jamil, M. M., Mohd Nor, F. and Nik Fuad, N. F., Computer Aided System for Red Blood Cell Classification in Blood Smear Image, Procedia Computer Science, vol 42,pp. 206-213, 2014.
Tomari R., Zakaria W.N.W, Ngadengon R. and Wahab M.H.A . (2015). Red Blood Cell Counting Analysis by Considering an Overlapping Constraint, ARPN Journal of Engineering and Applied Sciences, 2015, Vol 10, No. 3, pp. 1413-1420.
Venkatalakshmi, B. and Thilagavathi, K. Automatic Red Blood Cell Counting using Hough Transform, IEEE Conference on Information & Communication Technologies (ICT), 2013.
Vromen, J. and McCane, B. Red Blood Cell Segmentation from SEM Images, 24th International Conference Image and Vision Computing, New Zealand, 2009.
Wang, R., MacCane, B. and Fang, B. RBC Image Segmentation based on Shape Reconstruction and Multi-scale Surface Fitting, 3rd International Symposium of Information Science and Engineering, pp. 586-589, 2010.