Construction Materials and Technology Series 1 2018 ISBN 978-967-2183-19-8
31
CHAPTER 3
STUDY ON THERMAL PERFORMANCE OF PRECAST CONCRETE
SANDWICH PANEL (PCSP) DESIGN FOR SUSTAINABLE BUILT
ENVIRONMENT
Peniel Ang Soon Ern1, Lim Mei Ling1
1Faculty of Engineering Technology
,
Universiti Tun Hussein Onn Malaysia
,
Parit Raja,
Batu Pahat,
86400 Johor,
Malaysia.
3
.
1 INTRODUCTIONSustainability in construction industry has become an issue when designing a new building [1] and the conventional on-site construction methods have long been criticised for imposing rigorous human health and safety risk, as well as causing significant environmental destruction [2]. Meanwhile, PCSP can be perceived as an alternative approaches in creating and maintaining the sustainable built environment. Finsen & Georgia (2011) [1] said that this wall system can maximise benefits from integrated strategies, which focus on all of the building’s materials and systems, as well as the way they interact.
The number of studies on thermal insulation of exterior and interior panels in PCSP design is very limited compared to the research of lightweight for the panels in PCSP design. It should be noticed that an appropriate design of thermal insulation of exterior and interior panels in PCSP can significantly reduce the consumption of energy for space heating and cooling and eventually reduce the degradation of energy-quality and caused carbon dioxide (CO2) emissions, which is in line with the concept of sustainable building [3]. In hot countries such as Malaysia, the building’s wall should be able to retain heat of the day and release the heat during the night. Hence, the PCSP that applied in the building’s wall should have the suitable thermal performance in order to save the energy thermal capacity that required to maintain the internal temperature by help of air-conditioning system [4].
Construction Materials and Technology Series 1 2018 ISBN 978-967-2183-19-8
32
the thermal performance between FC and FC+POFA panels with C panel. Meanwhile, the cube from these three types of specimens also been produced in order to observe the workability and compressive strength development.
Different mix proportion of foamed concrete in PCSP were used to study the effect of the proportion on the properties of the panels especially in thermal properties.
3.2 LITERATURE REVIEW
This section will briefly discuss the precast concrete sandwich panel (PCSP) and the previous research on the foamed concrete (FC) mixture and thermal behavior of different materials in the sandwich panels.
PRECAST CONCRETE SANDWICH PANEL (PCSP)
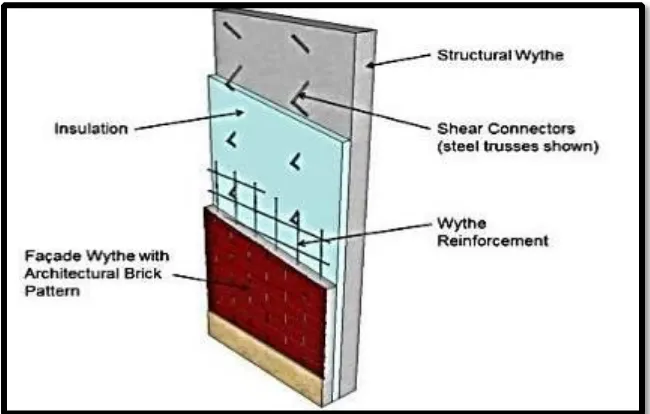
PCSP commonly categorized in prefabricated concrete system which used for building envelopes. It is currently used as the curtain walls with a little modification and it can function as loading bearing elements [5]. Figure 3.1 shows precast concrete sandwich panel with its key components.
[image:2.597.111.436.358.565.2]
Figure 3.1: Illustration of a Precast Concrete Sandwich Panel with key components (Tomlinson, 2015)
This type of sandwich panel is light in weight, but still maintaining adequate strength, good durability, good thermal insulation and good sound insulation [4]. Ahmad & Mohamad (2012) [7] stated that the thermal efficient systems of PCSP can save nearly to 20% in energy cost compared to framed works.
Construction Materials and Technology Series 1 2018 ISBN 978-967-2183-19-8
33 FOAMED CONCRETE (FC)
Foamed Concrete (FC) is still considered as a new construction material compared to the conservation concrete. FC is one of the lightweight concrete which consist of Portland cement, fine aggregates (sand), water, foaming agent and compressed air [9]. There are clear difference between the normal concrete and FC, where FC requires a higher proportion of ultra-fine materials and the incorporation of chemical admixtures, particularly high range of water [10]. But generally, FC possess the characteristics such as low in density, high workability [9], high thermal insulation [11], high fire resistance [12] and high strength compared to conventional concrete.
Thus, it can be concluded that FC is a more sustainable choice compared to conventional concrete due to its characteristics. Hence, it is encouraged to apply FC in the wall system in construction and the study of new additives such as POFA waste should be conducted to reduce the waste generation and in the same time create a sustainable built environment.
PREVIOUS STUDY ON FOAMED CONCRETE (FC)
There are many FC with different additives such as expanded polystyrene (EPS), fly ash (FA) and palm oil fuel ash (POFA) that had been study to find an optimum compressive strength in concrete specimens. But, POFA is the material that encouraged to use in construction industry due to its high strength properties and less impacts to environment in concrete specimens. POFA is an agro-waste ash from palm oil residue, which burnt at temperatures of about 800˚C –1000 ˚C in biomass thermal power plants [13]. Table 3.1 shows the general chemical composition of POFA.
Table 3.1: General chemical composition of POFA [14]
Chemical Composition Contents (%)
Silicon Dioxide (SiO2) 55.20
Aluminum oxide (Al2O3) 4.48
Ferric oxide (Fe2O3) 5.44
Calcium oxide (CaO) 4.12
Magnesium oxide (MgO) 2.25
Sulphur oxide (SO3) 2.25
Sodium oxide (Na2O) 0.10
Potassium oxide (K2O) 2.28
Loss of ignition (LOI) 13.86
Table 3.2: Compressive strength of concrete specimen at 7, 14, 28 days of curing [13] Concrete Composition
with POFA replacement (%)
Average Compressive St rength
7 days 14 days 28 days
0 23.03 31.10 37.04
5 24.36 31.40 37.55
15 23.45 30.79 38.80
25 22.89 29.99 37.07
35 12.76 19.98 23.55
Construction Materials and Technology Series 1 2018 ISBN 978-967-2183-19-8
34
One of the researcher, Deepak et al., (2014) [13] had conducted an experiment to study the effect of different percentage of POFA in foamed concrete and the results of compressive strength for this study had shown in Table 3.2.
The results showed that the optimum compressive strength is when the cement is replaced with 15% POFA giving a higher compressive strength than OPC. However, according to Aminudin (2014) [14], replacement of POFA up to 30% still can give the highest strength among the others.
Hence, we can conclude that application of 15% to 30% POFA in construction industry can increases the strength of concrete. Use of POFA as the cementing materials in construction industry will also reduce the environmental problems associated without disposing it in landfill.
From the previous study, it can be see that most of them are focus on the mechanical properties of FC with different additives instead of its thermal properties. Therefore, in order to develop a sustainable built environment, it is a necessary for research of thermal insulation of PCSP design with POFA as additives in foamed concrete.
STUDY OF GYPSUM BOARD ON THERMAL PERFORMANCE OF PCSP DESIGN
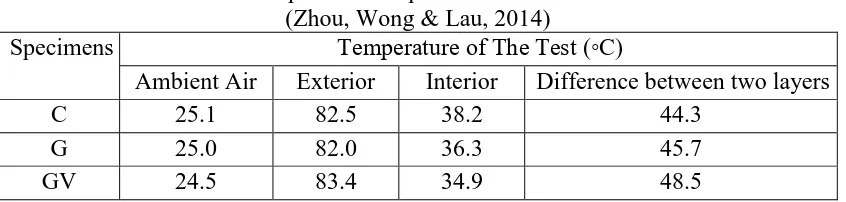
Gypsum board is an eco-friendly material, which possess a low environment impact and provides good thermal performance. Zhou, Wong, & Lau (2014) [3] had carried out an experimental work which involved a series of heat test on three different design of PCSP. The three specimens include conventional concrete sandwiched layer (C), specimen having a solid gypsum sandwich layer (G) and specimen having a gypsum layer with voids (GV). Table 3.3 shows the temperature of specimens after 12 hours radiation of halogen lamp.
[image:4.597.89.512.465.566.2]
Table 3.3: The temperature of specimens after 12 hours radiation (Zhou, Wong & Lau, 2014)
Specimens Temperature of The Test (◦C)
Ambient Air Exterior Interior Difference between two layers
C 25.1 82.5 38.2 44.3
G 25.0 82.0 36.3 45.7
GV 24.5 83.4 34.9 48.5
The results of experiment showed that sandwiched gypsum layer can effectively retarded the heat transfer possess in the PCSP and the gypsum layer with voids posse the higher thermal insulating among the specimens. The thermal performance of the GV specimens can be considered as the better one compared to others.
Construction Materials and Technology Series 1 2018 ISBN 978-967-2183-19-8
35
3.3 METHODOLOGY
STEP 1: PREPARATION OF MATERIALS
In order to produce 1000kg/m3 of foamed concrete with higher strength, selection of the material must base on quality, economical and good performance. Materials used in this study are water, Ordinary Portland Cement (OPC), sand, POFA, foaming agent and gypsum powder.
The sand used was passed through 600 µm and water used in this study is tap water. Meanwhile, the source of POFA was from palm oil industry in Kahang which classified as Class F Fly Ash in accordance with ASTM C618 (2008). Foaming agent used is Sika AER 50/50 and it was diluted with water by 1 proportion of foaming agent to 20 proportion of water. Gypsum board was used as the sandwiched layer in the PCSP design. Gypsum powder used for moulding of gypsum board will be gypsum casting powder. This powder was obtained from Chip Seng Ceiling Plaster Trading, Batu Pahat, Johor.
STEP 2: FRESH CONCRETE MIXTURE
Mix Proportions
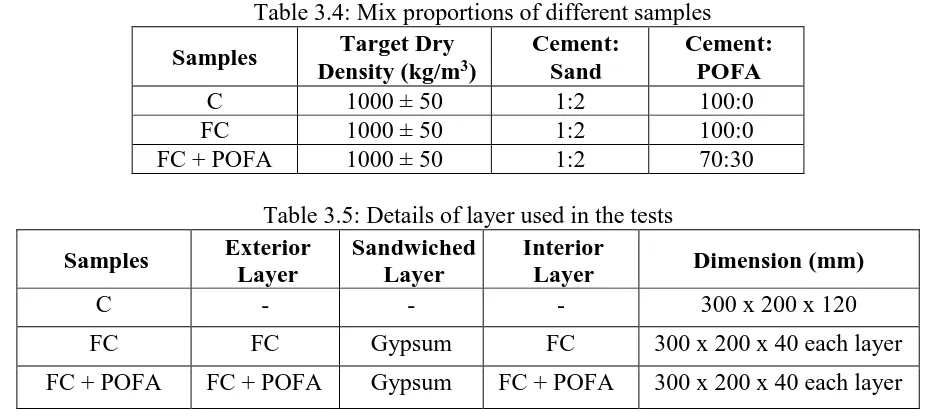
There is no standard method for proportioning foamed concrete, so the mix proportion of the foamed concrete incorporated with POFA was determined by previous study. The ratio of cement-sand and water-cement ratio used in this study is constant throughout whole experimental work which is 1:2 and 0.5 [16]. The mix proportions used for different samples are shown in Table 3.4. Meanwhile, Table 3.5 shows the details of layer used in the test.
[image:5.597.64.531.454.664.2]
Table 3.4: Mix proportions of different samples
Samples Target Dry
Density (kg/m3)
Cement: Sand
Cement: POFA
C 1000 ± 50 1:2 100:0
FC 1000 ± 50 1:2 100:0
FC + POFA 1000 ± 50 1:2 70:30
Table 3.5: Details of layer used in the tests
Samples Exterior
Layer
Sandwiched Layer
Interior
Layer Dimension (mm)
C - - - 300 x 200 x 120
FC FC Gypsum FC 300 x 200 x 40 each layer
FC + POFA FC + POFA Gypsum FC + POFA 300 x 200 x 40 each layer
Preparation of mixing procedure of foamed concrete was based on previous study of researchers. The mixing procedure of foamed concrete in laboratory is as below:
Construction Materials and Technology Series 1 2018 ISBN 978-967-2183-19-8
36
ii Next, water was added into the dry mix and mix until wet mixture was uniformly mixed. iii The mixer stopped for volume reading. After taken the volume reading, while the mixer still
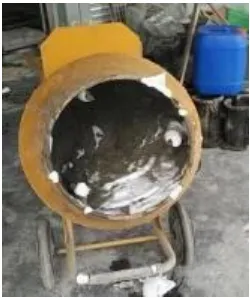
in motion, foam is added to the mix through the foam generator as shown in Figure 3.2. iv The mixing was continued until the foam was completely mixed with the mixture. vi. After
that, mixer was stopped for hand mixing about 60s and mixer start again.
v After 1 minutes mixing, the mixer stop for density check, if the density haven reached 1000kg/m3 ± 50 kg/m3, then the mixture need to add with foam until it reached the targeted density. If density of the mixture reached 1000kg/m3 ± 50 kg/m3, the mixer will stop for workability test and flow test. viii. After the tests, mixer will start again for 30 seconds and after that the sample is ready for casting.
[image:6.597.235.360.245.394.2]
Figure 3.2: Mixing of fresh concrete with foam
Batching of Gypsum Mixture
There still no standard of composition for mixture of gypsum powder and water. But according to Fang (2013) [17], the gypsum powder was added into the container which filled with water slowly until the water cannot absorb any of the powder. The powder was allowed to soak for 1 to 2 minutes maximum. The mixture was then mixed with a constant motion and there was a change in consistency from watery to a thick cream.
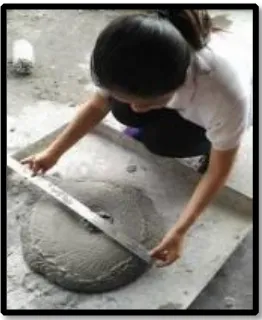
Flow Test
Flow test was conducted by using a slump cone and flat base plate as complied with ASTM C 995 (2001). The mixture was filled into a slump container and then slowly lifted it to 1 ft height. Then, the fresh concrete will spread and the four angle of dimension of spread shown in Figure 3.3 was measured and recorded.
Air Curing
Air curing is used in this study as the previous study of Muthalib (2013) [18] shows that air curing can lead to higher compressive strength. Figure 3.4 shows the condition of air curing in the room. For this study, 6 cubes and the PCSP panels of each type of specimens were mould and let it dry in the room with the temperature 30 °C ± 2 °C until the time of testing which are 7 and 28 days respectively as shown in Figure 3.4. PSCP panels only test after 28 days.
Construction Materials and Technology Series 1 2018 ISBN 978-967-2183-19-8
[image:7.597.226.357.95.255.2] [image:7.597.116.497.528.722.2]37
Figure 3.3: Measurement of four angle dimension spread
STEP 3: ASSEMBLY OF PCSP
The Figure 3.5 shows the assembly of three full-scaled panels which used to underwent axial compressive test and heat transfer test.
Figure 3.5: Assembly of three full-scaled panels
Figure 3.4 : Condition of air curing in the room
Control Panel, (C) Foamed Concrete
Panel, (FC)
Construction Materials and Technology Series 1 2018 ISBN 978-967-2183-19-8
38 STEP 4: CONCRETE TEST
Cube Test and Axial Compressive Test
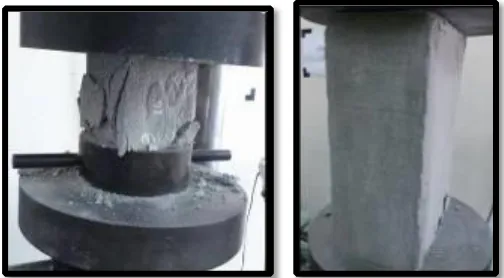
Cube Test was performed in accordance with BS EN 12390-3 (2002). An axial compressive load with specific rate of loading is applied to the cubes until failure occurred. Mean value will obtained from the three cubes then taken as compressive strength for each foamed concrete mix. The same procedures of cube test were applied on the axial compressive test of specimens in panel size. Figure 3.6 shows the failure of cube and panel after applied by specified load.
[image:8.597.181.433.235.374.2]
Figure 3.6: Failure of cube and panel after applied by specified load
Consistency and Stability
The fresh density and hardened density of the specimens were used to check the stability and consistency of the mix [19]. The consistency and stability of the specimens is determined by the Equation 3.1 and Equation 3.2 [19]. Consistency Fresh Density Designated Density
(3.1)
(3.2)
STEP 5: HEAT TRANSFER TEST
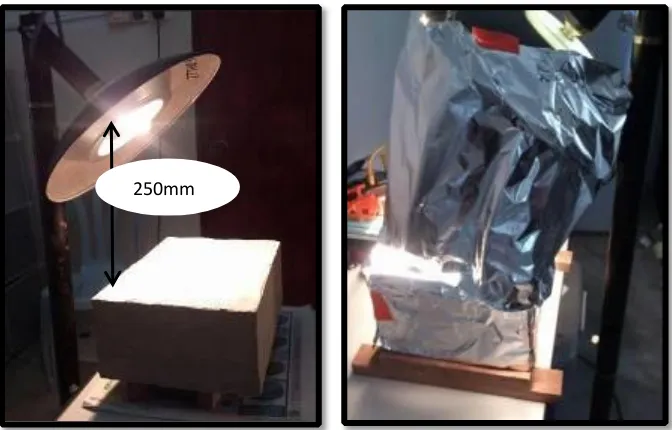
After 28 days, the panels underwent the heat transfer test where temperature variations across the wall thickness over time in different specimens were recorded in order to observe the thermal insulation performance. In heat transfer test, a halogen lamp was used as a heat source for 8 hours [3] and was placed 250 mm away from the exterior concrete, as demonstrated in Figure 3.7.
The heat conduction from exterior concrete surface to interior concrete surface is the primary concern in this study. The panels were wrapped with aluminium foil around the sample to reduce the heat loss to surrounding and to minimize the radiation from the halogen lamp reaching the sides of panels during the experiment, and also to ensure one dimensional heat transfer. Thermocouple shows in Figure 3.6 is used to measure the temperature of exterior and interior surface of specimens for every 30 minutes. While, Figure 3.8 shows the experimental setup before and after panel covered with aluminium foil.
Construction Materials and Technology Series 1 2018 ISBN 978-967-2183-19-8
[image:9.597.232.369.97.254.2]39
Figure 3.7: Thermocouple
Figure 3.8: A schematic diagram showing the specimen, heat source and experimental setup before and after covered with aluminium foil
To simplify the heat transfer analysis, there are some assumptions that need to be introduced. The assumptions included:
(a) The panels have the same effective density
(b) There is no convective heat transfer at sides of the panels, as the panels are wrapped by aluminium foil and the experiment will take place inside a controlled environment.
(c) The radiation from halogen lamp reaching to the sides of panels were prevented by aluminium foil, hence radiation can be negligible.
The temperature difference will be calculated after 8 hours radiation. The temperature differences for the two layers are calculated based on Equation 3.3. The higher the temperature differences between the two layers, the more the heat is been insulated and the better the thermal performance of the PCSP design.
[image:9.597.124.460.294.509.2]
Construction Materials and Technology Series 1 2018 ISBN 978-967-2183-19-8
40
Temperature Difference = T1 – T2 (3.3)
Where;
T1 = Temperature of exterior surface of concrete T2 = Temperature of interior surface of concrete
3.3 RESULTS AND DISCUSSIONS
WORKABILITY, CONSISTENCY AND STABILITY OF SPECIMENS
The fresh concrete properties are shown in Table 3.6. All the specimens show good result in workability, consistency and stability.
[image:10.597.102.497.275.493.2]
Table 3.6: Spread value, consistency and stability of various types of specimens
Specimens Cube
Detail
Sand: POFA
Spread (mm)
Consistency Stability
C and FC
C1
100:0 520-540
1.10 1.05
C2 1.09 1.05
C3 1.10 1.05
C4 1.08 1.03
C5 1.10 1.04
C6 1.09 1.05
FC + POFA
FC1
70:30 430-450
1.05 1.02
FC2 1.06 1.02
FC3 1.04 1.02
FC4 1.05 1.03
FC5 1.05 1.02
FC6 1.06 1.02
Table 3.6 shows that the spread value of FC+POFA specimen range from 430 mm to 450 mm is lower than the C and FC specimen. In other words, the addition of POFA in the mixture makes the concrete less workable compared to the C and FC specimens. The finding had been agreed by Lim et al. (2013) [19] and Ahmad et al. (2008) [20] which found that the replacement of POFA will cause a reduction in spread value and workability compared to other specimens due to the shape of the pozzolans particles in the POFA.
High consistency of the C and FC specimens mean the specimens are wetter compared to FC+POFA specimens, and wetter mixtures are more workable than the drier mixtures. Hence, the addition of POFA in the foamed concrete mixture will cause the mixture to have lower workability and consistency.
Construction Materials and Technology Series 1 2018 ISBN 978-967-2183-19-8
41
CUBE TEST AND AXIAL COMPRESSION TEST RESULTS
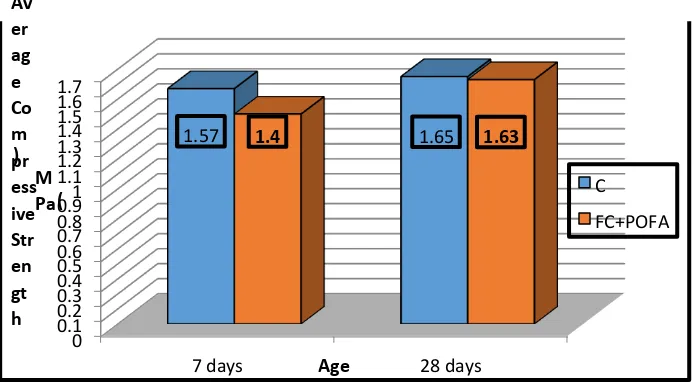
All the specimens were tested for compressive strength at day 7 and day 28. Generally, Figure 3.9 reveals the compressive strength of the specimens increased from 7 days to 28 days.
[image:11.597.113.460.178.369.2]
Figure 3.9: Compressive strength of various types of specimens at day 7 and day 28
Figure 3.9 shows that the compressive strength of C specimen at day 7 is 1.57 MPa which is higher than the FC+POFA specimen which is 1.4 MPa. The study of Abdullah et al. (2006) [21] had also show the same situation where addition of POFA in concrete will cause low compressive strength at day 7. This may due to the pozzolanic characteristic that is possessed by POFA which cause the compressive strength to develop slowly at early age as compared to the control specimen (C).
However, the compressive strength of FC+POFA specimen at day 28 showed an increased to 1.63 MPa, nearer to the compressive strength of normal specimen. The result of compressive strength in this study shows some differences compared to other researches. The addition of 30% of POFA in the concrete mixture can improve the compressive strength compared to the normal concrete. This situation may be due to the different physical and chemical properties of POFA used in the experiment work [22]. The concentration of SiO2 in the POFA used in this experiment may be relatively smaller than the previous researches conducted [22]. Hence, the present study is able to conclude that POFA has the potential to be used as the partial cement replacement in producing foamed concrete as the strength possessed by FC+POFA specimen is near to a normal concrete.
The axial compressive strength for the three specimens which were air cured for 28 days are shown in Figure 3.10. The results show that the FC+POFA panel has the highest strength of 3.3 MPa compared to other panels. Meanwhile, C panel’s strength is the lowest which is 1.9 MPa. The FC and FC+POFA panels have higher strength compared to the C panel which may be due to the existence of gypsum layer as the sandwich layer in these two panels. The gypsum layers also possess high strength when applied to axial load. According to Fang (2013) [17], the gypsum cube achieved a high strength when it underwent cube test. Hence, the existence of the gypsum layer will also affect the axial compressive strength of the panels.
0 0.1 0.2 0.3 0.4 0.5 0.6 0.7 0.8 0.91 1.1 1.2 1.3 1.4 1.5 1.6 1.7 days
7 28 days
1.57 1.4 1.65 1.63
Av er ag e Co m pr ess ive Str en gt h M Pa ( )
Age
C
Construction Materials and Technology Series 1 2018 ISBN 978-967-2183-19-8
[image:12.597.100.465.95.324.2]42
Figure 3.10: Axial compressive strength for various types of panels at 28 days
HEAT TRANSFER TEST RESULTS
In order to observe the variation of temperature over time at exterior and interior surface of PCSP in a detailed manner, the results are interpreted in Figure 3.11, Figure 3.12 and Figure 3.13 respectively. The figures also show the temperature difference between the exterior and interior surface of specimen, which indicates the thermal-insulating performance of specimens. Namely, the larger the temperature difference’s value of the specimen, the better the thermal-insulating performance.
Figure 3.11: Recorded variation of temperature over time of C specimen
According to Figure 3.11, the temperature of exterior surface of C specimen increase sharply at the first 60 minutes and after that the rate of temperature gradually increase until it became
0 0.5 1 1.5 2 2.5 3 3.5
C FC FC+POFA
1.9
2.35 3.3
Axi al Co m pr ess ive Str en gt h (M Pa)
Type of Specimens
0 5 10 15 20 25 30 35 40 45 50 55 60 65 70 75 80 85 90 95
[image:12.597.140.464.468.693.2]Construction Materials and Technology Series 1 2018 ISBN 978-967-2183-19-8
43
constant at 88.3°C after 360 minutes. Meanwhile, the temperature of interior surface of C specimen increase slowly until it reached temperature around 43.7°C, which remains constant after 360 minutes. The temperature difference between the two surfaces of C specimen after 8 hours is 44.6°C. This temperature difference indicates the thermalinsulating performance of C specimen which will later be compared to others two specimens.
In the other hand, Figure 3.12 shows the steep increase of temperature at exterior surface of FC specimen in the first 60 minutes which then gradually increased until it remained constant at 88.6°C after 390 minutes. Beside that, the temperature of interior surface of FC specimen also gradually increase from 0 minutes to 330 minutes and after that it remained steady at 41.4°C. After 8 hours exposed to the halogen lamp, the temperature difference of FC specimen is 47.2°C, which is 2.8°C higher than the C specimen.
[image:13.597.137.462.274.482.2]
Figure 3.12: Recorded variation of temperature over time of foamed concrete (FC), sandwiched with gypsum board
[image:13.597.143.459.529.731.2]
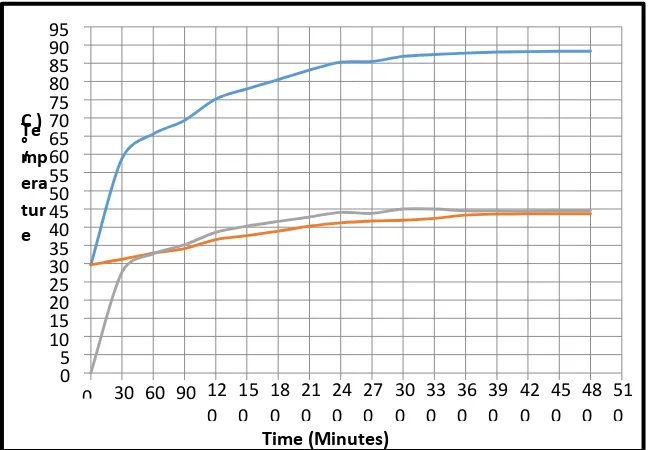
Figure 3.13: Recorded variation of temperature over time of foamed concrete with additives of POFA (FC+POFA), sandwiched with gypsum board
0 5 10 15 20 25 30 35 40 45 50 55 60 65 70 75 80 85 90 95
0 30 60 90 12 0 15 0 18 0 21 0 24 0 27 0 30 0 33 0 36 0 39 0 42 0 45 0 48 0 51 0 Te mp era tur e ° ( C ) Time (Minutes) 0 5 10 15 20 25 30 35 40 45 50 55 60 65 70 75 80 85 90 95
Construction Materials and Technology Series 1 2018 ISBN 978-967-2183-19-8
44
From the Figure 3.13, the temperature of the exterior surface of FC+POFA specimen also possessed the same characteristics as C specimen and FC specimen which increased rapidly in the first 60 minutes. The temperature of the exterior surface of this specimen increased slowly between 60 minutes and 420 minutes. After that, the temperature remained constant at value around 40.7°C. In this case, the temperature difference of FC+POFA specimen is 48.0°C, which is the highest value compared to C and FC specimen.
Based on Figures 3.11, 3.12 and 3.13, it can be clearly seen that the temperature at the exterior surface for three specimens experienced sharp increase in the first 60 minutes. Then, the rate of increase for the temperature of exterior surface become slower after 60 minutes which implies that the exterior surface and the surrounding has gradually approach thermal equilibrium [23].
[image:14.597.110.491.285.376.2]
Table 3.7: Temperature difference of exterior and interior surface of specimens after 8 hours radiation
Specimens Average Temperature ( °C )
Exterior Surface
Interior
Surface Difference
C 88.3 43.7 44.6
FC 88.6 41.4 47.2
FC + POFA 88.7 40.7 48.0
In order to clearly observe and compare the value of temperature difference for the three specimens, Table 3.7 had summarized the results of heat transfer test after exposed the specimens under halogen lamp for 8 hours. The temperature of the interior surface for the three specimens show significant difference; FC+POFA specimen has the greatest temperature difference of 48.0°C compared to the other specimens. The temperature difference for FC+POFA is 3.4°C and 0.8°C higher than the C specimen and FC specimen respectively. Since the temperature difference indicates the thermal-insulating performance of the PCSP design, hence FC+POFA specimen has the better thermal insulation performance compared to C and FC specimens.
The temperature difference of FC specimen is 2.6°C higher than C specimen which may due to existence of gypsum layer at the middle of PCSP design. The study of Zhou, Wong & Lau, (2014) [3] had also proved that inclusion of gypsum layer in the PCSP design can efficiently reduce the heat transfer to interior surface of wall and so improve the thermal insulation performance in a building. In the other hand, the temperature difference FC+POFA specimen is 0.8°C higher than the FC specimen which may due to the addition of POFA in the concrete mixture. This result implies that addition of 30% of POFA in concrete mixture can improve the thermal insulation performance of a building.
Construction Materials and Technology Series 1 2018 ISBN 978-967-2183-19-8
45
3.4 CONCLUSIONS AND RECOMMENDATIONS
Based on the laboratory results, the following conclusions can be drawn:
a. Addition of 30% of POFA in the foamed concrete decrease the workability and consistency but increased the stability and also the compressive strength of the concrete.
b. The temperature difference of exterior and interior surface of C specimen after 8 hours exposed to halogen lamp is 44.6°C.
c. Temperature difference of exterior and interior surface for FC panel after 8 hours is 47.2°C. d. Temperature difference of exterior and interior surface for FC panel after 8 hours is 48.0°C. e. In this study, temperature difference indicates the thermal-insulating performance of the
PCSP designs. From this study, the results had showed that temperature difference of FC+POFA specimen is the highest and is 3.4°C higher than the C specimen.
f. Meanwhile, FC specimen is 2.6°C higher than the C specimen. Hence, in this study, FC+POFA specimen has the highest thermal-insulating performance and follow by FC specimen. . The 3.4°C and 2.6°C drop of temperature in FC+POFA specimen and FC specimen compared to the normal wall design can lead to a significant reduction of the electricity consumption in the air-conditioning system.
The laboratory work on foamed concrete incorporated with POFA is still limited. But it still promises a great scope for future studies. There are certain aspects related to the thermal properties of foamed concrete incorporated with POFA need to be further study and investigate, which are:
a. It is hope that future study can look into different cement-sand ratio and water-cement ratio on the thermal performance of PCSP as the present study using a constant cement-sand ratio of 1:2 and water-cement ratio of 0.5 .
b. It would be desirable for future work to investigate the effect of different percentage of POFA to thermal properties of PCSP.
c. The present experimental study on thermal properties only limited to one density, which is 1000kg/m3. Future studies should give greater emphasis on different densities as well.
Construction Materials and Technology Series 1 2018 ISBN 978-967-2183-19-8
46 REFERENCES
[1] P. I. Finsen and C. P. Georgia, “High-Performance , Integrated Architectural and Structural
Solutions,” Sustain. Precast Concr. Des. Prod. Constr., 2011.
[2] R. Yunus and J. Yang, “Sustainability Criteria for Industrialised Building Systems (IBS) in
Malaysia,” Procedia Eng., vol. 14, pp. 1590–1598, 2011.
[3] A. Zhou, K. W. Wong, and D. Lau, “Thermal Insulating Concrete Wall Panel Design For
Sustainable Vuilt Environment,” Sci. World J., vol. 2014, 2014.
[4] J. R. Mackechnie and T. Saevarsdottir, “New Insulating Precast Concrete Panels,” University
of Canterbury, Christchurch, New Zealand, 2007.
[5] A. Benayoune, A. A. Abdul Samad, D. N. Trikha, A. A. Abang Abdullah, and A. M. Akhand, “Precast Reinforced Concrete Sandwich Panel as an Industrialised Building System,” in International Conference On Concrete Engineering and Technology, 2004, p. 6.
[6] D. G. Tomlinson, “Behaviour of Partially Composite Precast Concrete Sandwich Panels
Under Flexural and Axial Loads,” Queen’s University, Kingston, Ontario, Canada, 2015.
[7] I. Ahmad and N. Mohamad, “Structural Behaviour of Precast Lightweight Foamed Concrete
Sandwich Panel under Axial Load : An Overview,” 2012.
[8] M. Zawawi, “Effectiveness of industrialised building system (IBS) implementation for
Malaysian construction industry,” University Teknologi Malaysia, 2009.
[9] K. A. Gelim, “Mechanical and physical properties of fly ash foamed concrete,” University of
Tun Hussein Onn Malaysia, 2011.
[10] B. Geeta, S. S. Bhadauria, and A. Saleem, “A Review: Recent Innovations in Self
Compacting Concrete,” Int. J. Sci. Eng. Res., vol. 4, no. 1, pp. 1993–2002, 2013.
[11] N. S. Mahadi, “Study On Precast Lightweight Foamed Concrete Sandwich Panel (PLFP)
Connection Under Flexural Load,” University of Tun Hussein Onn Malaysia, 2013.
[12] A. O. Mydin and N. Noordin, Mechanical , Thermal and Functional Properties of Green Lightweight Foamcrete, vol. 19, no. 1. Romania: Eftimie Murgu University of Resita, 2012.
[13] T. J. Deepak, A. Elsayed, N. Hassan, C. N., S. Yun Tong, and M. B.M., “Investigation on
Properties of Concrete with Palm Oil Fuel Ash as Cement Replacement,” Int. J. Sci. Res. Publ., vol. 3, no. 1, pp. 138–142, 2014.
[14] E. Aminudin, M. F. Din, M. W. Hussin, Y. Ichikawa, and N. Hiroshiba, “Agro-Industrial
Aerated Concrete : Insulation for Thermal Reduction in Building,” in International Conference on Chemical, Biological, and Environmental Sciences, 2014, pp. 12–15.
[15] A. Vimmrov?? and et al, “Lightweight gypsum composites: Design strategies for
Construction Materials and Technology Series 1 2018 ISBN 978-967-2183-19-8
47
[16] K. H. Boon, L. Y. Loon, and D. Y. E. Chuan, “Compressive Strength and Shrinkage of
Foamed,” pp. 1–8, 2006.
[17] J. Xu and T. Fang, “Experimental study on combustion characteristics for
polyurethanealuminum composite insulation material under different heat fluxes,” Elsevier B.V., 2013.
[18] A. R. Muthalib, (2014). “Strength Development Of Foamed Concrete”. Retreived on May 2017 from http://dspace.poliku.edu.my/xmlui/bitstream/handle/123456789/1126/journal paper- strengthdevelopmentoffoamedconcrete.pdf?sequence=1
[19] O. Y. Lim, “Engineering Properties of Lightweight Foamed Concrete Incorporated with Palm
Oil Fuel Ash (POFA),” 2013.
[20] M. H. Ahmad and et, “Compressive Strength of Palm Oil Fuel Ash Concrete,” ICCBT 2008, vol. 27, no. February 2016, pp. 297–306, 2008.
[21] Abdullah and et al, “Pofa : a Potential Partial Cement Replacement Material in Aerated
Concrete,” in 6th Asia Pacific Structural Engineering and Construction (APSEC 2006), 2006.
[22] A. Munir and et al, “Utilization of palm oil fuel ash ( POFA ) in producing lightweight
foamed concrete for non-structural building material,” Procedia Eng., vol. 125, pp. 739–746, 2015.