Journal of Chemical and Pharmaceutical Research, 2014, 6(7):1667-1675
Research Article
CODEN(USA) : JCPRC5
ISSN : 0975-7384
Optimization of extraction process of hypericin from St. John’s Wort
by central composite design-response surface methodology
Xing Wang*, Jia Mi, Yu Dong and Juan Yang
School of Life Science and Engineering, Southwest Jiao-Tong University, Chengdu, Sichuan, China
_____________________________________________________________________________________________
ABSTRACT
The aim of present work was to find out the optimum combination of extraction process variables of hypericin from St. John’s wort, by revealing the mathematical functional relation of extraction temperature, ethanol concentration for the extraction yield, and to develop a validated HPLC method to determine hypericin in St. John’s wort extracts prepared. The HPLC separation was performed on a Luna C18 column (4.6 mm×250 mm, 5µm particle) using a
mobile phase consisting of 2.5g•L-1 KH2PO4- methanol (5:95 v/v) eluted in an isocratic mode, a flow rate of 1.0
ml/min, and a detection wavelength of 588 nm. The method is validated with respect to accuracy, precision, linearity, and limits of detection and quantitation. The experiments were carried out according to a five-level, two-factor Central Composite Design (CCD) with extraction temperature and ethanol concentration as variables while extraction yield as response. The optimum process was obtained through response surface methodology (RSM) based on the mathematical model established according to the experimental data, i.e. extraction temperature: 90 °C; ethanol concentration: 77%. Under the conditions above, the mean value of observed extraction yields(n=3) was 0.6767 mg/g of St. John’s wort powder tested, with the deviation of 1.7% from the predicted value of 0.6654, which demonstrated that the mathematical model established in this study has satisfactory predictability. On the basis of result obtained, it was concluded that central composite design is a good approach to optimize the extraction of St. John’s wort.
Key words: St. John’s wort; Extraction process; HPLC; Central composite design; Response surface methodology _____________________________________________________________________________________________
INTRODUCTION
St. John’s wort (Hypericum perforatum L.), a herbaceous perennial plant, belonging to Europe, Asia, and North
Africa, naturalized to North and South America and Australia, has become one of the leading plant−based dietary supplements worldwide. The Greeks and the Romans documented its medicinal use in the treatment of nerve−related disorders in antiquity. Nowadays the use of Hypericum extracts is concerned mainly with anti−depressive applications (1-4).
As acting as an alternative herb medicine for the treatment of depression, St. John’s wort has been found to be superior to placebo and equivalent to standard antidepressants for the treatment of mild to moderate depression. The randomized controlled studies have also provided evidence that Hypericum perforatum extracts are as effective as standard antidepressants in mild− to−moderate depression (4).
What’s more, St. John’s wort extracts are used not only as herbal medicinal products but also as a top−selling botanical dietary supplement by standardised using the naphthodianthrones of the hypericin group, calculated as 0.2−1 mg hypericin daily dose. Finally, St. John’s wort preparations have recently been used as an ingredient in some food products sold as functional foods (5).
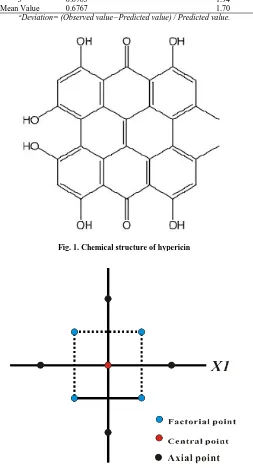
reactive oxygen species upon photo-activation, which can cause damage to areas of the body exposed to light (7-9). In addition, many of the more common plant constituents (e.g., flavonoids and flavonoid derivatives, xanthone derivatives, amentoflavone, biapigenin, volatile oil) present in St.John’s wort have been found to possess antioxidant activity, and thus it may be possible that the oxidative damage produced by hypericin can be mediated through ROS scavenging by these constituents present in preparations made from St.John’s wort extract (10-11). However, most available St. John’s wort formulations are now standardized to include hypericin and hyperforin because these constituents have been researched the most extensively. The structure of hypericin is shown in Fig. 1.
Considering the upsurge interest and increasing market demand for St.John’s wort extracts, this work aimed to develop a rapid HPLC assay method to quantify the hypericin in St.John’s wort extracts, and then, to optimize the extraction process of hypericin from St.John’s wort by HPLC, using response surface methodology.
EXPERIMENTAL SECTION
Materials
Hypericin (purity>98%) was purchased from Xi’an xiaocao botanical Co., Ltd. (Shanxi, China). The commercial dried aerial parts of St. John’s wort (Hypericum perforatum L.) were obtained from Chengdu herb market (Chengdu, China) and authenticated by department of Pharmacognosy, School of Life Science and Engineering, Southwest Jiaotong University, pulverized and sieved through a 100−mesh sieve before use. Methanol and potassium dihydrogen phosphate were of HPLC grade and were purchased from Kemiou Co., Ltd. (Tianjin, China). All other reagents or solvent were of analytical grade. Water was purified by a Milli Q plus system from Millipore (Bedford, MA, USA).
HPLC assay
Chromatography conditions
Hypericin was quantified using a Shimadzu HPLC system (Tokyo, Japan) consisting of a Shimadzu LC−20AT pump, a Shimadzu spectrophotometric detector SPD−20A, a 20−µL sample loop, a manual injector, a column heater, and a Luna C18 column (4.6mm×250 mm, 5 µm particle) (Phenomenex, Guangzhou, China). Chromato solution Light software package was used for data analysis and processing.
For the preparation of the mobile phase, 2.5 g potassium dihydrogen phosphate was diluted and filled up to 1000 mL with ultrapure water. A 50−mL volume of this aqueous solution was combined with 950 mL methanol to constitute the mobile phase (12). The detection wavelength was 588nm. The flow−rate was 1.0 mL/min. The analytical column was kept at 30 °C. The substances were quantified using peak area.
Preparation of standard stock solutions
Stock solution of 50 µg· mL-1 of hypericin was prepared in a mixed solvent (methanol−pyridine, 9:1, v/v), into a 25−mL brown volumetric flask. The solution was stored at 4 °C.
Preparation and assay of Sample solution
About 25 g of the St. John’s wort powder was accurately weighed, transferred into a 500−mL round bottom flask containing 250 mL of the ethanol−water mixture of corresponding concentration, and extracted for 120 min by heat−recirculation extraction at the corresponding temperature (the corresponding ethanol concentration and extraction temperature of each experimental run were shown in Table Ⅱ). The extract solution was filtered through
cellulose paper by vacuum filtration into a 250−mL volumetric flask. The round bottom flask was rinsed with extra ethanol and the washings were passed through the same filter to bring the filtrate to the graduation volume of the volumetric flask. The solution was passed through a 0.45 µ m millipore filter, and 10 µL of the filtered sample solution was injected into the HPLC system. The whole procedure was performed under strict exclusion of light.
Assay and validation
The linearity of detector response to different concentrations of hypericin was evaluated by preparing standard solutions at six different levels ranging from 5µg · mL-1 to 50 µg ·mL-1. The assays were processed in triplicate on a daily basis. Standard curve of peak area versus concentration was plotted. The linear regression equation and the linear range of six of hypericin were determined using the developed HPLC method.
The sample solution was put in the dark at 4 °C and brought to room temperature for analysis on three consecutive days (24, 48 and 72 h) to observe the stability of sample solutions, the procedure was performed six times every day, and the intra−and inter−day RSD was calculated.
The intra−and inter−day variations were chosen to determine the precision (reproducibility) of the method, respectively. For intra−day variability tests, the standard solutions were analyzed six times at three different amounts within one day, while for inter−day variability tests, the samples were examined in triplicate on three consecutive days. Accuracy was defined as the percentage difference between the observed concentration and calculated amount of hypericin, and was always expressed as recovery. The recovery was determined by adding a known amount (low, medium and high level of 1, 2, 3 µL of stock solution) of hypericin standard to the sample solution prepared. The mixture was analyzed using the sample assay method mentioned above.
The hypericin content of each analyte was calculated from the calibration curve. Variations were expressed as the relative standard deviations (RSD, %) and relative errors (RE, %).
Experimental design
A two factor three level Central Composite Design (CCD), which was a simplified representation in analytical form of a given reality, was used for the optimization procedure. As shown in Fig. 2, the design consisted of four factorial points, four axial points (two nearby axial points on the axis were at a distance of 1.414 from the design center) and six center points, leading to 14 sets of experiments (13, 14). This design could provide an empirical second order polynomial model used for prediction of the effect of extraction variables on the extraction yield using a number of experimental runs. In this mathematical approach the experimental response variable Y can be represented by quadratic equation of the response surface as shown in Eq. 1.
Y=b0+b1X1+b2X2+b3X12+b4X22+b5X1X2 (1)
Where Y is the response variable, b0, b1, b2, b3, b4,b5 are the regression coefficients of variables for corresponding
terms, respectively. X1 and X2 are independent variables. The equation enables the analysis of the effects of each
factor and their interactions over the response.
Due to its merits of non−toxicity and easy recovery by reduced pressure, ethanol is widely used as extraction solvent on large industrial scale, at the same time, hypericin shows good dissolubility in ethanol, thus ethanol of different concentrations were used as the extraction solvent in the following study. Generally, extraction temperature, extraction time, solvent volume, and solvent concentration are the effective factors of solvent extraction efficiency. However, the extraction yield always increases with the increase of extraction time and solvent volume, the extraction time and solvent volume seem not the critical factors. Therefore, the extraction temperature (X1) and
ethanol concentration (X2) were chosen as factors in this experimental design. According to our preliminary
experimental results and the principle of CCD, five levels of each factor were defined as shown in Table Ⅰ. The
experimental sets of runs are shown in Table Ⅱ (each set was performed in triplicate, and the mean value was
expressed as the final extraction yield), and the extraction yields of fourteen runs were determined by the HPLC method mentioned above.
Table Ⅰ. The independent variables: factors and levels for CCD
Factors Ranges and levels
−1.41421(−α) −1 0 1 1.41421(+α)
Extraction temperature X1 / °C 50 55.86 70 84.14 90
Ethanol concentration X2 / % 55 60.86 75 89.14 95
RESULTS AND DISCUSSION
HPLC assay validation
Separation and specificity
Hypericin was well separated under the developed HPLC conditions, the retention time was about 15 min for hypericin. Figs. 3−4 show the chromatograms of standard hypericin and aquatic−ethanol extracts of St. John’s wort, respectively.
Limit of detection (LOD) and limit of quantitation (LOQ)
Linearity
The regression equation, with hypericin concentration (µg · mL-1) as independent and peak area(y) as dependent, calculated for the hypericin calibration curve by using linear regression analysis, was y= −4138.24+131658.44x (r=0.99984, n=6, 0.072−0.72µg). The correlation coefficient value indicated satisfactory linear correlation between hypericin amount and its peak area within the test range.
Stability
The RSD of six determinations of the same sample solution within 12 hours was less than 1.73%, which indicated that the sample solution had good stability. Further study showed that sample solutions were stable for at least one week when stored out of light at 4 °C.
Precision and accuracy
The reproducibility (precision) of the proposed method was evaluated: the intra−day RSD ranged 2.0−3.6% (n=6). The inter−day RSD ranged 1.6−4.8% (n=6). The developed method had good accuracy with the mean recovery of 97.7% for hypericin.
The overall results above indicated that this HPLC method was precise, accurate, and sensitive for quantitative determination of hypericin.
Optimization procedure
Fitting of experimental data to the model
The experimental design was performed using Desgn−expert 7.1.3 software (Stat−Ease Co., USA), while the analysis of data was performed by Statistica 7.0 software (StatSoft Co., USA). The experimental results of fourteen runs arranged by the experimental design are shown in Table Ⅱ. The data were fitted to the quadratic model for
response Y using Statistica 7.0 software, and the fitting results are shown in Table Ⅲ. With a confidence level of
95%, the quadratic polynomial model was calculated as Eq. 2, from it, the response factors at any regime within the interval of our experiment design can be calculated.
Y=−3.36786−0.01865X1+0.1176X2+1.13677×10 −4
X1 2
−8.0707×10−4X2 2
+7.53×10−5X1X2 (2)
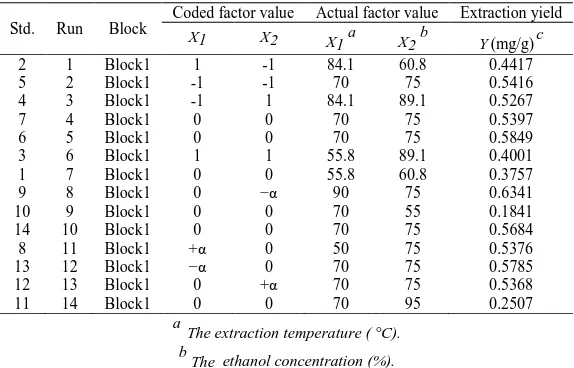
Table Ⅱ. Experimental matrix and results
Std. Run Block
Coded factor value Actual factor value Extraction yield
X1 X2 X1 a X2 b Y (mg/g) c
2 1 Block1 1 -1 84.1 60.8 0.4417
5 2 Block1 -1 -1 70 75 0.5416
4 3 Block1 -1 1 84.1 89.1 0.5267
7 4 Block1 0 0 70 75 0.5397
6 5 Block1 0 0 70 75 0.5849
3 6 Block1 1 1 55.8 89.1 0.4001
1 7 Block1 0 0 55.8 60.8 0.3757
9 8 Block1 0 −α 90 75 0.6341
10 9 Block1 0 0 70 55 0.1841
14 10 Block1 0 0 70 75 0.5684
8 11 Block1 +α 0 50 75 0.5376
13 12 Block1 −α 0 70 75 0.5785
12 13 Block1 0 +α 70 75 0.5368
11 14 Block1 0 0 70 95 0.2507
a
The extraction temperature ( °C). b
The ethanol concentration (%). c
Weight hypericin / weight St. John’s wort powder (mg/g).
Table Ⅲ. Regression equations obtained for Y (for actual factor value)
Model
Style Regression Model R-quare F−value P−value
Quadratic Y = −3.36786 − 0.01865X1 + 0.117589X2 +1.13677×10−4 X12 − 8.0707×10−4X22 + 7.52985×10−5
X1X2 0. 97664 861.5039 <0.0001
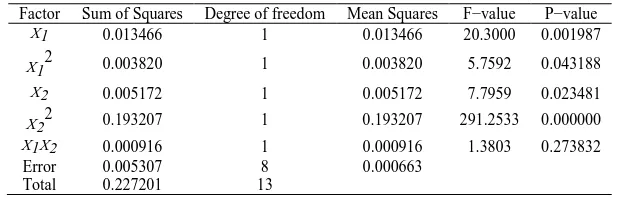
Analysis of variance (ANOVA) and model validation
The coefficients of the nonlinear polynomial model (Eq. 2), and their t-values and p-values are shown in Table Ⅳ,
[image:4.595.163.450.436.620.2]2
squares, degree of freedom, mean squares, F-value, p-value of the regression) were examined as shown in Table Ⅴ.
Experimental results and the predicted values obtained from model (Eq. 2) are given in Fig. 5. As can be seen, the predicted values match the experimental values well with R-square of 97.6% for response Y. Fig. 6 depicts the residual plots for Y in the model (Eq. 2), it shows that the distribution of the residuals for the response approximately follows the fitted normal distribution and the residuals of the response randomly scatter in the residual plots.
Table Ⅳ. Estimated regression coefficients for Y (Level of confidence: 95.0%, alpha=0.05)
Term Coefficients Standard
error t−value df=8 p−level Lo. Conf Limit Up. Conf Limit
Constant −3.36786 0.495506 −6.7968 0.000138 −4.51050 −2.22523
X1 −0.01865 0.008213 −2.2707 0.052829 −0.03759 0.00029
X2 0.11759 0.008417 13.9703 0.000001 0.09818 0.13700
X12 0.00011 0.000047 2.3998 0.043188 0.00000 0.00022
X22 −0.00081 0.000047 −17.0661 0.000000 −0.00092 −0.00070
X1X2 0.00008 0.000064 1.1749 0.273832 −0.00007 0.00022
Table Ⅴ. Analysis of variance for Y
Factor Sum of Squares Degree of freedom Mean Squares F−value P−value
X1 0.013466 1 0.013466 20.3000 0.001987
X12 0.003820 1 0.003820 5.7592 0.043188
X2 0.005172 1 0.005172 7.7959 0.023481
X22 0.193207 1 0.193207 291.2533 0.000000
X1X2 0.000916 1 0.000916 1.3803 0.273832
Error 0.005307 8 0.000663
Total 0.227201 13
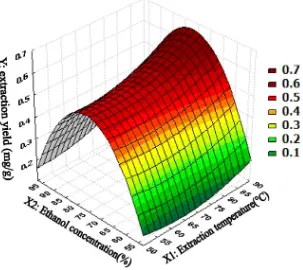
Response surface (contour) plots
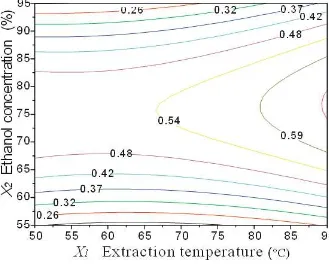
In order to gain insight about the effect of each variable, the three−dimensional surface and contour showing the influence of independent variables X1 and X2 upon the response Y were respectively depicted in Fig. 7 and Fig. 8.
Optimization of extraction condition
As shown in Eq.2, coefficients with one factor represent the effect of that particular factor on response while the coefficients with more than one factor and those with second order terms represent the interaction between those factor and the quadratic nature of the phenomena, respectively. Positive sign in front of the terms indicates synergistic effect while negative sign indicates antagonistic effect upon the response. Therefore, from the Eq.2, it
can be qualitatively concluded that X2, X1
2
, and the interaction between X1 and X2 had synergistic effects on
the response of Y, on the contrary, X1 and the quadratic term of X22 had antagonistic effects. X2 was the most
important parameter to affect the extraction yield, followed by X1, X 2and X12.
The response surface and contour plots shown in Fig. 7 and Fig. 8 demonstrate that, the extraction yield (Y) is increasing at first, then decreasing with the increase of ethanol concentration at the range of 55%−95%; the extraction yield (Y) is increasing slowly and continuously with the increase of extraction temperature at the range of 50 °C−90 °C. The response surface has the maximum point where X1=90. Therefore, the optimum ethanol concentration(X2) can be found depending on Eq.3.
Response optimization results of the nonlinear polynomial model are as follows: the response Y presents the predicted maximum value 0.6654 at the optimum parameters of X1 (90), X2 (77), i.e. extraction yield shows
[image:5.595.131.479.184.276.2] [image:5.595.151.460.303.402.2]Validation of the optimum condition
To compare the observed extraction yield with the predicted one, experimental rechecking was performed under the deduced optimum extraction conditions shown in Table Ⅵ. A mean value of 0.6767 mg hypericin/g St. John’s wort
powder(n=3) obtained from actual experiments, with a low percentage of bias from the predicted one, showed that the observed value matched the predicted value reasonably well, and it could be concluded that the mathematical model was chosen correctly and that the model had satisfactory predictive power.
Table Ⅵ. Validation test results based on optimized extraction condition (n=3)
No. Observed values (mg/g) Predicted value (mg/g) Deviation (%) a
1 0.6712
0.6654
0.87
2 0.6807 2.30
3 0.6783 1.94
Mean Value 0.6767 1.70
aDeviation= (Observed value−Predicted value) / Predicted value.
[image:6.595.173.438.175.230.2]Fig. 1. Chemical structure of hypericin
Fig. 2. Schematic diagram of central composite design (CCD) as a function of X1 and X2 according to the 22 factorial design with four
[image:6.595.182.435.217.685.2]Fig. 3. Hypericin reference standard
Fig. 4. A typical HPLC chromatogram of aquatic−ethanol extracts of St. John’s wort
Fig. 6. Residual plots for Y (extraction) in the model (Eq.2)
[image:8.595.158.461.315.585.2]Fig. 8. The contour (2D) plots of Content (Y) X1: Extraction temperature (°C); X2: Ethanol concentration(%)
CONCLUSION
This work used central composite to design the experiment, and it avoid the deficiency of uniform design and orthogonal test that can’t predict the best value of the factor when continuous valued are from an extent range. A HPLC method established in this work was proved to be specific and suitable for routine analysis because of its simplicity and reproducibility. The mathematical model established in this work had satisfactory predictability on St.
John’s wort. extraction yield.
Acknowledgment
This work was supported by Sichuan Province Science and technology support program(No.2013SZ0130). We are
grateful to the Assoc. Prof. from Key Laboratory of Drug Quality Control and Pharmacovigilance, China Pharmaceutical University (CHINA) for the research support.
REFERENCES
[1] Kalb, R., Trautmann−Sponsel, R.D., & Kieser, Pharmacopsychiatry, 2001,34, 96−103.
[2] Witte, B., Harrer, G., Kaptan, T., Podzuweit, H., & Schmidt, U. , Fortschr Med. 1995,113, 404−408. [3] Hänsgen, K. D., Vesper, J., Ploch, M. , J Geriatr Psychiatry Neurol.,1994,7(1), S15−18.
[4] Laakmann, G., Jahn, G., & Schüle, C. , Nervenarzt, 2002, 73, 600−612.
[5] Ang, C. Y., Cui, Y., Chang, H. C., Luo, W., Heinze, T. M., Lin, L. J., & Mattia., J AOAC Int. 2002, 85, 1360−1369.
[6] Chatterjee, S. S., Noldner, M., Koch, E., & Erdelmeier, C. , Pharmacopsychiatry,1998, 31(1), 7−15. [7] Kubin, A., Wierrani, F., Burner, U., Alth, G., & Grunberger, W. , Curr Pharm Des. 2005,11, 233−253.
[8] Park, J., English, D. S., Wannemuehler, Y., Carpenter, S., & Petrich, J. W. , Photochem Photobiol. 1998,68, 593−597.
[9] Schey, K. L., Patat, S., Chignell, C. F., Datillo, M., Wang, R. H., & Roberts, J. E. , Photochem
Photobiol. 2000, 72, 200−203.
[10] Benedí, J., Arroyo, R., Romero, C., & Martín−Aragón, S. Villar AM. ,Life Sci. 2004,75, 1263−1276. [11] Zheng, W., & Wang, S.Y. , J Agric Food Chem. 2001, 47, 5165−5170.