International Journal of Emerging Technology and Advanced Engineering
Website: www.ijetae.com (ISSN 2250-2459,ISO 9001:2008 Certified Journal, Volume 2, Issue 12, December 2012)
598
Experiment and Numeric Analysis of Brick Masonry Wall
with Bracing under Cyclic Loading
C. Remayanti
1, L. Susanti
2Department of Civil Engineering, Faculty of Engineering, University of Brawijaya, Malang, East Java of Indonesia
Abstract- Masonry wall is non-structural element of building which is it’s mechanical behaviour is influenced by the mechanical behaviour of the constituent materials are brick and mortar that can be obtained by conducting research in the laboratory and then can be used to determine the mechanical behaviour brick masonry wall in computing. One way to determine the behaviour of brick masonry is computationally using the numeric method. Modelling techniques with numeric method consists of two types of models of macro models and micro models. The experiment in laboratory use 24 models of masonry walls 1,2 m x 1 m with columns and beams confinement in dimension 7 cm x 7 cm. Models use steel and bamboo bracing. All models were tested monotonic and cyclic loading. The purpose of this study was to determine the effect of the use of bamboo as an alternative to bracing material and to know modelling of brick masonry using numeric method (macro and micro model). This study shows that the addition of either of steel bracing and bamboo on brick masonry wall can increase the strength and stiffness of the wall under cyclic loading.
Keywords- brick masonry, cyclic loading, bracing, numeric methods
I. INTRODUCTION
Brick masonry wall is a non-elastic, non-homogeneous and anisotropic building material, which consists of masonry units and mortar [1]. Mechanical behaviour of brick masonry is influenced by the mechanical behaviour of the constituent materials are brick and mortar [2]. Masonry compression strength is more influenced by the mortar [3]. Some of many ways to understand brick masonry behaviours are with experiment in the laboratory and analysis using numeric method. By performing the experiment we can obtained the mechanical behaviour of brick and mortar and also brick masonry behaviour under cyclic loading. After we obtain the data of mechanical behaviours of brick and mortar then we can use it to perform analyses using numeric method on brick masonry wall. By using numeric method we can obtain the data at points that do not we get at the time of experiment in laboratory. To simplify the finite
element analysis, many researchers studied the
homogeneous between brick and mortar that can be used as a material at numeric analysis.
Some of study of this model that have been done is analysis of brick masonry under axial load [4] and brick masonry analysis using numeric homogenized analysis [5]. This homogenize modelling are know as macro model. Experiment and numeric analysis is conducted to brick masonry with bracing to improve the capability of masonry [6]. In general bracing use steel as material, but also can be used alternative material that is cheaper but can provide good capacity such as bamboo [7].
The objectives to be achieved from this study is modelling brick masonry wall in laboratory and in numeric so it can be obtained displacement, stress and strain from brick masonry under cyclic loading. From the data obtained it can be used to compare the result between experiment and numeric analysis, macro and micro model. Furthermore it can be seen the influence of using bracing at brick masonry and the differences between using bamboo and steel as bracing material.
II. MATERIALS AND METHODS
Numeric Model
Two kind of basic approaches have been developed with the purpose to make an appropriate approach for masonry structures, the discrete model and continuous model. Discrete model as well known as heterogenetic model or micro model is a model which units and mortar accounted separately [8]. As for continuous model or homogeneous model or macro model is a model which units, mortar and interface presented by an equivalent continuum [9].
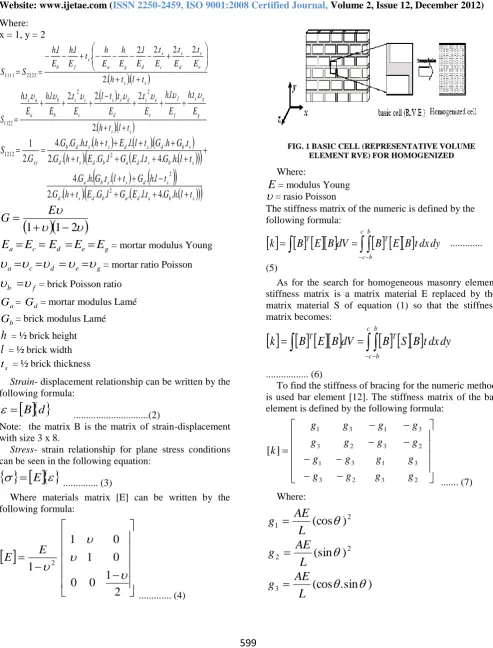
There is some homogenization procedures has been conducted by researchers, one of them is the homogenization procedure by PB Lourenco and A. Zucchini. Initial step of this technique is to take the RVE / cell basic [10] which can be seen in Figure 1. By following Lourenco’s homogenization, Rivieccio can obtain the matrix properties / material homogeneous cell as follows [11]:
1212 2222
1122
1122 1111
0
0
0
0
S
S
S
S
S
S
International Journal of Emerging Technology and Advanced Engineering
Website: www.ijetae.com (ISSN 2250-2459,ISO 9001:2008 Certified Journal, Volume 2, Issue 12, December 2012)
599
Where: x = 1, y = 2
s
se s d s c s d g a s f b t l t h E t E t E t E l E h E h t E l h E l h S S . . 2 . 2 . 2 . 2 . 2 . . . 2222 1111
s sg g s f f e e s d d s s c c s b b a a s t l t h E t h E l h E t E t t l E t E l h E t h S . . 2 . . . . . . 2 . . . 2 . . 2 . . .
. 2 2
1122
s
d b a
d s b
s
d s d s s b a s b s d a b d s d s b d s d s s d b xy
t
l
h
G
t
l
E
G
l
G
E
t
h
G
t
l
h
G
t
l
t
G
h
G
t
l
h
G
t
l
E
G
l
G
E
t
h
G
t
G
h
G
t
l
l
E
t
h
t
h
G
G
G
S
.
.
.
4
.
.
.
.
.
.
.
.
2
.
.
.
.
.
.
.
4
.
.
.
4
.
.
.
.
.
.
.
2
.
.
.
.
.
.
.
.
.
.
4
.
2
1
2 2 2 1212
2
1
1
E
G
g e d ca
E
E
E
E
E
= mortar modulus Youngg e d c
a
= mortar ratio Poissonf b
= brick Poisson ratioa
G
=G
d= mortar modulus Laméb
G
= brick modulus Laméh
= ½ brick heightl
= ½ brick widths
t
= ½ brick thicknessStrain- displacement relationship can be written by the following formula:
B
d
...(2)Note: the matrix B is the matrix of strain-displacement with size 3 x 8.
Stress- strain relationship for plane stress conditions can be seen in the following equation:
E
... (3) [image:2.595.49.543.119.768.2]Where materials matrix [E] can be written by the following formula:
2
1
0
0
0
1
0
1
1
2
E
E
... (4)FIG. 1 BASIC CELL (REPRESENTATIVE VOLUME ELEMENT RVE) FOR HOMOGENIZED
Where:
E
= modulus Young
= rasio PoissonThe stiffness matrix of the numeric is defined by the following formula:
c c b b T Tdy
dx
t
B
E
B
dV
B
E
B
k
...(5)
As for the search for homogeneous masonry element stiffness matrix is a matrix material E replaced by the matrix material S of equation (1) so that the stiffness matrix becomes:
c c b b T Tdy
dx
t
B
S
B
dV
B
E
B
k
... (6)To find the stiffness of bracing for the numeric method is used bar element [12]. The stiffness matrix of the bar element is defined by the following formula:
2 3 2 3 3 1 3 1 2 3 2 3 3 1 3 1]
[
g
g
g
g
g
g
g
g
g
g
g
g
g
g
g
g
k
... (7) Where: 2 1(cos
)
L
AE
g
2 2
(sin
)
L
AE
g
)
sin
.
(cos
3
International Journal of Emerging Technology and Advanced Engineering
Website: www.ijetae.com (ISSN 2250-2459,ISO 9001:2008 Certified Journal, Volume 2, Issue 12, December 2012)
600
A = surface area of bracing E = modulus elasticity of bracing L = length of bracing
= angle of bracingExperiment model
Research brick masonry wall conducted in the laboratory and computationally. The model masonry wall has a length of 134 cm, 114 cm wide. While the bricks used a length of 10 cm, width 7 cm and height 5 cm. Mortar that are used with 1 cm thick. The research model can be seen in Figure 2.
Experiment and analysis conducted by computing consists of three types: model without bracing, model with steel bracing and model with bamboo bracing.
Analysis were performed to obtain stress, strain and displacement. Firstly, the model in laboratory will be test under monotonic load and then under cyclic load.
Nodal number that will be the nodal load is two which is located on the top right and left. Nodal loads will be given alternately from the left end first and then the far right. Given load consists of several stages. Ultimate load by 20% (derived from research data) for stage 1, 40% for stage 2 and so on unti it reaches the ultimate load. For example: in stage 1, the initial load is 0 then given ½ from 20% ultimate load then the load up to 20% and then the load back to half of 20% ultimate load and eventually to 0. For the experiment, each stage consisted of 6 cycles.
FIG 2. THE MODEL OF BRICK MASONRY WALL WITH BRACING
For numeric analysis, the model has to discretization and the material properties and other data which need to perform the analysis are obtained from experimental results.
III. RESULTS AND DISCUSSION
Experiment Results
Material properties obtained from material research can be seen at the Table 1. Firstly, monotonic testing is performed on each model to obtain the maximum load, it can be seen at Table 2.
Data monotonic test results that have been obtained previously used as a reference in determining the cyclic loading stage.
International Journal of Emerging Technology and Advanced Engineering
Website: www.ijetae.com (ISSN 2250-2459,ISO 9001:2008 Certified Journal, Volume 2, Issue 12, December 2012)
[image:4.595.155.429.129.650.2]601
TABLE 1 MATERIAL PROPERTIES
Material Modulus elasticity Poisson ratio A
Brick 386.3 Mpa 0.2
Steel 200000Mpa 35.27 mm2
Bamboo 30000Mpa 64 mm2
Concrete 17647.6 Mpa 0.16
Mortar 879.3 Mpa 0.2
TABLE 2
EXPERIMENT UNDER MONOTONIC LOAD
Model type Output
Model without bracing
Load max.
x direction displacement max.
Model with steel bracing
Load max.
x direction displacement max.
Model with bamboo bracing
Load max.
x direction displacement max.
16.2 KN 11.272 mm
18.36 KN 8.219 mm
[image:4.595.193.404.393.656.2]19.98 KN 23.567 mm
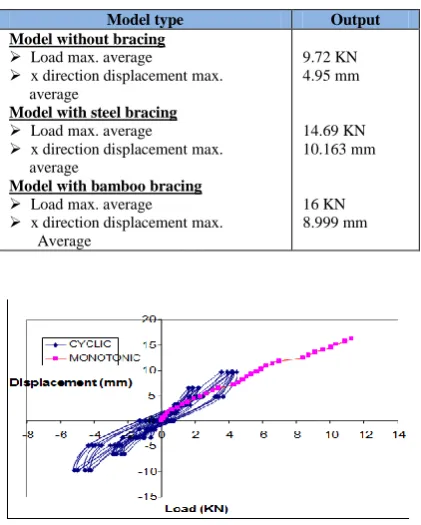
TABLE 3
EXPERIMENT UNDER CYCLIC LOADING
Model type Output
Model without bracing
Load max. average
x direction displacement max. average
Model with steel bracing
Load max. average
x direction displacement max. average
Model with bamboo bracing
Load max. average
x direction displacement max. Average
9.72 KN 4.95 mm
14.69 KN 10.163 mm
16 KN 8.999 mm
International Journal of Emerging Technology and Advanced Engineering
Website: www.ijetae.com (ISSN 2250-2459,ISO 9001:2008 Certified Journal, Volume 2, Issue 12, December 2012)
[image:5.595.185.417.142.279.2]602
FIG. 4 GRAPH RELATION LOAD-DISPLACEMENT MODEL WITH STEEL BRACING
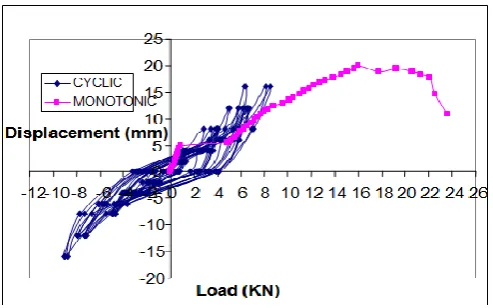
FIG. 5 GRAPH RELATION LOAD-DISPLACEMENT MODEL WITH BAMBOO BRACING
In the model of the steel bracing with cyclic loading, wall strength increased 13.33% and the displacement 93.34% less than model without bracing.
The addition of bamboo bracing adds strength to the wall 29.73% and displacement 32.23% smaller than model without bracing.
Numeric Analysis Results
After the discretization on the model test is obtained the following data
TABLE 4
RESULTS OF MODEL DISCRETIZATION
Macro model Micro model
1 2 3
Number of element Number of nodes
Number of degree of freedom (d.o.f)
672 725 1450
[image:5.595.175.422.313.467.2]International Journal of Emerging Technology and Advanced Engineering
Website: www.ijetae.com (ISSN 2250-2459,ISO 9001:2008 Certified Journal, Volume 2, Issue 12, December 2012)
603
Analytical results (output) are displacement generated each nodal point. In the discussion will ony taken one nodal point of observation alone as the representative of the results of other analysis.
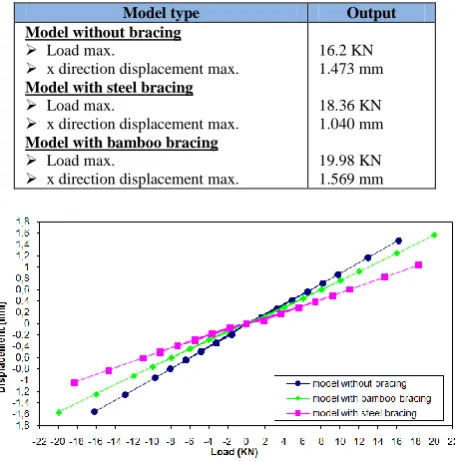
The results for macro model are shown in Table 5 and Figure 6. Through Table 5 can be seen that the x direction displacement model without bracing with maximum load (Pmax) 16.2 kN reached 1.4731 mm while the model with steel bracing with Pmax 18.36 kN reached 1.0403 mm and model with bamboo bracing with Pmax. 19.98 kN reached 1.5686 mm.
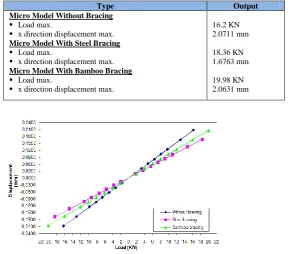
This means that with the addition of bracing with different load conditions the x direction displacement of model with steel bracing 29.38% smaller than model without steel bracing and the x direction displacement of model bamboo bracing 6.48% greater than model without bracing. The results for micro model are shown in Table 6 and Figure 7. From Table 6 can be seen that the x direction displacement model without bracing with maximum load (Pmax) 16.2 kN reached 2.0711 mm while the model with steel bracing with Pmax 18.36 kN
reached 1.6763 mm and model with bamboo bracing with Pmax. 19.98 kN reached 2.0631 mm.
This means that with the addition of bracing with different load conditions the x direction displacement of model with steel bracing 19.07% smaller than model without steel bracing and the x direction displacement of
model bamboo bracing 0.39% smaller than model
without bracing.
[image:6.595.185.413.424.655.2]Differences in number of elements and assuming the use of the material at the macro and micro model influence the results of analysis. The greater number of elements in numeric analysis can give more accurate results. For example, it will be compared to the x direction displacement of the macro and micro models without bracing. This comparison is shown in Figure 8. The x direction displacement macro model without bracing with maximum load (Pmax) 16.2 kN reached 1.4731 mm while the micro model without bracing reached 2.0711 mm. This means that the micro models displacement has a difference 40.73% compared to the macro models.
TABLE 5
MODEL MACRO ANALYTICAL OUTPUT WITH CYCLIC LOADING AT NODE NUMBER 64
Model type Output
Model without bracing
Load max.
x direction displacement max.
Model with steel bracing
Load max.
x direction displacement max.
Model with bamboo bracing
Load max.
x direction displacement max.
16.2 KN 1.473 mm 18.36 KN 1.040 mm 19.98 KN 1.569 mm
International Journal of Emerging Technology and Advanced Engineering
Website: www.ijetae.com (ISSN 2250-2459,ISO 9001:2008 Certified Journal, Volume 2, Issue 12, December 2012)
[image:7.595.153.446.160.414.2]604
TABLE 6
[image:7.595.181.414.456.590.2]MODEL MICRO ANALYTICAL OUTPUT WITH CYCLIC LOADING AT NODE NUMBER 1460
FIG. 7 GRAPH RELATION LOAD-DISPLACEMENT MICRO UNDER CYCLIC LOADING
FIG. 8 GRAPH RELATIONS BETWEEN LOAD-DISPLACEMENT MACRO AND MICRO MODEL UNDER CYCLIC LOADING
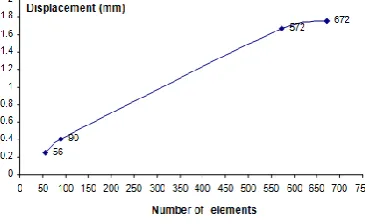
TABLE 7
COMPARISON OF THE DISPLACEMENT VALUE BY THE NUMBER OF DIFFERENT ELEMENTS
Number of elements Number of nodes Displacement (mm) 1
2 3 4
56 90 572 672
72 110 621 725
0.2489 0.4015 1.6731 1.7474
Type Output
Micro Model Without Bracing
Load max.
x direction displacement max.
Micro Model With Steel Bracing
Load max.
x direction displacement max.
Micro Model With Bamboo Bracing
Load max.
x direction displacement max.
International Journal of Emerging Technology and Advanced Engineering
Website: www.ijetae.com (ISSN 2250-2459,ISO 9001:2008 Certified Journal, Volume 2, Issue 12, December 2012)
[image:8.595.210.393.144.256.2]605
FIG. 9 GRAPH CONVERGENCE CALCULATIONS
To find out whether the results given by the numeric analysis can be compatible with the solution equation then it can be seen at convergence calculations.
The larger dimension of the element will decrease the number of elements and with the smaller dimensions of the element then the number of element will increase. Comparison of the results with different number elements can be seen at Table 7 and Figure 9. The greater number elements then the results will be more accurate.
IV. CONCLUSION
The addition of bracing on the brick masonry can improve the strength and stiffness under cyclic loading. This occurs because steel bracing or bamboo bracing provides additional strength to supress the tensile causes by cyclic loading. Brick masonry has the same properties as the concrete is strong to hold stress but weak to hold tensile and with the addition of bracing it can overcome these weaknesses.
Bamboo is effective enough to be used as an alternative material. Bracing bamboo can contribute a good deal of strength to brick masonry despite the differences in the stress-strain behavior which in this case the steel bracing is better than bamboo.
The difference between micro and macro model occurs in the use of the building blocks where the micro model used modulus of elasticity and Poisson ratio of brick and mortar, while the macro model is used the model equations that represent the two materials. Another difference occurs in the accuracy of the results which the resuslts given micro model more accurate than the results given macro model. It can be concluded that using micro model has advantages compared to using macro model which is the results are more precise and reserchers can find a style that occurs at the interface. However, micro model also have disadvantage which is the number of elements that will require time and more memory so it can not be used for model with a large dimension.
Recommendation
Research can be developed with the change in value of the modulus elasticity of material due to cylic loading to make the numeric model condition close to the
experiment model.
Acknowledgments
This paper is part of thesis in Department of Civil Engineering Brawijaya University. We give appreciation to Prof. Dr. Ir. Sri Murni Dewi, MS., Ir. Siti Nurlina, MT and Dr. Eng. Alwafi Pujiraharjo, ST., MT as our advisor.
REFFERENCES
[1 ] Tomazevic, M. 2000. Some Aspect of Experimental Testing of SeismicBehaviour of Masonry Walls and Earthquake Technology 404 Vol 57: 101-117. Models of Masonry Buildings. ISET Journal of Earhquake Technology 404 Vol. 57: 101-117.
[2 ] Milani, G. 2007. A Simple Equilibrated Homogenization Model for The Limit Analysis of Masonry Structures. WSEAS TRANSACTIONS on APPLIED and THEORETICAL MECHANICS. Issue 5 Volume 2: 119-125.
[3 ] Wisnumurti et al. 2007. Optimalisasi Penggunaan Komposisi Campuran Mortar Terhadap Kuat Tekan Dinding Pasangan Bata Merah. Jurnal Rekayasa Sipil Volume 1 No.1 hal: 25-32. [4 ] Bakhteri J., Makhtar, A. M., Sambasivam S. 2007. Numeric
Modelling of Structural Clay Brick Masonry Subjected to Axial Compression. Jurnal Teknologi. 41(B). 57-68.
[5 ] Kuczma, M. , Wybranowska, K. 2005. Numeric Homogenization of Elastic Brick Masonry. Civil and Environmental Engineering Reports. 1. 136-152.
[6 ] Asteris, P.G. 2008. Numeric Micro-Modeling on Infilled Frames. Electronic Journal of Structural Engineering (8):1-11.
[7 ] Ghavarni, Khosrow. 2005. Bamboo As Reinforcement In Structural Concrete Element. Cement and Concrete Composites Vol. 27(6):637-649.
[8 ] Lourenco,P. B. et al. 1995. Two Approaches for The Analysis of Masonry Structures: Micro and Macro Modeling. HEROV Vol. 40 No.4.
[9 ] Lourenco, P. B. 1996. Computational Strategies for Masonry Structures. Delf University Press. Netherlands.
[10 ]Lourenco, P. B., Alberto Z., Gabriele M. and Antonio T. 2006.
Homogenisation Approaches for Structural Analysis of Masonry
International Journal of Emerging Technology and Advanced Engineering
Website: www.ijetae.com (ISSN 2250-2459,ISO 9001:2008 Certified Journal, Volume 2, Issue 12, December 2012)
606
[11 ]Rivieccio, P. G. Homogenization Strategies and ComputationalAnalysis for Masonry Structures Via Micro-Mechanical Approach. Tesis. University of Napoli Federico II.