The Behaviour of Frozen Scoria in Unconfined
Compression Test
Yanyan Agustian
Widyatama University, Indonesia
Copyright©2019 by authors, all rights reserved. Authors agree that this article remains permanently open access under the terms of the Creative Commons Attribution License 4.0 International License
Abstract
The mechanical behaviour of the frozen or partially frozen soil changes significantly as soon as the ice holds the soil particles together. The strength of frozen soil can increase significantly. However, due to the temperature dependency and viscose nature of ice, the strength of frozen soils changes with time, strain rate and temperature. Water migration towards the ice lenses occurs during the freezing process depending on the characteristics of the soil, i.e. grain size and mineralogy, resulting in a significant change of the soil structure. Frost heaving may be the result, induced by the expansion of the water as it changes phase from frozen state. The aim of this study is to determine the unconfined compressive strength to calculate the unconsolidated shear strength of the frozen scoria under unconfined conditions. In unconfined compression tests, the influence of dry density ρd and water content w to the unconfined compression behaviour of frozen scoria was observed. The compressive strength of frozen scoria increases with the increase of w as well as the increase of ρd and the compressive strain of frozen scoria εf (axial strain at failure) is dependent on ρd.. Although some data scatters appear caused by the inhomogeneous of the samples, the effects of w and ρd to the stiffness of frozen scoria were observed. As well as initial Young’s modulus E0, secant modulus E50 of frozen scoria increases with the increasing of w and ρd.Keywords
Scoria, Yukishiro, Stress-strain, Deformation Characteristics, Frozen1. Introduction
The strength and stiffness properties of the soils are the most important groupings, which presents the engineering properties of the soils. Understanding of the characteristics in the strength and the stiffness is fundamental to the derivation and implementation of realistic constitutive
numerical model. Soil strength is defined as the maximum load that a soil may sustain until or just before it fails. One of the recognized strength parameters is unconfined compressive strength qu, measured from unconfined compression test. The stiffness of the soil determines the amount of deformation that it may display under load. The main recognized stiffness properties of soil are Young’s modulus (E), Poisson’s ratio, bulk modulus and shear modulus (G).
Natural and artificial frozen soils have been widely studied for decades [1][2][3][4]. The behaviour of scoria in triaxial tests has been studied both in monotonic[5] and cyclic[6]to observe its mechanical behaviour.
Three stages that should be experienced on the frozen soils stress-strain loads according to the studying method on material stress-strain behaviour in material mechanics; they are: (1) elastic stage; strain increases linearly with the increase of stress; (2) strain hardening stage; in this stage the plastic deformation is dominating over the specimen deformation and the elastic deformation is relatively subordinate status and (3) yield stage or flow stage; in this stage the peak is followed by a decrease of the deviator stress upon continued deformation. Frozen scoria, in this study, was tested in confined compression to establish the effects of dry density and water content on its mechanical behaviour. In the present work, by using the Young’s modulus, which represents the stiffness of the studied frozen scoria, the resistance to deformation of the reconstituted frozen scoria was investigated through unconfined compression experimental program.
Figure 1. The simplified stress balance in snow layer where the Yukishiro occurs (modified from Anma, 2007)
“Yukishiro” is one of slope failure phenomenon involved scoria in frozen condition. Yukishiro can be illustrated as a large quantity of water result from snow melting by the sudden rise of temperature and rain water can cause surplus water in the snow layer and if the layer does not absorb this abundant water then it will make the layer become saturated and the water accumulated. The water of the sloping snow layer then begins to drift to the down slope, and driving force begins to push down the snow layer. If the height of the water level and the angle of inclination of the slope become big, then the osmotic pressure grows. If this osmotic pressure exceeds than the resisting force to support the snow layer then the slope will lose in stability, and the snow layer begins to slide
.
The stress balance in snow layer, thawed scoria, and frozen bed with water pressure can be simplified as shown by Figure. 1[8]. Driving force T, resisting force R and safety factor are defined as
S W
T= sinβ+ (1)
φ
β
φ
( cos )tan tan)
(N P W P
R= − = − (2)
Fs = R/T (3) Where:
φ γ hcos
W = ×
L h P=(
γ
w× w)S is osmotic pressure (KN/m3) β is slope angle (o)
γw is the unit weight of soil layer w is unit weight of water
φis angle of internal friction of soil layer (scoria)
2. Method Analyses
The primary purpose of this test is to determine the
unconfined compressive strength. According to the JIS standard, the unconfined compressive strength (qu) is defined as the compressive stress at which an unconfined cylindrical specimen of soil will fail in a simple compression test. In addition, in this test method, the unconfined compressive strength is taken as the maximum load attained per unit area, or the load per unit area at 15% axial strain, whichever occurs first during the performance of a test.
The schematic diagram and the setting up of the test apparatus are shown by Figure 2. Cylindrical specimens with nominal measurements of 50 mm in diameter and 100 mm in length were prepared by packing a split copper mold. It was originally desirable for the size of the specimen to be a diameter of 100 mm and 200 mm in height. The reason is that by examining such a large specimen with 100 mm in diameter, the maximum particle size that allowed to keep the ratio between specimen diameter to the maximum particle size above five is 19.00 mm, so that the particle size is large and good enough to represent the original filed condition. However, in case of frozen soils, such kind of large specimens will have a large compressive strength and at least up to 20 kN of stress is needed to be applied for loading to have the specimens fail. These conditions are hard to fulfill in our laboratory.
Scoria was poured into a mould such a way by using a pipe so that the pluviation height was controlled depend on the length of the pipe. To have a denser sample, the mould was tapped with a wooden mallet 100 times only for 1.50 g/cm3 of dry density target. Amount of water as shown by Table 5.2 then was poured to the sample and the samples were then cured with curing time based on targeted dry density and water content. In order to have a homogeneous distribution of temperatures, the specimens were then kept in freezer for almost 24 hours in the range of -3 to 0oC. The specimens then were subjected to unconfined compression tests with 1%/min. of constant axial strain rate. The axial
β
R
P = uL
u =
γ
wh
wN W
S L
D d
hw
ht
β
Frozen layer
Thawed layer
deformation was automatically measured by external dial gauge and the data were collected by a computer continually as well as the axial load.
Figure 2. Schematic diagram of unconfined compression test The displacement and compression stress data recorded by the computer during loading were then used to calculate the compression strain ε(%), unconfined compression strength qu(MN/m2), axial strain at failure εf(%) and Young’s modulus (E0 and E50). Below are equations expressed those calculations
.
100 0 × ∆ = H H
ε (4)
ε :axial strain (%)
H
∆ :deformation (cm)
0
H
:initial height (cm)
10 100 1 0 × − × =
ε
σ
A P (5)σ
:compression stress (KN/m2)P :loading (N)
0
A
:initial sample area (cm2)3. Results
All specimens were prepared by using air pluviation method. By accomplishing the pluviation height, a desired range of dry density could be achieved (Table1). A preliminary examination was carried out to evaluate the result of each high pluviation and then desired dry densities were decided. Results from filed investigations and laboratory tests show that the original field water content was range from 8.70% to 26.54%. Three series of sample water contents were targeted based on this field scoria dry density: 14%, 17% and 20%.
Table 1. Method to achieve targeted dry density of the scoria samples
[image:3.595.68.280.123.323.2]It was difficult to have a homogeneous sample in term of water content distribution for reconstituted frozen sample. Unsatisfactorily test results appear in the strength characteristics if the water content distribution of the sample is not constant, although the samples are made in the same condition. To evaluate the homogeneity of water content, samples were cut into three pieces: upper, middle and lower layer and then the water content of each layer was measured for the preliminary investigation (Figure 3). The evaluation was conducted for each water contents targeted and the result is shown in Table 2.
[image:3.595.386.456.311.433.2]Figure 3. Samples were cut into three pieces: upper, middle and lower layers, to evaluate the distribution of water content
Table 2. Water content target and water that used for each targeted dry density
Scoria was poured into a mould such a way by using a pipe so that the pluviation height was controlled depend on the length of the pipe. To have a denser sample, the mould was tapped with a wooden mallet 100 times only for 1.50 g/cm3 of dry density target. Amount of water then was poured to the sample and the samples were then cured with curing time based on targeted dry density and water content (Table 3). In order to have a homogeneous distribution of temperatures, the specimens were then kept in freezer for almost 24 hours in the range of -3 to 0oC. The specimens then were subjected to unconfined compression tests with 1%/min. of constant axial strain rate. The axial deformation was automatically measured by external dial gauge and the data were collected by a computer continually as well as the axial load.
1. Loading piston 2. Load cell 3. Dial gauge 4. Thermometer 5. Specimen 6. Cap 7. Pedestal 8. Cell cover 3
sensor interface
computer 1 2 3 4 5 6 7 8
1.25 300 10 0
1.35 700 90 0
1.50 700 90 100
Amount of tapping (times) Pluviation height
(cm) Weight of scoria
(g) Density Target
(g/cm3)
Water content w target (%)
Water used for 1.25 g/cm3of dry density
target (g)
Water used for 1.35 g/cm3 of dry density
target (g)
Water used for 1.50 g/cm3of dry density
target (g)
20 55 60
50
60
70
14 35 40
[image:3.595.76.293.440.599.2]Table 3. Water content measurement results from sample cut evaluation
3.1. Stress-strain Characteristics
In this sub-chapter, the influence of dry density and water content to stress-strain relationships is explained based on curves provided from unconfined compression tests. Two specimens which have a similar dry density and water content of each series were conducted to evaluate the reproducibility of the tests. Table 4 is the resume of test conditions and some results.
The following may be drawn from the stress-strain curves results from the tests:
There is not so much different in the stress-strain relations between the two tests of each series. Except D, F and I of test codes, all the test results show quite good result in term of stress-strain relationships. The large difference results of some tests were due to inconsistency of the specimen conditions i.e. the targeted water content and dry density.
All specimens experienced the three stages that common as usually shown by normal sands at frozen state: (1) elastic stage; strain increases linearly with the increase of stress; (2) strain hardening stage; in this stage the plastic deformation is dominating over the specimen deformation and the elastic deformation is relatively subordinate status and (3) yield stage or flow stage. Loose samples exhibit the stress-strain curves increase continuously after strain hardening stage is reached as shown by Figure 4(a) and a limit state or peak stress is not obtained for some samples. It could be argued that after a sufficient strain the peak would, probably, be reached. However, this can be achieved due to the limited range of visible deformation.
Both dry density and water content are the important factors affecting stress-strain relations on frozen scoria as shown by Figure 4 and 5. A large difference between two range dry densities is shown by Figure 5, especially for 1.50 g/cm3 of dry density.
Table 4. Resume of test conditions and some of the result
NOTE: (3) weight; (4) water content; (5) dry density; (6) unconfined compressive strength; (7) axial strain at failure; (8) initial Young’s modulus; (9) secant Young’s modulus
Water content w
target (%)
Curing time
(minute) Layer
Water content w
(%)
upper 10.27
middle 13.96
lower 11.78
upper 16.12
middle 17.52
lower 16.01
upper 19.23
middle 20.31
lower 19.31
14 100
17 70
20 40
(1) (2) (3) (4) (5) (6) (7) (8) (9)
m w ρd qu εf E0 E50
(g) (%) (g/cm3) (MN/m2) (%) (MN/m2) (MN/m2)
A1 299.81 13.38 1.205 3.64 11.55 65.88 56.22
A2 302.12 14.58 1.211 3.64 10.11 103.53 79.76
B1 314.37 17.31 1.283 5.03 13.69 137.11 106.30
B2 310.28 17.13 1.266 4.83 12.77 131.74 111.39
C1 317.61 20.77 1.255 5.81 10.67 214.93 201.49
C2 325.35 20.62 1.291 6.12 12.90 203.02 153.04
D1 317.32 13.91 1.364 4.93 10.10 124.72 105.09
D2 305.03 13.09 1.320 3.94 9.12 109.03 92.18
E1 318.08 16.86 1.341 5.29 11.56 126.94 106.57
E2 322.95 16.41 1.360 5.92 12.50 119.90 98.85
F1 334.31 19.30 1.386 6.69 12.18 173.63 142.90
F2 330.55 19.92 1.362 6.65 11.37 201.18 176.34
G1 352.33 14.67 1.510 8.68 8.37 222.99 207.11
G2 352.16 14.62 1.507 8.48 8.07 252.30 236.23
H1 374.13 17.12 1.542 10.61 8.95 242.80 221.93
H2 369.22 17.45 1.552 10.90 9.31 269.45 260.47
I1 371.60 19.96 1.536 11.88 7.38 454.92 459.13
I2 374.59 19.61 1.553 12.73 8.61 404.32 409.28
loose
moderate
[image:4.595.103.493.427.720.2]0
2
4
6
8
10
12
14
16
18
0
1
2
3
4
5
6
7
20.62 1.291 20.77 1.255 17.13 1.266 17.31 1.28314.58 1.211
Co
m
pr
essi
ve
st
re
ss
σ
(MP
a)
Axial strain
ε
(%)
A1 A2 B1 B2 C1 C2
w (%) ρd (g/cm3) 13.38 1.205
(a)
0
2
4
6
8
10
12
14
16
18
0
1
2
3
4
5
6
7
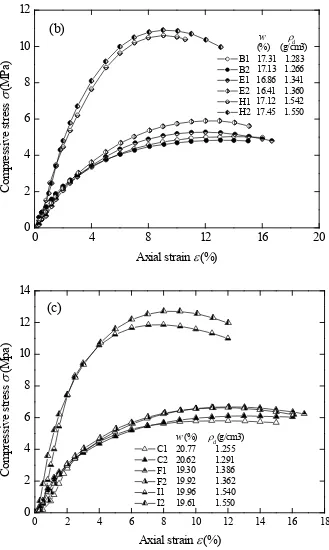
(b)
19.92 1.362 19.30 1.386 16.41 1.36016.86 1.341 13.09 1.320
Co
m
pr
essi
ve
st
re
ss
σ
(MP
a)
Axial strain
ε
(%)
D1 D2 E1 E2 F1 F2
Figure 4. The effects of water content on the stress-strain relations (a) loose samples, (b) moderate samples and (c) dense samples.
0
2
4
6
8
10
12
14
16
18
0
2
4
6
8
10
12
14
(c)
19.61 1.553 19.96 1.536 17.45 1.552 17.12 1.54214.62 1.507
Co
m
pr
essi
ve
st
re
ss
σ
(MP
a)
Axial strain ε
(%)
G1 G2 H1 H2 I1 I2
w (%) ρd (g/cm3) 14.67 1.510
0
4
8
12
16
20
0
2
4
6
8
10
14.62 1.507 14.67 1.510 13.09 1.320 13.91 1.360 14.58 1.211 A1
A2 D1 D2 G1 G2
Co
m
pr
essi
ve
st
re
ss
σ
(M
pa
)
Axial strain
ε
(%)
13.38 1.205
(%) (g/cm3)w ρd
Figure 5. The effects of dry density on the stress-strain relations: (a) 14% targeted water content, (b) 17% targeted water content and (c) 20% targeted water content.
3.2. Relationships between Unconfined Compression Strength, Dry Density and Water Content
To characterize the unconfined strength of frozen scoria, the influences of dry density and water content on unconfined compression strength were evaluated and the results were plotted as shown by in Figure 6(a) and 6(b). It
can be seen from Figure 6(a) that the compressive strength of frozen scoria increases with the increasing in dry density. Based on the results, the relationship between dry density and compression strength is not a simple proportion relation. In other words, it is not a linear relationship. Based on the results of the relationships between the unconfined compression strength and the dry density, the
0
4
8
12
16
20
0
2
4
6
8
10
12
(b)
17.45 1.550 17.12 1.542 16.41 1.360 17.13 1.266 16.86 1.341 B1
B2 E1 E2 H1 H2
Co
m
pr
essi
ve
st
re
ss
σ
(MP
a)
Axial strain
ε
(%)
(%) (g/cm3)w ρd
17.31 1.283
0 2 4 6 8 10 12 14 16 18
0
2
4
6
8
10
12
14
(c)
19.61 1.55019.96 1.540 19.92 1.362 19.30 1.386 20.62 1.291 C1
C2 F1 F2 I1 I2
Co
m
pr
essi
ve
st
re
ss
σ
(Mp
a)
Axial strain ε (%)
w (%) ρd (g/cm3)
best-fit lines drawn through the plotted points appear to approach parabolic values. It can be assumed that for all various water contents, the unconfined compression strength does not change so much at range 1.25~1.35g/cm3 of dry density, while larger than 1.50 g/cm3 give a larger unconfined compression strength.
Figure 6(b) shows that unconfined strength of frozen scoria is also dependent on water content. Furthermore, it
shows that the proportion coefficient of unconfined compression strength-water content relations of target dry density 1.50g/cm3 is larger than two others proportion coefficients and is tied to consideration of Figure 5(a). This property could be explained by the increasing on water content that would make increase the particle bonding force and particle interlocking and increase the unconfined compression strength consequently.
Figure 6. (a) Effects of water content on unconfined com0pression strength and dry density relation and (b ) Effects of dry density on unconfined compression strength and water content relation
10
12
14
16
18
20
22
0
3
6
9
12
15
1.507 ~ 1.550
1.320 ~ 1.386
1.205 ~ 1.291
U
nc
onf
ine
d c
om
pr
es
si
on s
tre
ngt
h
q
u(MN
/m
2
)
Water content
w
(%)
ρ
d(g/cm
3)
1.1
1.2
1.3
1.4
1.5
1.6
0
3
6
9
12
15
U
nc
onf
ine
d c
om
pr
es
si
on s
tre
ngt
h
q
u(MN
/m
2
)
Dry density
ρ
d(g/cm
3)
water content w (%) [image:8.595.147.445.184.730.2]Three phases of soils generally consist of water, soil and air, which their relationships can be expressed as follows:
) 1 1 ( s d w
rG G G S
w= − (6)
) 1 ( 1 s w r d G G S w G + = (7) ) 1 1 ( s d w r G G G w S − = (8)
where Gw is the specific gravity of water and Gs is the specific gravity of soil particles. In order to evaluate the influence of the water content and dry density, the physical parameter such as Gd and Sr have been taken into account. The compressive strength qu is a function of water content w and the dry specific gravity Gd, as follows [7]:
n d u
q
*
(
100
w
)
G
q
=
m (9)Where q*, m and n are constants. In order to estimate these constants, both sides of the Eq. (9) are taken as logarithm.
d u
log
*
log(
/100)
log
log
q
=
q
+
m
w
+
n
G
(10)Because Eq. (10) is a linear model, the least square method was used to define the value of q*. Calculation results of q*, m and n constants from frozen scoria for each series tested are shown by Table 5. The suitability of Eq (9) is shown in Figure 7, from which a linear relation between
qu and (w/100)mGdn can be inferred. The values of constant
q* is directly derived from this plot as the fit linear of the relations.
To see the relationships between unconfined compression strength qu, w and Gd, qu obtained from test results have been plotted against (w/100)mG
[image:9.595.118.292.111.234.2]dn as shown in Figure 7 and are compared to Toyoura sand [7]. The figure shows that there is no a large difference both in unconfined compression strength and in the value of (w/100)mG
dn or loose and moderate samples. This may be due to similarity in water content and the dry density itself between the loose and moderate. On the other hand, unconfined compression strength and the value of (w/100)mG
dn are larger for the dense samples.
Figure 7. Relation between qu and (w/100)mGdn of scoria tested and compared to Toyoura sand [7].
0.00
0.25
0.50
0.75
1.00
1.25
1.50
0
2
4
6
8
10
12
14
1.205 - 1.291 1.320 - 1.386 1.507 - 1.553 1.335 - 1.645
y
= 13.42
x
R
2= 0.98
y
= 11.33
x
R
2= 0.90
Unc
onf
ine
d c
om
pr
es
sive
st
re
ss
q
u(MP
a)
(
w
/100)
mG
dn
ρ
d (g/cm3)y
= 11.64
x
R
2= 0.91
Toyoura sand
(Enokido and Kameta, 1987)
y = 26.90x
[image:9.595.127.460.351.658.2]It is seen clearly the correlation among unconfined strength, water content and dry density by employing Figure 7 through the validity of Eq. 9, more than only from stress-strain relationships plotting. Since the dry density is roughly constant for all series (loose, moderate and dense samples), the attention is to be paid to each series at unconfined compression strength dependency on water content. All frozen scoria samples tested exhibit proportional in unconfined compression strength to the water content, that is, the increasing in water content is followed by increasing in unconfined compression strength and resulting the constant q* roughly similar. The multiple correlation coefficient of the linear model of the scoria tested is about 0.97, which means the equation applied for scoria is accurate. The figure also shows that frozen scoria lied below the Toyoura sand, both in qu and contant q*. This may be due to Toyoura sand tested on the region of lower temperature (-30oC) and the tests conducted in high controlled stress (200-300 kPa/sec) while the present scoria tested on -3 – 0oC and the tests was held on strain controlled with strain increment 1%/min.
Table 5 is the calculation results that shows the constants
m are roughly similar, m = 1 (Toyoura sand, m = 0.852), the constant n is proportional to the dry density and constant q* obtained from fit linear from the plot of relationship between qu and (w/100)mGdn is not so much different for all series at different densities.
Table 5. Calculation results of m, n and q* constants
3.3. Deformation Characteristics
Deformation characteristic is an important thing in the study on the mechanical behaviour of soils. Researchers usually relate the deformation characteristics of a soil with its failure characteristics, Young’s modulus, deformation behaviour seen by visual inspection and so on. In this study these evaluations are described in order to have a general description about the frozen scoria deformation
characteristics on unconfined compression test.
Figure 8(a) shows the relationships between the axial strain at failure εf and the dry density ρd. While some scatters appear from the test results, the plots show that opposite proportion of dry density to the axial strain at failure. Higher value of ρd gave the lower value of εf, which means that the denser scoria sample remains faster to failure in certain axial strain. This is a common deformation characteristic of soils tested in triaxial compression test as well as scoria in dry state. The effect of water content on the axial strain at failure is shown by Figure 8(b). While the effect of dry density on the axial strain at failure εf – water content w relationships is seen, the plots also shows that about 17% of water content gave the value of εf at peak for all various ρd.
The stiffness properties of scoria were quantified in terms of initial Young’s modulus (E0) and secant Young’s modulus (E50). It has been known that denser sample has a higher stiffness for almost kind of soils. Frozen scoria has experienced the same manner as shown by Figure 9 and Figure 10. However, the evaluation of deformation through
E0 and E50 in the present study is not so satisfy, since scatters appear from the results. This is due to the homogeneity of frozen scoria at the upper and lower part was not achieved perfectly and then caused some samples deformed locally at the upper and lower part immediately after the test was started. Consequently, this influenced the stress-strain relationships at the initial stage and made it hard to obtained satisfactorily data to evaluate the initial Young’s modulus.
Initial Young’s modulus is defined as the gradient of linear portion of stress-strain curve starting from the origin and modulus deformation is defined as the gradient of the straight line through the origin and stress-strain curve corresponding to a half of qu. The effects of w and ρd to the stiffness of frozen scoria were observed. As well as initial Young’s modulus E0, secant Young’s modulus E50 of frozen scoria increase with the increasing of w and ρd. The effects of inhomogeneous in water content on the deformation mode of the samples can be seen from photo 1 that the sample exhibit deformation only at the upper part while in the middle part exhibit undeformed.
ρd (g/cm3) m n q* (Mpa)
1.205 - 1.291 0.96 2.92 13.42
1.320 - 1.386 1.20 4.66 11.33
Figure 8. (a) Axial strain at failure and dry density relation and (b) axial strain at failure and water content relation
1.1
1.2
1.3
1.4
1.5
1.6
0
2
4
6
8
10
12
14
16
Ax
ial
st
ra
in
at
fa
ilu
re
ε
f(%)
Dry density
ρ
d(g/cm
3)
water content w (%)13.09 ~ 14.67 16.41 ~ 17.45 19.30 ~ 20.77
10
12
14
16
18
20
22
24
0
3
6
9
12
15
Ax
ial
st
ra
in
at
fa
ilu
re
ε
f(%)
Water content
w
(%)
1.507 ~ 1.550 1.320 ~ 1.386 1.205 ~ 1.291 ρd (g/cm
Figure 9. (a) Initial Young’s modulus and dry density relation and (b) Initial Young’s modulus and water content relation
1.1 1.2 1.3 1.4 1.5 1.6
0 100 200 300 400 500
Ini
tia
l Y
oung'
s M
odul
us
E
0(MN
/m
2
)
Dry density
ρ
d(g/cm
3)
water content w (%) 13.09 ~ 14.67 16.41 ~ 17.45 19.30 ~ 20.77
(a)
10 12 14 16 18 20 22
0 100 200 300 400 500
(b)
Ini
tia
l Y
oung'
s M
odul
us
E
0(MN
/m
2
)
Water content
w
(%)
Figure 10. (a) Secant modulus and dry density relation and (b) Secant modulus and water content relation
1.1 1.2 1.3 1.4 1.5 1.6
0 100 200 300 400 500
Se
ca
nt
m
odul
us
E
50(MN
/m
2
)
Dry density
ρ
d(g/cm
3)
water content w (%) 13.09 ~ 14.67 16.41 ~ 17.45 19.30 ~ 20.77
(a)
8 10 12 14 16 18 20 22
0 100 200 300 400 500
(b)
Se
ca
nt
m
odul
us
E
50(MN
/m
2
)
Water content
w
(%)
[image:13.595.128.466.79.622.2]Photo 1. The example of unhomogeneous in water content distribution; deformed only in the upper part
3.4. Engineering Practices
The compressive strength of frozen soil is practically important in geotechnical construction engineering, which employs artificial freezing and low temperature structures, etc. It is especially used to calculate the strength of walls of frozen soil. This strength is affected by many factors including loading rate, water content, dry specific gravity and the degree of saturation. In order to meet the needs of construction in cold regions and the application of artificial ground freezing such as mine shaft and tunnel construction, the strength characteristics and the stress-strain behaviour of the frozen soils have to be studied.
There are many case histories of landslides reported in cold regions. It is necessary to pay attention to slope instability during a project construction and geo-environmental protection. In the cold region, the instability of frozen soil slopes have been classified into collapse, creep slope, debris flow, vegetation layer creeping slope and thawing slumping. Among them both of debris flow and vegetation layer creeping slope are the kind of failure of the active layer. It is closely related to engineering and hazardous to the environment, vegetation and engineering project.
4. Conclusions
On the basis of the number of tests in the present study, the influence of dry density and water content to the unconfined compression behaviour of frozen scoria was observed [9, 10].
(1) The method of unconfined compression test for frozen scoria has been developed.
(2) The compressive strength of frozen scoria increase with the increase of water content w as well as the increase of dry density ρd and the compressive strain
of frozen scoria (axial strain at failure) is dependent on ρd. The increasing of ρd is followed by the decrease value of εf. The εf-w relationship shows that about 17% of water content gave the value of εf at peak for all various ρd.
(3) Since unconfined compression strength qu is a function of Gd and w, the dependency of qu on ρd and w could be directly evaluate from the plot of data results. The multiple correlation coefficient of the linear model of the scoria from this function is about 0.97, which means the equation applied for scoria is accurate.
(4) The stiffness properties of scoria were quantified in terms of initial Young’s modulus (E0) and secant modulus (E50). While some data scatters appear caused by the inhomogeneous of the samples, the effects of w and ρd to the stiffness of frozen scoria were observed. As well as initial Young’s modulus E0, secant modulus E50 of frozen scoria is increase with the increasing of w and ρd.
REFERENCES
[1] Shoewu, O., Makanjuola, N. T., Akinyemi, L. A., & Ogunlewe, A. O. (2015). Received Signal Strength in a Macrocell in Lagos Environs Using Finite Element Method. Review of Computer Engineering Research, 2(2), 47-64. [2] Ma, W., and Chang, X., (2000): Effect of consolidating
process on stress-strain behaviour of artificially frozen soil. Proceedings of the International Symposium on Ground freezing and Frost action in soils, Belgium. A. A Balkema, Rotterdam, pp. 151-154.
[3] Ono, T., (2002): Lateral deformation of freezing clay under triaxial stress condition using laser-measuring device, Cold regions science and technology, Vol 35, pp 45-54.
[4] Wang, D., Ma, W., Chang, X., (2004): Analyses of behaviour of stress-strain of frozen Lanzhou loess subjected to K0 consolidation, Cold regions science and technology, Vol 40, pp 19-29
[5] Agustian, Y., and Goto, Satoshi., (2008): “Strength and Deformation Characteristics of Scoria in Triaxial Compression at low Confining Stress,“ Soils and Foundations, Vol.48, No.1, pp.27-39
[6] Agustian, Y., and Goto, S., (2008): “Undrained Cyclic Shear Behaviour of Reconstituted Scoria Deposit,” Soils and Foundations, Vol.48, No.6.
[7] Enokido, M., and Kameta, J., (1987): Influence of water content on compressive strength of frozen sands, Soils and Foundations, Vol. 27, No. 4, pp. 148-152
[8] Anma, So., (2007): Lahars and slush lahars on the slopes of Fuji volcano, Fuji Volcano, Yamanashi Institute of Environmental Sciences, pp. 285-301
Petroleum Science and Technology, DOI: 10.1080/10916466.2018.1547759.


![Figure 7 and are compared to Toyoura sand [7]. The figure](https://thumb-us.123doks.com/thumbv2/123dok_us/8748213.891306/9.595.127.460.351.658/figure-compared-toyoura-sand-figure.webp)


