Journal of Chemical and Pharmaceutical Research, 2017, 9(9):116-125
Research Article
CODEN(USA) : JCPRC5
ISSN : 0975-7384
116
Experimental Investigation on Performance, Emission and Combustion
Characteristics of Biodiesel in a Di Diesel Engine
V Naresh
*, S Prabhakar, K Annamalai and S Naveen Chadra
Department of Mechanical Engineering, Bharath University, Chennai, India
_____________________________________________________________________________
ABSTRACT
The study titled “Performance and Emission Studies on a 4 stroke Diesel Engine Using Methyl Ester of ALGAE Oil with EGR” involves the study of performance and emission characteristics of Blends of Methyl Esters of ALGAE oil by varying the EGR control value (5 to 20%) using direct injection diesel engine. From various researches it’s found that NOX emission is higher in ALGAE based biodiesel. In this study the cooled EGR is used as it can reduce
the NOX emission.
Keywords: Diesel engine;Petroleum; Climate change; Greenhouse gases
_____________________________________________________________________________
INTRODUCTION
The demand for energy around the world is continuously increasing, specifically in the demand for petroleum based energy. According to international energy outlook, the world consumption for petroleum and other liquid fuel will grow from 83 million barrels/day in 2004 to 97 million barrels/day in 2015 and just over 118 million barrels/day in 2025. Under these growth assumptions, approximately half of the world’s total resources would be exhausted by 2025. Another major global concern is environmental concern or climate change such as global warming. In order to control the emissions of greenhouse gases, Kyoto protocol in Kyoto city, Japan in 1997 and came to effect since February, 2005. Now, Kyoto protocol covers more than 160 countries globally and targeting to reduce the greenhouse gas emission by a collective average of 5% below 1990 level of respective countries. The Intergovernmental Panel on Climate Change (IPCC) concludes in the climate change 2007 that, because of global warming effect the global surface temperatures are likely to increase 1.1°C to 6.4°C between 1990 and 2100 Theta et al. [1]. To solve both the energy concern and environmental concern, the renewable energies with lower environmental pollution impact should be necessary. Biodiesel is renewable and environmental friendly alternative diesel fuel for diesel engine. It can be produced by transesterification process. Transesterification is a chemical reaction in which vegetable oils and animal fats are reacted with alcohol in the presence of a catalyst. The products of reaction are fatty acid alkyl ester and glycerin, and were the fatty acid alkyl esters known as biodiesel.
Biodiesel has higher viscosity, density, pour point, flash point and cetane number than diesel fuel. Also the energy content or net calorific value of biodiesel is about 12% less than that of diesel fuel on a mass basis. Biodiesel reduces exhaust emissions such as the overall life cycle of carbon dioxide (CO2), particulate matter (PM), carbon
monoxide (CO), sulfur oxides (SOx), volatile organic compounds (VOCs) and unburned hydrocarbons (HC)
significantly. It is reported that 100% biodiesel emits lower tail pipe exhaust emissions compared to the diesel fuel nearly 50% less in PM emission, nearly 50% less in CO emission and about 68% less in HC emission. Furthermore, since biodiesel can be said a sulfur - free fuel, it has 99% less SOx emission than the diesel fuel. However, most of
117
Transesterification ProcessThe transesterification is a chemical reaction widely used in the production of biodiesel. In this reaction fatty acid in vegetable oil is reacted with an alcohol in a presence of a catalyst to form fatty acid alkyl ester. The most common type of alcohol used in biodiesel production is methanol.
Pollution Control Techniques
The following methods are used as pollution control technique i.e., air injection, exhaust gas recirculation and catalytic converters. Senthil et al. [2].
Exhaust Gas Recirculation Techniques
In this project the cooled EGR is used as it can reduce the NOx emission. In cooled EGR the levels of recirculation
varied from 5 to 20% EGR check value. To check value has the gradient scale around the tuning of value then the EGR limit is controlled. The levels are varied to find out the corresponding emission level. The optimized values are suggested for the better ALGAE based biodiesel. The EGR used in the conventional practice are hotter type, in which NOx is very high. For reducing the NOx, the exhaust gas temperature should be reduced and this can achieved
by cooled EGR. Water is used as coolant for cooling the EGR. Various blends of methyl esters of ALGAE are b20, b40, b60 and the results is compared with diesel. EGR lowers the combustion temperature by reducing oxygen concentration. In simple terms, exhaust gas, lacking oxygen and essentially non combustion temperatures.
Generally, there are two types of EGR system, external and internal. That is either by recirculating some exhaust leaving the engine back to the engine or by retaining a fraction of exhaust that never leaves the engine.
External EGR
The external EGR system, which circulate the gases from the exhaust manifold to the intake port through external piping. Many of these system causes exhaust gas to recirculate through piping by opening a normally closed EGR control value in the piping during the intake stroke. The EGR value can be turned off to match operating conditions. This technology can reduce emissions especially NOx, many external EGR systems require several additional
components, such as, external piping, by pass lines and related cooling mechanisms, in order to operate properly. In addition, the combustion of exhaust gas and moisture in the external piping may expedite the corrosion of system components, leading to reliability issues.
EXPERIMENTAL SECTION
118
Figure 1: Schematic diagram of experimental set-up
Figure 2: (A) Needle lifter sensor installation position, (B) Valve timing of test engine
Figure 3: (A) Injection nozzle of test engine, (B) Pressure transducer
The performance characteristics of the engine are evaluated in terms of brake thermal efficiency, emission characteristics in terms of smoke, HC, CO, CO2, and NOX. The combustion characteristics in terms of pressure
traces, maximum pressure, heat release, cumulative heat release, combustion duration and delay period. These performance, combustion and emission characteristics are compared with the results of baseline diesel engine.
Electric Dynamometer
An electric dynamometer used in this study was a high speed type eddy-current electro brake dynamometer.
Load and Speed Measurements
The engine was set to run at a constant speed of 1800 rpm. The load of the engine was obtained from load cell reading. The speed of the engine was monitored using sensor along with digital speed indicator.
[image:3.612.164.536.69.212.2]119
The fuel was supplied to the engine from the diesel tank, placed in the panel board. The burette was also placed in the panel board. When the fuel cock was closed the fuel to the engine will flow from the burette. The fuel flow rates were obtained by noting the time taken for 10 cc of fuel consumption.
Temperature Measurement
Temperature of the cooling water inlet, outlet and exhaust gas was measured with chrome alumel (K-Type) thermocouples.
Combustion Characteristics Measurement Devices
In order to investigate the combustion characteristics, the fuel injection timing measurement, the combustion pressure measurement and the crank angle detection were carried out. Fuel injection timings were detected by lift amount of a needle valve of the fuel injection nozzle. To detect the lift amount of needle valve, a needle lift sensor was installed in the fuel injector nozzle. The needle lift sensor detects the lift amount. The output signal of the needle lift sensor was recorded by the digital scope recorder. The calculation of timing for fuel ignition was made by the basis of the wave in accordance with the crank angle or driving condition of the engine. The needle lift sensor was used in this study and the position of sensor in the jet nozzle of the fuel injector is shown in Figure 2.
Pressure measurement for ascertaining the combustion chamber pressure is necessary, in order to obtain in each instance information regarding prevailing in the combustion chamber of the engine. Information regarding the pressure prevailing in the combustion chamber in each instance is important for monitoring the combustion. By means of this information, it can trace combustion characteristics such as combustion start timing, ignition timing and combustion end timing from pressure history of the combustion chamber. Therefore, to measure the combustion chamber pressure of the test engine, a piezo electric pressure transducer was installed in the upper side of combustion chamber or engine head assembly. The piezo-electric crystal, which serve as the pressure detection element, features self-temperature compensating gage developed by superior micro technology give minimal fluctuations in sensitivity minimal caused by temperature changes and zero-point fluctuations, enabling usage over a broad temperature range. To achieve the actual combustion pressure, the strain or minute mechanical changes occurred response to combustion pressure was traced and, signals detected by the pressure transducer were sent to digital scope recorder through an amplifier. Photo and outline drawing of engine pressure transducer are shown in Figure 3. As expressed in the above, to investigate the combustion characteristics of the engine, the crank angle detection is one of the important works. On the other hand, to correctly determine the fuel injection timing and ignition timing, the accuracy of the rotational direction of crankshaft or crank angle is important. To detect the crank angle of the test engine, crank angle detector assembly (a slit disc and magnetic pick-up) was used in this study. Crank angle detector assembly was fitted on the crank shaft of the test engine. The output signal from crank angle detector assembly was sent to digital scope recorder. To record and save the data, a digital scope recorder was used in this study. The data of injector needle lift, compression pressure and crank angle were sampled at every crank angles and average on 50 cycles were recorded. There are two types of files recorded in the hard disk of the digital scope recorder, they are HDR and WVF.
Exhaust Gas Emission Measurements Devices
In this study, hydrocarbon (HC), carbon monoxide (CO), nitrogen oxides (NOX) and smoke emissions from the
exhaust gas of the test engine were measured. Exhaust gas was sampled from exhaust pipe of the test engine. The HC, CO and NOX emissions from the test engine were measured by a CRYPTON 290 Series Emission
Analyser. Measurement of NOX is achieved by means of a chemical sensor fitted next to the oxygen sensor. The
sensor used to measure NOX concentration is a catalyst. Sample exhaust gases taken from exhaust pipe of the test
engine were passed through a filter and then entered to the NOX analyzer. Also the smoke emission from the test
engine was measured in this study. In order to measure smoke emission, an opacity (AVL make) type smoke meter was used.
Experimental Procedures
120
of experiment is a steady state engine test. The applications of loads were five levels and they were 0%, 25%, 50%, 75% and 100% loads respectively. The engine speeds at all load levels were adjusted for constant engine speed and fixed at 1800 rpm, In each load levels, the measurements of intake air, fuel consumption, intake air temperature, exhaust gas temperature, engine coolant temperature, fuel injection timing, combustion pressure, crank angle, hydrocarbon (HC) emission, carbon monoxide (CO) emission, nitrogen oxides (NOX) emission and smoke emission
were carried out and recorded the data. The same conditions, methods and procedures were used for both the experiments of biodiesel and diesel fuels. After the engine experiments for all kinds of fuels were finished, the experimental data calculation and the analysis were done. The calculation and analysis methods are expressed in detail.
RESULTS AND DISCUSSION
[image:5.612.201.408.194.589.2]Brake Thermal Efficiency
[image:5.612.213.400.355.438.2]Figure 4: Torque vs. efficiency B20
Figure 5: Torque vs. efficiency B40
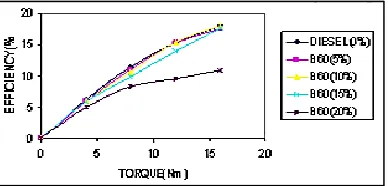
Figure 6: Torque vs. efficiency B60
The Brake Thermal Efficiency of engine was decreased with increase in amount of biodiesel blends is shown in Figures 4 to 6. When EGR rate is increased the efficiency also increases. Beyond 15% EGR level, the BTE also reduced significantly.
Specific Energy Consumption
To compare the properties under different operating conditions (such as fuels with different heating values). In order to compare the performance of such engines , SEC may be used.
[image:5.612.211.405.475.568.2]121
Figure 7: Torque vs. SEC diesel
Figure 8: Torque vs. SEC B20
Figure 9: Torque vs. SEC B40
Figure 10: Torque vs. SEC B60
The graph (Figures 7 to 10) shows that the variation of specific energy consumption with varied EGR rate along various blended fuels. Specific energy consumption of fuels is increased with increase in the amount of blended fuels owing to lower calorific values.
122
Figure 11: Torque vs. CO diesel, B20, B40 and B60
The graph (Figure 11) shows that the CO variation with various EGR levels. CO emissions were found to be lower for bio-diesel compared to diesel. CO levels increased as EGR rate was increased. However, CO emissions of JBD were comparatively lower. Very high CO values for diesel under higher EGR are due to the oxygen deficient operation. For bio-diesel, the excess oxygen content is believed to have partially compensated for the oxygen deficient operation under EGR. Dissociation of CO2 to CO at peak loads where high combustion temperatures and
comparatively fuel rich operation exists, can also contribute to higher CO emissions.
Unburned hydrocarbons (HC):
Figure 12: Torque vs. HC diesel, B20, B40, B60
The graph (Figure 12) shows variation of HC emission with EGR rate. Increase in HC was not significant as EGR level was increased for bio-diesel. This is probably due to oxygen content in bio-diesel compensating for oxygen deficiency and facilitating complete combustion. The variation over this range was only 10–40 ppm for bio-diesel. When increase the EGR rate then it reduces the bio-diesel blends emission. For B40 (15% EGR) is the minimum value of the HC emission.
[image:7.612.156.459.354.542.2]123
Figure 13: Torque vs. NOx diesel, B20, B40, B60
The graph (Figure 13) shows the variation of NOx emissions with various EGR rate for the entire load range. The NOx emission increased with increase in biodiesel amount in the blended fuels and also found that NOx emission from the biodiesel fuel was higher than that of diesel. Probable reasons for increase in NOx concentration by about 2 to 10 per cent from biodiesel fuelled engine was due to higher oxygen level in the fuel. When EGR rate is increased the NOx level is decreases as shown in Figure 12. AT B20(15% EGR) is the minimum value of the full load ranges. Even though 20% EGR were able to reduce NOx by a large amount, reduction in BTE and large increase of CO and HC emissions were observed.
Cylinder Pressure
Cylinder pressure data obtained at 3/4 load, no EGR condition was found to be comparable for diesel and bio-diesel. Peak pressure was found to be 62 bars for diesel and 60 bars for bio-diesel under these conditions. This is indicative of good mixture formation for diesel at higher loads where temperatures are high.
Pressure vs. Crank Angle
The percentage of heat input is taken for diesel and various blends with 15% EGR and without EGR. The Figure 14 shown compares the crank angle (deg) with Pressure for all fuels blends with 15% EGR and without EGR. As seen in Figure 14, the amount of energy supplied increases with pressure. Minimum values for the engine is without EGR and maximum values for engine is with 15% EGR.
Figure 14: Pressure vs. crank angle
Heat Release Rate
[image:8.612.197.418.485.567.2]124
Figure 15: Heat release rate vs. crank angle
Rate of Pressure Rise
[image:9.612.188.425.240.341.2]The Figure 16 shows that the variation of rate of pressure rises with crank angle. Higher rate of pressure rise is indicative of noisy operation of the engine. Rate of pressure rise was found to be comparable for both fuels without EGR and with optimized EGR level of 15%. Peak values at ¾ loads were found to be 1.2 bar/deg. Comparable rate of pressure rise obtained is indicative of stable and noise free operation of compression ignition engines with JBD.
Figure 16: Rate of pressure rise (bar) vs. crank angle
Cumulative Heat Release
Cumulative heat release were found to be comparable for both fuels without and with optimized EGR of 15% as shown in Figure 17. The maximum cumulative heat release rate occurred for diesel with EGR of 15% is 415.29 j/deg.
Figure 17: Cumulative heat release vs. crank angle
CONCLUSION
The Kirloskar Engine was used to test Methyl Esters of ALGAE oil (MEJ) and its blends and compared with conventional commercial diesel fuel. The brake thermal efficiency for biodiesel and its blends was found to be slightly less than that of diesel fuel at tested load conditions and Specific Energy Consumption of fuels is increased in increase the amounts of blended fuels owing to lower calorific values. But compares the b20 fuels to other blended fuels it’s the maximum calorific values. The carbon monoxide (CO) emission of engine was increased with increase in amount of biodiesel blends. When EGR rat is increased then efficiency slightly decreased as higher EGR and CO increases. The NOX AND HC emission decreased with increase in EGR rate in biodiesel amount in the
blended fuels and also found that NOX and HC emission from the biodiesel fuel was higher than that of diesel.
[image:9.612.187.426.408.509.2]125
REFERENCES[1] T Myo. The Effect of Fatty Acid Composition on the Combustion Characteristics of biodiesel. Ph.D., Thesis, Kagoshima University, Japan, 2008.