International Journal of Emerging Technology and Advanced Engineering
Website: www.ijetae.com (ISSN 2250-2459,ISO 9001:2008 Certified Journal, Volume 3, Issue 2, February 2013)
208
Performance Evaluation of Energy Efficient QOS Assurance
Routing in WMSN
Geethanjali.V
1, Sudha.R
21PG Scholar, 2Assistant professor/ECE, Sri Shakthi Institute of Engineering and Technology, Chinniyampalayam,
Coimbatore-641062
Abstract- One of the important and challenging problems in the the routing design of WMSN is the development of an efficient QOS routing protocol that can provide high-quality communications among mobile hosts interference management. It has been a key concept for designing future high data-rate wireless systems that are required to employ dense reuse of spectrum. This paper describes how to select the routing with high energy efficiency and quality of service. A QoS trust estimation model based on social network analysis which enables each sensor node measuring the service quality by monitoring the behaviors of neighbour nodes. An energy efficient QoS assurance routing based on cluster hierarchy (EEQAR) is proposed to balance the energy consumption and meet the requirement of QOS between the source and destination. An Round allocation mechanism and TDMA schemes are incorporated in EEQAR to avoid the conflicts during data transmission. The simulation results show the high performance of EEQAR routing in lifetime and quality of service.
Keywords- Cellular topology, data correlation, energy efficiency, social network analysis, wireless multimedia sensor networks (WMSNs).
I. INTRODUCTION
WIRELESS multimedia sensor networks (WMSNs) as a novel derivative network have recently emerged as an important technology and drawn the attention of the researchers in the past few years. With rapid improvements and miniaturization in hardware, the sensor nodes of WMSNs are equipped with CMOS camera, microphone, and other kinds of sensors to ubiquitously capture the fine-grained, accurate information in a comprehensive environmental monitoring. They can capture the surrounding environment in a variety of media information and have outstanding performance in multimedia signal acquisition and processing.. It cannot only enhance existing sensor network applications, but also enable several new applications. Since it is energy sensitive and without fixed infrastructure, the design of WMSNs routing mechanism with high energy efficiency is still very important and faces more challenges than WSNs, which concerns energy constraints, limited computing power, and memory availability of the sensor nodes. Moreover, the quality of service (QoS) is also an important criterion to measure the performance of network.
This paper evaluates the performance of an energy efficient Qos assurance routing for WMSNs, where cluster hierarchy is adopted on account of the good flexibility and high communication efficiency. The obvious advantages of hierarchical architecture in WMSNs are as follows. First, for a real WMSN contains hundreds or thousands of multimedia sensor nodes, hierarchical architecture is efficient to divide and manage the application of distributed computation and communication. Second, the sensory data are in high relativity in one cluster because the sensor nodes are unavoidable to be distributed in redundancy. The unnecessary data transmission can be reduced by data fusion process of cluster head. Third, most of sensor nodes can turn off radio model to reduce energy consumption and avoid the communication conflicts in a quite long period which can significantly prolong the lifetime and improve the Qos of the whole network. For these reasons, the cluster hierarchy is suitable for WMSNs, specially in a large scaled deployment network. Moreover, for the sake of reducing the node burden and improving the whole performance of network, some agent nodes are introduced into network acting as cluster head to manage and collect the data sent from the nodes in their clusters. To optimize the network performance, we introduce a social network analysis similar to wireless multimedia sensor network. In this analysis, social structures are formed, where the nodes are usually represented by individuals or organizations and the links are represented by the relationships that exist between these entities.
II. SYSTEM OVERVIEW
In our research, the wireless multimedia sensor network is organized by a set of multimedia sensor nodes, denoted as s = {s1, s2, . . . , sn}, and only one sink node. Additionally, for improving the whole performance of network, we also introduce some agent node, denoted
as G = {g1, g2, . . . , gm}, where m is much less then n
International Journal of Emerging Technology and Advanced Engineering
Website: www.ijetae.com (ISSN 2250-2459,ISO 9001:2008 Certified Journal, Volume 3, Issue 2, February 2013)
209
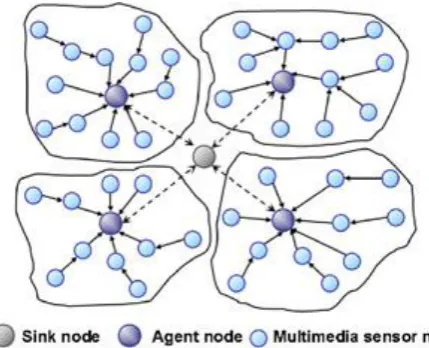
[image:2.595.55.270.266.440.2]The agent nodes are movable and not limited by energy. They have a much better ability of communication and computation than multimedia sensor nodes. The network architecture is depicted in Fig. 2.1. The sensor nodes are grouped into clusters based on many criteria such as communication range, number and type of sensors, and geographical location. Each cluster has a agent node that manages all the sensor nodes in its cluster, which are significantly less energy-constrained than the ordinary sensor nodes. The agent node will take charge of sensor organization and network management.
Fig 2.1 Network Architecture of WMSN.
III. PROBLEM EXISTING
As shown in above figure, such a wireless multimedia sensor network consists of a series of multimedia sensor nodes, one sink node, and some agent nodes. Multimedia sensor nodes complete monitoring task and send their data to the agent nodes, while the agent nodes act as cluster heads to manage and collect the data sent from all the sensor nodes in their clusters. Therefore, the sensor nodes are the source nodes and the agent node is the destination node in each cluster. Due to the different communication ability from agent node to sensor node, most of the senor nodes cannot send their data to agent node directly. To avoid the loss of data, all the sensor nodes need to find at least one route which can reach to the agent node in their cluster. Sometimes, there will only be one route that can be found. However, the densely deployed nodes make it find more possible paths. The crucial of our research is how to select one routing with high energy efficiency and service of quality.
IV. PROPOSED ALGORITHM
A. Energy Efficient QoS Assurance Routing
In this section, we propose an energy efficient QoS assurance routing based on cluster hierarchy, which named EEQAR.
The above mentioned QoS trust estimation model is adopted in EEQAR to meet the QoS requirement. To obtain a better performance, the cluster structure is formed based on cellular topology. The design objective of EEQAR is to improve the energy efficiency in the condition of assurance of QoS.
4.1 Cellular Topology Formation
With the introduction of agent node in WMSN, we can easily establish the cluster structure for our purpose. To obtain a better performance, the cluster structure of EEQAR is formed based on cellular topology. The cellular topology is formed on the basis of geographical position of agent and multimedia sensor nodes. After the deployment, it sends an advertisement message including its ID. Then the multimedia sensor nodes receive these advertisement messages and select one cluster to join in. Only the agent node needs to maintain in activity, while the multimedia sensor nodes can turn to sleep when they have no task. Considering to reduce the network cost, the number of agent nodes should be as less as possible. Therefore, EEQAR needs these agent nodes to manage as large as possible area. After each node finds its forward node, the establishment of intra cluster routing is finished.
Since each agent node is at the center of cellular cluster, the length of hexagon is L, then
√3L/2=R/2=⇒L=√3R/3
Therefore, the area of cellular cluster can be calculate as follows:
Sc ==√6R2/2
4.2 Routing Establishment
The process of routing establishment means to each node selecting its forward node. In order to realize the optimization target, an optimization factor table needs to be built to store relative information for routing probe from source node to the agent node. There are three kinds of values in the table and each value is a optimization factor used by EEQAR protocol:
1) T (si , sj): the QoS trust value of node sito
node sj;
2) E (si , sj): energy level of node si to sj;
3) C (si , sj): correlation between node siand sj.
These values can be exchanged by two neighbor nodes without the overall information. As we described above,
T (si, sj) is determined by the direct and indirect
International Journal of Emerging Technology and Advanced Engineering
Website: www.ijetae.com (ISSN 2250-2459,ISO 9001:2008 Certified Journal, Volume 3, Issue 2, February 2013)
210
( ) (1)
Where Er(sj) represents the remaining energy of node
sj , Eint represents the initial energy of sensor node. As
each node only knows its own remaining energy, it will increase the communication consumption of neighbor nodes to exchange these information, which is not suitable for updating the remaining energy in high frequency. Here, the energy information will be sent together with the data transmission.
In WMSN, the multimedia sensor node often needs to be equipped with more than one kind of sensors, which can collect different kinds of monitoring data. We assume there are gth kinds of data in node si and h kinds of data in node sj . Then, the common property between the two nodes still has correlation. It can be calculated as follows:
C(si, sj) =
(2)
Where ρg (si, sj) represents the correlation of the gth
common property in nodes si and sj. n(g) and n(h) represent the type number of data in nodes si and sj , respectively. n(g, h) represents the number of the same common property. Based on the optimization factor table each node finds its forward node according to (1) .For
H(sj) < H(si) P(si,sj)=
(3) Where P(si, sj) is the value of the path from node si to node sj . It combines energy , QoS and data correlation into a single quantity with a comparable magnitude. , , and are the parameters that control the relative weight of different components. H(si) and H(sj) represent the hop number of nodes si and sj to agent node. The node with the highest value of P will be selected as the forward node and this process is looped and ended by all routes established.
4.3 Round Allocation and Time-Slot Assignment
The operation procedure of EEQAR is divided into a number of rounds and there are three phases in each round, namely cluster building phase and routing probe phase and steady state phase as shown in Fig. 6, which is similar to most of the existing clustering routings. In the cluster building phase, the cellular cluster topology construction is formed. In the routing-probe phase, intercluster and intracluster routes are built. In the steady state phase, the data collection will be completed. The duration time of steady state phase is much longer than other two phases are introduced. Like other cluster schemes, to avoid the conflicts during data transmission, the agent nodes also need to manage a table of time division multiple access (TDMA) to assign the time-slot for sensor nodes belonging to its cluster.
The ordinary sensor nodes can turn off their radio model in the sleep period to reduce their energy consumption. For multihop communication, the simple one variable linear table is not suitable in EEQAR any longer. Here, the agent node does not need to distribute time-slot for all the member sensor nodes, but only for those sensor nodes with one hop. If a member node does not contain any son node, its time-slot is allocated as 1, then notify to the upper sensor node. If the member node contains only one son sensor node, they will set the time-slot assignment as same as the son sensor node. If the member sensor node contains more than one son node, the time-slot of this member node is distributed as sum of all its son nodes.
B. QOS Trust Estimation Model
Above all, we introduce distributed metrics to build the trust relationship between the sensor nodes in our scheme. Each node needs to judge the service level of its neighbor nodes supply. Behavior monitoring is the fund of this model, which can judge the behavior of neighbor node during data collection and give the trust evaluating on its service level. Besides direct monitoring the target node, the indirect information is also the important component to calculate the trust value. They are not obtained from the direct evaluating the nodes but from the monitoring of neighbor nodes on other nodes.
The direct trust value can be calculated as follows: dl(sj) = l |
| (4)
Where l denotes weight factor of the l kind of service and . μl (si) and σl (si), respectively, sample average and
standard deviation of the l kind of service of N(si). Then the whole direct trust value of QOS for si on sj can be
calculated as follows: For ∀st N(si) Td (si, sj) =
(5)
The final trust value of node sj computed by node si is
calculated as follows:
T (si, sj) = λdTd (si, sj) + λ (6)
Where λd (0,1) denotes the weight of direct trust value and λr =1 − λd denotes the weight of indirect trust value. Compared to global management, the trust management can greatly reduce the energy consumption for exchanging information, which is more benefit for WMSN.
V. METRICES
International Journal of Emerging Technology and Advanced Engineering
Website: www.ijetae.com (ISSN 2250-2459,ISO 9001:2008 Certified Journal, Volume 3, Issue 2, February 2013)
211
A. Simulation parameters
5.1 Remaining Energy
It is defined as the total energy remains in each node with respect to the initial energy. It is measured in Joules.
5.2 Consumed Energy
It is defined as the total energy consumed in each node with respect to the initial energy. It is measured in Joules.
5.3 Reliabilty
It reflects the ratio of the data correctly transmitted from the source node to the destination.
5.4 Network Lifetime
It is defined as the time until the first node dies due to energy depletion for the sake simplicity.
5.5 Remaining Energy Ratio
It is the ratio of energy remained to the total initial energy when the running of network is end.
B. Testing Model
Time model is used for simulation, which is defined below.
Time model means varying time but node’s speed, Transmission rate, number of flows and number of nodes is kept constant.
[image:4.595.309.575.162.502.2]Simulation environment used for this model is shown in table 1.
TABLE I.
SIMULATION PARAMETERS
Parameters
Values
Routing Protocols
EEQAR
Number of nodes
200
Simulation Time
200 Sec
Time
50,100,150,200
Environment Size
250 * 250
Traffic Type
CBR
Mobility Model
Random Way Point Model
Antenna Type
Omni Antenna
Protocol
TCP
VI. SIMULATION RESULTS
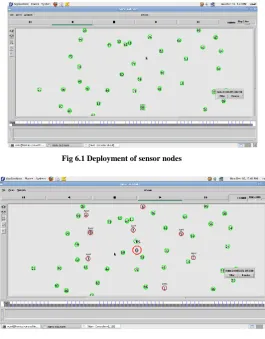
Fig 6.1 Deployment of sensor nodes
Fig 6.2 Identification of Agent nodes based on cellular topology
[image:4.595.43.285.478.730.2]International Journal of Emerging Technology and Advanced Engineering
Website: www.ijetae.com (ISSN 2250-2459,ISO 9001:2008 Certified Journal, Volume 3, Issue 2, February 2013)
[image:5.595.48.281.116.267.2]212
Fig 6.4 Transformation of data among different clusters
Fig 6.5 Time Versus Remaining Energy
[image:5.595.313.551.133.384.2]Figure 6.5 shows the comparison of time and remaining energy for different number of nodes in EEQAR. The black coloured line in the graph above indicates remaining energy for nodes 10, red coloured line indicates remaining energy for nodes 20, blue coloured line for nodes 30.
Fig 6.6 Time Versus Consumed Energy
[image:5.595.50.283.285.529.2]Figure 6.6 shows the comparison of time and consumed energy for different number of nodes in EEQAR. The black coloured line in the graph above indicates consumed energy for nodes 10, red coloured line indicates consumed energy for nodes 20, blue coloured line for nodes 30.
[image:5.595.317.549.470.710.2]International Journal of Emerging Technology and Advanced Engineering
Website: www.ijetae.com (ISSN 2250-2459,ISO 9001:2008 Certified Journal, Volume 3, Issue 2, February 2013)
213
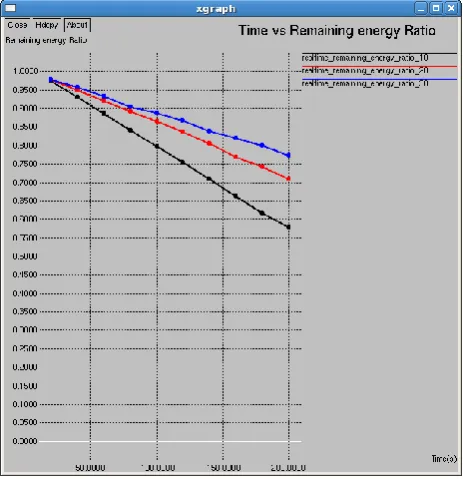
Figure 6.7 shows the comparison of time and remaining energy ratio for various numbers of nodes in EEQAR. The black coloured line in the graph above indicates remaining energy for nodes 10, red coloured line indicates remaining energy for nodes 20, blue coloured line for nodes 30.
VII. CONCLUSION
As a resource-constrained network, wireless multimedia sensor network should try to reduce the unnecessary energy consumption and guarantee the quality of data transmission. In this paper, we studied how to select the routing with high energy efficiency and quality of service. We proposed an energy efficient QoS assurance routing based on cluster hierarchy for WMSN (EEQAR). The EEQAR routing can efficiently balance the energy consumption and meet the requirement of QoS between the source and destination. To achieve better performance, we formed the cluster structure by cellular topology. Moreover, we designed the QoS trust estimation model based on social network analysis, which enables sensor nodes measuring the supplied service quality of neighbor nodes. We performed extensive simulation experiments to evaluate EEQAR by several performance indexes. The results show that EEQAR performs high efficiency on network lifetime and QoS in wireless multimedia sensor network.
REFERENCES
[1 ] C. Y. Lin, Y. C. Tseng, W. C. Peng, T. H. Lai, and H. W. Fang, “TPGF: Message-efficient in-network location management in a multisink wireless sensor network,” Int. J. Ad Hoc Ubiquitous Comput., vol. 3, no. 1,
[2 ] N. Xiong, M. Cao, A. V. Vasilakos, L. T. Yang, and F. Yang, “An energy-efficient scheme in next generation sensor networks,” Int. J. Commun. Syst., vol. 23, nos. 9–10, pp. 1189–1200, Sep. 2010. [3 ] T. He, J. A. Stankovic, C. Lu, and T. Abdelzaher, “SPEED: A
stateless protocol for real-time communication in sensor networks,” in Proc. 23rd IEEE ICDCS, May 2003.
[4 ] L. Zhou, N. Xiong, L. Shu, A. Vasilakos, and S.-S. Yeo, “Context-aware multimedia service in heterogeneous networks,” IEEE Intell. Syst., vol. 25, no. 2, pp. 40–47, Mar.–Apr. 2010. [5 ] J. Wang, L. Shu, X. Wu, and S. Lee, “A load balancing and
energy aware clustering algorithm in wireless ad hoc networks,” J. Multimedia Technol., vol. 5, no. 1, pp. 1108–1117, 2005. [6 ] Q. J. Tian, S. Bandyopadhyay, and E. J. Coyle, “Designing
directional antennas to maximize spatio-temporal sampling rates in multihop clustered sensor networks,” J. Internet Technol., vol. 8, no. 1, pp. 1–9, 2007.
[7 ] L. Zhou and Y. Zhang, “Distributed media-service scheme for P2P-based vehicular networks,” IEEE Trans. Vehicular Technol., vol. 60, no. 2, pp. 692–703, Feb. 2011.
[8 ] M. Chen, S. Gonzalez, A. Vasilakos, H. Cao, and V. Leung, “Body area networks: A survey,” ACM/Springer Mobile Netw. Applicat. (MONET), vol. 16, no. 2, pp. 171–193, Apr. 2010. [9 ] M. Chen, V. Leung, S. Mao, and T. Kwon, “RLRR:
Receiver-oriented load-balancing and reliable routing in wireless sensor networks,” Wirel.Commun. Mobile Comput., vol. 9, no. 3, pp. 405–416, 2009.