Munich Personal RePEc Archive
Measuring teacher and school
effectiveness at improving student
achievement in Los Angeles elementary
schools
Buddin, Richard
RAND Corporation
May 2011
Online at
https://mpra.ub.uni-muenchen.de/31963/
_____________
Note: Richard Buddin is a senior economist at the RAND Corporation. He performed this study as an independent contractor for the Los Angeles Times. The RAND Corporation was not involved in the study or analysis. The author is grateful for comments and suggestions from Julian Betts, Greg Duncan, George Farkus, Bing Han, June Rivers, William Sanders, Doug Staiger, Gema Zamarro, and Ron Zimmer as well as workshop participants at Indiana University, University of California at Irvine, and the University of California at Los Angeles, and ACT. The author is solely responsible for remaining errors.
MEASURING TEACHER AND SCHOOL EFFECTIVENESS AT IMPROVING STUDENT ACHIEVEMENT IN LOS ANGELES ELEMENTARY SCHOOLS
Richard Buddin May 2011
1. INTRODUCTION
American education faces major challenges in improving education outcomes especially for low-income and minority youths who are often concentrated in large metropolitan school districts. These at-risk students often start school behind their peers and are often concentrated in neighborhoods and schools where they have little interaction with students from more affluent families. In addition, teachers often prefer to work near home, so more experienced teachers often shift to schools in wealthier parts of urban districts (Boyd et al., 2005). As a result, many at-risk students are taught by
inexperienced teachers with relatively weak academic credentials (Steele and Murnane, 2007). The problem is compounded by high turnover at schools in low-income areas as poorly prepared teachers leave the profession entirely or shift to less stressful suburban schools that are closer to their residences.
Los Angeles Unified School District (LAUSD) faces many of these challenges in providing a quality education for its students. The district is the second largest in the country with an annual enrollment of about 670,000 students and 36,000 teachers. About 74 percent of students are Hispanic, and 10 percent are Black/African American. About 79 percent of students are eligible for free or reduced school lunch. Over half of LAUSD students enter school with limited English proficiency. About 28 percent of students are classified as English Language Learners (ELLs) and receive special instruction to improve their English proficiency. Another 28 percent initially participated in ELL programs and are Reclassified to Fluent English Proficient (RFEP).
In the past several years, improving teacher quality has been a pervasive concern of parents, educators, and policymakers. Teaching quality is an important malleable factor available to schools and districts for improving student learning. While family income and background are key factors affecting student preparation and success in school, effective teachers may partially offset the disadvantages faced by at-risk minority and low-income students.
2
teacher” in all classrooms and public reporting of teacher qualifications. In 2009, eligibility for federal Race to the Top (RTT) funding was restricted to states that used student achievement in teacher assessments. In addition to these national policies, teacher quality and student achievement progress have been key issues in state and local debates throughout the country.
In the past several years, new research has emerged that more effectively measures student achievement from year to year and creates the potential to tie student progress with individual teachers and other school inputs. NCLB and a series of other reforms have led states to develop annual testing of students in most grades (at least in reading and mathematics). Several states and some districts maintain individual student
identifiers that allow researchers to track student progress from year to year and link that progress with changes in school resources or teachers or school practices. This type of data collection offers researchers improved tools for measuring how individual school inputs affect student outcomes.
The new measures rely on so-called "value-added" methods that isolate teacher and school contributions to student learning, conditional on individual student background and preparation. Teachers or schools are characterized as "high quality" if their students make above average improvements in student achievement relative to other teachers or schools with comparable students.
The new methods are contrasted with traditional metrics that focus on the average achievement level of students at a school. In the traditional approach, "high-performing" schools have students with higher achievement or proficiency than the average school. The problem with this approach is that student achievement is strongly influenced by student background and preparation. As a result, the "high-performing" schools are inevitably schools with few disadvantaged or low-income students. Traditional methods are ill-suited for separating a school's success in improving student outcomes from its success in attracting students with strong preparation. By design, value-added measures isolate whether some schools (or teachers) do a better job of improving student
achievement than do others.
Teacher evaluations are traditionally based on short classroom observations by school principals. Administrators typically give the highest rating to nearly all teachers, irrespective of the academic success of students in their classrooms (Weisberg et al., 2009). About 75 percent of teachers receive no advice on how to improve instruction, and many administrators have never failed to renew a probationary teacher (Weisberg et al., 2009). Some districts are supplementing these traditional teacher evaluations with value-added measures of teacher performance, and RTT has focused more attention on the use of student achievement as an element in teacher evaluation.
3
standard and targeted for special professional development programs. Newton (2004) reported that over 90 percent of teachers received no negative ratings on any of the 25 items.1
The subjective LAUSD teacher evaluations, like those in most districts, have several limitations. First, the evaluations rate teacher effectiveness against a nominal standard of how teachers should “perform” and not against a measure of how much students actually learn. Ideally, standards would reflect practices that are ultimately linked with better learning, but the evaluation process takes this link as given. Second, the evaluations are based on observations of one pre-announced class by a school administrator. Teacher (and student) behavior during this visit differ from the norm, and administrator decisions may be distorted by interactions outside the classroom. Finally, the evaluations do not provide adequate feedback for teachers to improve their performance. Presumably, many (if not all) teachers could benefit from constructive recommendations on their
instructional practices, but the current evaluation simply identifies the 2 percent of teachers who are unsatisfactory and provides no information to the other 98 percent of teachers.
This study focuses on value-added measures of student achievement for elementary school students in LAUSD. Value-added provides an important summative measure of how teachers and schools improve student learning. If some teachers or schools are more effective than others at improving achievement, then value-added measures will provide an important indication of practices and policies that improve student outcomes. The study addresses five primary questions.
1. How does teacher quality vary across classrooms and across schools? The
analysis uses longitudinally linked student-level data to examine whether students consistently perform better in some teachers’ classrooms than in others. The study also assesses whether “high quality” teachers are concentrated in a portion of schools with well-prepared, motivated students or whether higher performing teachers teach both high- and low-performing students.
2. Do traditional measures of teacher quality like experience and teacher educational preparation explain their classroom results? Teacher pay is typically based on teacher experience and education level (Buddin et al., 2007), so it is important to assess whether these teacher inputs are tied to better classroom outcomes.
3. How sensitive are value-added models to alternative measures of student and classroom characteristics? Student background and motivation are important in academic success, so it is important that models adequately adjust for the potential success of students in the classroom. The analysis examines the
sensitivity of value-added measures to various controls for student characteristics and classroom peers.
4. How reliable are teacher and school value-added measures from year to year? If teacher and school effectiveness vary substantially from year to year, then value-added estimates offer little indication of what factors improve student learning.
4
Alternatively, if some teachers or schools are persistently more effective than others, then new research might identify factors that differentiate effective teachers and schools.
The answers to these types of questions will help policymakers to understand differences in teaching quality and to construct policies and incentives for improving the quality of the teacher workforce.
At the outset, we acknowledge several limitations of value-added measures. First, student achievement tests are not administered until 2nd grade, so the measures provide no indication of the effectiveness of kindergarten or 1st grade teachers.2 Second, annual tests are only given in English Language Arts (ELA) and math. These subjects are important and key building blocks for other subjects, but the tests do not provide a comprehensive indication of what students learned or everything that they should know at their grade level. Third, standardized tests are imperfect measures of learning because students may misunderstand what is expected or because individual students may have test anxiety or other issues on the day of the test. Some of these problems will "average" out across students in a classroom or school.
While these deficiencies in value-added models are a concern, the models offer an important opportunity to identify what factors improve student outcomes over time. Value-added approaches are not intended to replace measures of student proficiency as indications of academic success, but the new approaches offer valuable insights into how districts might align their resources to improve the proficiency levels of all students.
The remainder of the paper is divided into five sections. The next section reviews recent literature on teacher quality. Section 3 describes the LAUSD data used in the analysis. Section 4 documents the empirical methods used in the analysis of student achievement tests, and Section 5 presents the results. The final section integrates the findings and offers conclusions.
2. PRIOR TEACHER QUALITY LITERATURE
Research on teacher effectiveness has progressed through three distinct stages that are tied directly to data availability and emerging empirical approaches. Initial studies relied on cross-sectional data that were often aggregated at the level of schools or even school districts (Hanushek, 1986). This approach related average school test scores to aggregate measures of teacher proficiency. Hanushek (1986) showed that most explicit measures of teacher qualifications like experience and education had little effect on student
achievement. In contrast, implicit measures of teacher quality (i.e., the average
performance of individual teachers) differed significantly across teachers. These studies were plagued by concerns about inadequate controls for the prior achievement of students
5
attending different groups of schools. If teachers with stronger credentials were assigned to schools with better prepared students, then the estimated return to teacher credentials would be overstated.
A new round of studies focused on year-to-year improvements in student achievement. These studies implicitly provided better controls for student background and preparation by isolating individual student improvements in achievement. They provided some evidence for differences in teacher qualifications affecting student achievement gains. For example, Ferguson (1991) found that scores on the teacher licensing test in Texas— which measures reading and writing skills as well as a limited body of professional knowledge—accounted for 20-25 percent of the variation across districts in student average test scores, controlling for teachers’ experience, student-teacher ratio, and percentage of teachers with master’s degrees. Ferguson and Ladd (1996) found smaller effects using ACT scores in Alabama. Ehrenberg and Brewer (1995) found that the teacher test scores on a verbal aptitude test were associated with higher gains in student scores although the results varied by school level and students’ racial/ethnic status. Using data from the 1998 National Educational Longitudinal Study (NELS), Rowan et al. (1997) found that teachers’ responses to a one-item measure of mathematics knowledge were positively and significantly related to students’ performance in mathematics, suggesting that teacher scores on subject matter tests may relate to student achievement as well. A few studies that examined pedagogical knowledge tests found that higher teacher scores were also related to higher student test performance, although many of these were dated (1979 or earlier). Strauss and Sawyer (1986) reported a modest and positive relationship between teachers’ performance on the National Teacher
Examination (NTE) and district average NTE scores, after controlling for size, wealth, racial/ethnic composition, and number of students interested in postsecondary education in the district.
The most recent literature on teacher quality has used panel data to better control for student heterogeneity and in some cases teacher heterogeneity. Rivkin et al. (2005) is one of the earliest and perhaps most influential studies to estimate teacher effects from panel data (working drafts of the final report were available in 1998). The study uses
longitudinal data on individual student achievement scores for Texas students in grades 3 through 6.3 They use a value-added gains model with student and school fixed effects. Teacher quality has a large effect on student achievement in this study, but only a small share of the differences in teacher quality is explained by observed qualifications of teachers like experience and education. In addition, they find that most of the variability in teacher quality was within schools and not across schools—an indication that high-performing teachers were not concentrated in a few schools.
Jacob and Lefgren (2008) examine how differences in teacher quality affected student achievement in a midsized school district. Like Rivkin et al. (2005), they find large differences in value-added measures of teacher effectiveness (teacher heterogeneity) but
6
small effects of teacher qualifications like experience and education. They find that school principal rankings of teachers are better predictors of teacher performance than are observed teacher qualifications.
Harris and Sass (2006) examine how teacher qualifications and in-service training affected student achievement in Florida. A value-added gains model controlled for student and teacher fixed effects. They find small effects of experience and educational background on teacher performance. In addition, they find that a teacher’s college major or scholastic aptitude (SAT or ACT score) is unrelated to their classroom performance.
Clotfelter et al. (2006) finds fairly similar parameter estimates for a variety of valued-added models for elementary students and teachers in North Carolina. They find that teacher experience, education, and licensure test scores have positive effects on student achievement. The authors show that bundling of teacher qualifications does produce effect sizes differences of about 0.20 in math and 0.12 in reading. As a result, these authors argue that traditional measures of teacher quality do have an important effect on student achievement in North Carolina.
Goldhaber (2007) also focus on elementary students in North Carolina. He finds a small effect of teacher licensure test scores on student achievement. This model is based on the value-added gain score model with lagged test score as a regressor. The author argues that raising the passing cut score would substantially reduce the pool of eligible teachers in North Carolina without having a substantial effect on student achievement scores. Aaronson et al. (2008) looks at teacher quality and student achievement in Chicago public schools. The study uses a gain score approach with controls for student and teacher fixed effects. The results show strong effects of teachers on student achievement, but traditional measures of teacher qualifications like education, experience, and
credential type have little effect on classroom results.
Koedel and Betts (2007) use a value-added gains model to look at student achievement of elementary students in San Diego. Like several of the other studies, they find that teacher quality is an important predictor of student achievement, but measured teacher
qualifications (experience, quality of undergraduate college, education level, and college major) have little effect on student achievement.
The results from these studies are fairly consistent in showing that teacher quality has large effects on student achievement, but specific teacher qualifications have small effects on achievement (the exception is the one North Carolina study). Only the two studies with North Carolina data have information on teacher licensure scores. A concern for the results from these studies is the absence of controls for teacher heterogeneity. The assumption that schools or teachers are homogenous (no controls for school unobserved heterogeneity or teacher unobserved heterogeneity) or that their differences can be controlled with observable characteristics has been contradicted by the evidence from the other studies. We argue that it is important to control for teacher heterogeneity to get consistent estimates of the student achievement model.
7 LAUSD Elementary Schools
This study uses panel data from the Los Angeles Unified School District (LAUSD) for students in grades 2 through 5 for seven consecutive school years from 2003-04 through 2009-10. The students are enrolled in self-contained classrooms taught by a single teacher, where the student and teacher data are linked by an identifying variable.4
This matched LAUSD student/teacher data is unusual in student achievement analysis. Districts often maintain separate administrative records for teachers and have difficulty linking students to individual teachers. Rivkin et al. (2005) are not able to match individual teachers with students and rely on the average characteristics of teachers in each grade and year for their study. Similarly, North Carolina data links students with the individual who proctored the test and not necessarily the student’s teacher. Clotfelter et al. (2007) rely on an imputation strategy to link students with their classroom teacher. The authors were able to match about 75 percent of elementary math and reading teachers.
California measures student achievement with the California Standards Test (CST). Test scores reflect student performance for each grade and subject. The CST is aligned with state curriculum standards and administered to nearly all students in grades 2 through 11 each spring. The tests are not vertically aligned across grades. In this analysis, English Language Arts (ELA) and math raw scores are standardized by grade and year, so the results reflect student progress from year to year relative to their respective grade/year cohort.
Table 3.1 shows differences in the mix of students and teachers at schools with low and high average test scores. Elementary schools in the lowest quartile have average test scores about 1.1 standard deviations lower than those at the highest quartile schools. The low scoring schools have much larger shares of parents that did not graduate from high school and of students learning English. The proportions of black and Hispanic students are much higher at low scoring schools than at high scoring schools. In contrast, most Asian/Pacific Islander students are at schools in the higher quartile.
Teacher characteristics also vary substantially across schools. Teachers at low-quartile schools are less experienced than their counterparts at high-quartile schools and are less likely to have graduate school training. The share of probationary teachers at low scoring schools is nearly twice that at high scoring schools. Teacher licensure scores are
consistently much lower in the lowest quartile schools than in the highest quartile schools. Finally, the proportion of minority teachers is much higher at the low-scoring schools.
The LAUSD data was combined with two other data sources that contained information on school characteristics. The Academic Performance Index (API) data files provide
8
school-level measures of student demographics as well as how students perform on state mandated tests. The API is a composite measure of how well the school performs on state accountability tests (primarily the CST for elementary students). Data from the California Basic Educational Data System (CBEDS) was used to build grade-level shares of
students by race/ethnicity at each school.
Table 3.1 shows sharp differences in the mix of students attending low- and high-performing elementary schools. Low-high-performing schools have much higher
[image:9.612.156.460.264.517.2]concentrations of ELLs and Hispanic students than do high-performing students. In addition, the low-performing schools draw much larger shares of students eligible for free/reduced lunch and from family without a parent completing high school.
Table 3.1--Comparison of Student and Teacher Characteristics in Elementary Schools with Lowest and Highest Test Scores in 2010
School Characteristic
Lowest Quartile Schools
Highest Quartile Schools
District Overall|
ELA (standardized) -0.35 0.46 -0.01
Math (standardized) -0.33 0.40 0.00
Student Characteristics
Parents not high school graduates 0.49 0.15 0.36 Eligible for Free/Reduced Lunch 0.96 0.56 0.84
English Language Learner 0.48 0.20 0.37
Black 0.11 0.09 0.09
Hispanic 0.87 0.49 0.76
Asian/Pacific Islander 0.01 0.08 0.03
Teacher Characteristics
Experience 13.9 14.7 14.3
Experience<3 years 0.01 0.00 0.00
Master’s or Ph.D. 0.34 0.32 0.34
Probationary teacher 0.00 0.00 0.00
Black 0.15 0.06 0.10
Hispanic 0.46 0.22 0.38
In terms of traditional teaching credentials, Table 3.1 shows that the teachers at low-performing schools have similar experience, advanced educational training, and credentials with those at high-performing schools. This similarity reflects budget
9 Analysis Variables and Data Exclusions
The LAUSD data includes information on student background and test scores. The student-level data is linked to individual teacher data each year, so student progress is tracked from year to year and from class to class. The data also includes characteristics of the student’s teacher each year.
The student characteristics include a range of demographic information. The highest level of parental education is a key indication of the socio-economic status of each student. Family wealth rises sharply with education, and students with well-educated parents are likely to have greater education-related resources in the home. Title I eligibility identifies disadvantaged students that are eligible for special educational services. ELL status is based on an annual test of English proficiency that is given to ELLs in the fall of each school year. Limited English proficiency impedes student academic progress especially in ELA. Elementary students may struggle as they adjust to new schools, so the analysis includes a control for whether the student changed elementary schools in the past year. Finally, the analysis includes controls for student gender and whether the student enrolled in LAUSD after kindergarten.
Classroom peers may influence student academic progress. Individual students might learn less in classes with large concentrations of disadvantaged students or ELLs. The peer composition is based on proportion of students with particular individual
characteristics, for example, the proportion of beginning ELLs or the proportion of parents with college degrees. The analysis included the full range of measured individual characteristics. In addition, we computed the mean prior year ELA and math test scores for the classroom peers of each student in each year. Individual students may learn more in a given year if they are surrounded by students with stronger prior preparation and achievement.
For privacy reasons, our dataset does not include student-level race/ethnicity and eligibility for free/reduced lunch. This impediment is partially offset by the detailed information on parental education which provides a strong indication of student socio-economic status. Grade-level information on race/ethnicity was available from CBEDS and was included in the analysis.
The initial dataset included all students in grades 2 through 5 for school years 2003-04 through 2009-10 (for simplicity, we subsequently refer to the cohort by spring test year). We excluded all special education students in special education classrooms. We felt that these classrooms deserved separate analysis from that of general education classrooms, and our focus here was on general education classrooms. This exclusion dropped about 1 percent of records from the database.
10
was scaled back from about 1.42 million student/year records to 0.92 million student/year records.
The remaining exclusions were much less important. About 1 percent of students had missing test scores, teacher identifiers, student identifiers, or school identifiers. About half of a percent of the remaining students were enrolled in a school with fewer than 100 students in a particular year. The average LAUSD elementary school had 536 students in grades 2 through 5 over this period, and the excluded schools were unusually small for the district. About 7 percent of the remaining student records were excluded because they had missing prior year scores in either ELA or math. Finally, we excluded about half of a percent of the remaining students, because their class size was 10 or less.
[image:11.612.144.466.324.731.2]The final analysis dataset included 842,533 student/year records. This includes 412,825 individual students, 11,462 teachers, and 473 schools. The means and standard deviations of the analysis variables are reported in Table 3.2.
Table 3.2
Means and Standard Deviations of Analysis Variables
Student or Class Variable Mean
Standard Deviation
ELA Score (Standardized) 0.0754 0.9581
Math Score (Standardized) 0.0747 0.9608
Lagged ELA 0.0700 0.9636
Lagged Math 0.0736 0.9571
Class Size 23.5246 5.1484
Enrolled in Grade 4 0.3337 0.4715
Enrolled in Grade 5 0.3388 0.4733
Spring 2006 Test 0.1769 0.3816
Spring 2007 Test 0.1662 0.3723
Spring 2008 Test 0.1607 0.3672
Spring 2009 Test 0.1577 0.3645
Spring 2010 Test 0.1517 0.3587
Title I 0.8760 0.3296
Female 0.4736 0.4993
Beginning ELL 0.0176 0.1316
Early Intermediate ELL 0.0547 0.2274
Intermediate ELL 0.1914 0.3934
Early Advanced ELL 0.1476 0.3547
Advanced ELL 0.0508 0.2196
High School Graduate 0.2005 0.4004
Some College 0.1291 0.3353
College Graduate 0.0959 0.2945
Graduate School 0.0476 0.2128
Missing Parent's Education 0.2678 0.4428
Entered LAUSD after Kindergarten 0.2463 0.4309
First Year in This School 0.0872 0.2822
First Year in This School Missing 0.0012 0.0347
11
Hispanic (Share in Grade) 0.7453 0.2663
Asian/Pacific Islander (Share in Grade) 0.0398 0.0810
Title I (Share) 0.8744 0.3046
Female (Share) 0.4711 0.1228
Beginning ELL (Share) 0.0244 0.0551
Early Intermediate ELL (Share) 0.0537 0.0895
Intermediate ELL (Share) 0.1840 0.1670
Early Advanced ELL (Share) 0.1422 0.1243
Advanced ELL (Share) 0.0499 0.0822
High School Graduate (Share) 0.1980 0.1285
Some College (Share) 0.1287 0.1059
College Graduate (Share) 0.0963 0.1199
Graduate School (Share) 0.0476 0.0872
Missing Parent's Education (Share) 0.2740 0.2443 Entered LAUSD after Kindergarten (Share) 0.2765 0.1468 First Year in This School (Share) 0.0809 0.1178 First Year in This School Missing (Share 0.0643 0.0669
Mean Prior-Year ELA 0.0694 0.5917
Mean Prior-Year Math 0.0735 0.5492
Note: The omitted reference categories are enrolled in 3rd grade, Spring 2005 test year, not Title I, not female, not ELL, parents not high school graduates, entered LAUSD in kindergarten, enroll in current school last year, non-black and non-Hispanic (share in grade), non-Title I (share), not female (share), not ELL (share), parents not high school graduates (share), enter LAUSD in kindergarten (share), enrolled in current school last year (share).
4. STATISTICAL APPROACH
An education production function is the underlying basis for nearly all recent studies of student achievement. These modeling approaches link the current student achievement level to current family, teacher, and school inputs as well as to inputs provided in
previous time periods (Buddin and Zamarro, 2008; Buddin and Zamarro, 2009a; Buddin and Zamarro, 2009b; Buddin and Zamarro, 2009c).
In earlier work, we estimated three different types of models in our studies and compare the sensitivity of results across different models. As in much empirical research, the most flexible models involve restrictions that may offset the benefits from their flexibility. In our studies, we generally found that key results were insensitive to model specification.
Our various student achievement models differ in how they incorporate information on prior student background and preparation. The modeling approaches control for prior learning and isolate the contribution of current teacher and school inputs to student learning. The three models are:
1. Contemporaneous value-added. Student achievement is estimated as a function of student and teacher inputs with student and teacher fixed effects:
12
where T is the test score for the ith student assigned to the jth teacher in year t; x is a set of time-varying characteristics of students, teachers, and schools; β is an estimated parameter, α is a student fixed effect, φ is a teacher fixed effect, and εcontains student and teacher time variant unobserved
characteristics.5 With repeated observations on each student, the student fixed effect controls for time-invariant student differences and isolates how
contemporaneous changes in teachers and other variables affect achievement. 2. Value-added gains. This model focuses on student achievement gains from
one year to the next. Annual gains in student achievement are modeled as a function of contemporaneous student and teacher inputs. The model includes a student fixed effect to control for time-invariant student factors that influence the magnitude of student gains each year. The model also contains a teacher fixed effect to isolate the contribution of individual teachers to improvements in student learning. The model is similar to the contemporaneous value-added model except that the dependent variable is the gain in student achievement:
Tijt−Tij t, 1− =xijtβ α φ ε+ + +i j ijt
Rothstein (2007) and Kane and Staiger (2008) have argued that including student fixed effects in the achievement equation tends to distort the size of teacher effects, because the student fixed effects partially absorb the effects of teachers on student performance.
3. Lagged student achievement. This model explicitly estimates current achievement as a function of achievement in the previous year. Unlike the other two models, prior achievement enters this model in a flexible manner. The model could include a student fixed effect or student characteristics to adjust for student heterogeneity. Recent research has shown that controls for student characteristics are preferred to student fixed effects in predicting teacher performance from year to year in both experimental and
non-experimental settings (Kane and Staiger, 2008; McCaffrey et al., 2009).6 The formal model is
Tijt =Tijt 1 ijt− λ+x β1+ φ εj+ ijt,
where observed time-invariant student characteristics are incorporated in x. The values of λ reflect the persistence of student learning inputs from one year to the next. The contemporaneous value-added model implicitly assumes that λ is zero, so knowledge acquired in one year does not persist into the next. The value-added gains model implicitly assumes that λ is -1, so knowledge from one year fully persists into the next.
Each of these methods is used in recent studies of teacher effectiveness.
5 Modeling issues are discussed in more detail in our earlier paper on student achievement in elementary school (See Buddin and Zamarro, 2009).
13
The lagged achievement model is the most flexible and is the focus of our analysis in this study. We used both lagged ELA and math scores as controls for prior year skills of the student at the start of the school year. The teacher effects were partitioned into a
“persistent” effect that did not vary from year to year, and a non-persistent classroom effect that reflects differences in annual teacher performance and classroom factors not measured in the control variables.
The model is estimated with both fixed teacher-year effects and with a mixed model. In the fixed-effects version, the model includes a teacher by year fixed effect. Separate persistent and classroom effects are derived from the estimates and shrunk using
empirical Bayes methods (Kane and Staiger, 2008). The mixed model version estimates separate best linear unbiased predictors (BLUPs) for both the persistent and
non-persistent classroom effects. The results were similar for the two approaches, and we focus on the results from the mixed model below.7
We estimate the models in two stages to avoid the potential problems from unmeasured teacher characteristics and to highlight variations in teacher effectiveness.8 In the first stage, we estimate value-added teacher effectiveness. In the second stage, we examine how teacher characteristics explain differences in teacher effectiveness. Our dependent variables in these second step regressions are statistical estimates of the true measures of teacher quality and are measured with error. To obtain efficient estimates of the teacher parameters, we perform Feasible Generalized Least Squares (FGLS) regressions using weights that reflect measurement error in the first stage (Borjas, 1987).
Value-add estimates are important if some teachers are substantially more effective than others. Value-added methods inherently produce a rank ordering of teacher effectiveness, but the ordering is unimportant if all teachers are similarly effective. If some teachers are more effective than others with similar students and similar classroom peers, then schools and districts can explore options to ratchet up teachers effectiveness. These options include follow up studies of the instructional practices of effective teachers, targeted professional development, and incentives to improve teaching effectiveness. On a less formal note, teachers may benefit from knowing their relative effectiveness, exploring why professional colleagues are more successful, and discussing possible approaches to improving their effectiveness.
The Gates Foundation is sponsoring a study of teacher effectiveness that is exploring why some teachers are more effective than others at improving student achievement (MET, 2010). The study is tracking the classroom performance of over 3,000 teachers in six urban school districts. A key aspect of the project is measuring the classroom practices of teachers and assessing how those practices relate to value-added teacher effectiveness.
7 Kane and Staiger (2008) and McCaffrey et al. (2009) also find similar results from the two methods in their studies.
14
A concern for value-added estimation is that the teacher or school effects might vary substantially for alternative specifications of the statistical model. This might occur because some students are inherently more difficult to teach and students are not
randomly assigned to classrooms. If an individual teacher is assigned to a difficult class, their value-added score might say more about the mix of students in their class than about the effectiveness of the individual teacher. Prior student test score is a key initial control for students assigned to each teacher, and the model explicitly controls for the prior year achievement of students in a teachers class. In addition, additional controls for student characteristics and the characteristics of classroom peers adjust for potential differences in how a similar student in a similar classroom would advance in an academic year.
Our analysis examines how teacher effects vary with alternative controls for student and peer characteristics. Four different specifications are considered in ELA and math. Each model includes estimates of persistent teacher effects as well as teacher by year or classroom effects. Each successive specification adds new controls to the previous specification.
1. Basic. This specification examines individual student test scores in ELA and math each year as a function of prior year scores by the student in each subject, class size, grade, and year.
2. Plus Student Characteristics. This version adds characteristics of individual students that may inherently impede or accelerate achievement gains
regardless of teacher performance.
3. Plus Student Peers. Achievement may also be influenced by the composition of students in a class. This specification adjusts for the mix of students in each class.
4. Plus Average Prior Test Scores. Finally, the prior academic success of peers may have some effect on student success in a given year, even conditional on his or her background and the other characteristics of student peers.
The goal of the specifications is to adjust for differences in students assigned to individual teachers and improve the accuracy of value-added estimates by making different classroom “similar” to one another.
We are missing potentially important variables like student motivation and parental support, since these variables are not measured in our data. Many of these factors are implicitly embedded in the student prior test scores and those of their peers. If some teachers are assigned more motivated students or students with more supportive parents, then those teachers might receive better value-added scores that simply reflect a favorable sorting of students. The bias would not reflect the sorting per se, however, but rather it would occur only if the students did better conditional on their prior test scores and other factors in the model specifications. In addition, teachers may appropriately be labeled as “more” effective if they are able to improve the motivation of their students.
We also estimated an alternative version of the model that controls for school effects instead of teacher effects. In this version, φj is the effect of school j on student
15
considerably from school to school. Alternatively, if effective teachers are broadly dispersed across schools, then school quality may vary little from school to school.
In principal, the models could be combined with both teacher and school effects. We observe relatively few teachers switching schools over time, however, so it is difficult to identify separate teacher and school effects in a combined model.
5. RESULTS
This section contains two subsections. First, we examine whether some teachers are more effective than others at improving student achievement. We compare teacher effects before and after controlling for student and classroom peer characteristics. Next, we compare the academic progress of students at different elementary schools. This
subsection examines whether some schools are more effective than others at improving student achievement, after controlling for the mix of students assigned to different schools.
Estimation of Teacher Effects
The ELA and math regressions for the four model specifications are reported in Tables 5.1 and 5.2, respectively. The equations estimate the relationship between individual student achievement and various student and classroom characteristics. Given the large sample size, most variables are statistically significant even though many of the effects are small.
The coefficients on prior test scores reflect the partial persistence of learning from one year to the next. As expected, prior year ELA has a strong effect on ELA in the current year. Similarly, prior year math scores have a strong effect on current math scores. The estimated rate of decay (λ) in each model is significantly greater than zero and less than one, suggesting that the flexibility of the partial persistence model is appropriate for the model. The results also show some cross-subject spillover of prior ELA and math scores on scores of the alternative subjects.
Student characteristics have the expected effects on achievement. Even conditional on prior achievement, Title I and students with less educated parents make slower progress than other students. Beginning ELL students gain less than English proficient students, but these students perform relatively better in math than in ELA. ELL students fare much better as their English skills improve. Ironically, advanced ELL students make stronger achievement gains in both ELA and math than comparable other students that are English proficient.9
16
Table 5.1
ELA Student Achievement Regressions for Four Specifications
17
Intermediate ELL (Share) -0.0452* -0.0043 (0.0084) (0.0091) Early Advanced ELL (Share) -0.0582* -0.0366* (0.0105) (0.0105) Advanced ELL (Share) -0.0243 -0.0091 (0.0159) (0.0159) High School Graduate (Share) -0.0077 -0.0097 (0.0118) (0.0118) Some College (Share) -0.0083 -0.0123 (0.0138) (0.0138) College Graduate (Share) 0.1491* 0.1300* (0.0158) (0.0159) Graduate School (Share) 0.1428* 0.1132* (0.0205) (0.0206) Entered LAUSD after Kindergarten (Share) -0.0557* -0.0445* (0.0089) (0.0090) First Year in This School (Share) -0.0441* -0.0418* (0.0090) (0.0090)
Mean Prior-Year ELA 0.0900*
(0.0059)
Mean Prior-Year Math -0.0594*
(0.0054)
[image:18.612.106.509.556.722.2]Constant -0.0406* 0.1129* 0.2297* 0.2001* (0.0071) (0.0077) (0.0181) (0.0183) Standard Deviation(Teacher) 0.1817* 0.1671* 0.1593* 0.1577* (0.0017) (0.0016) (0.0016) (0.0016) Standard Deviation(Classroom) 0.1467* 0.1429* 0.1415* 0.1412* (0.0010) (0.0010) (0.0010) (0.0010) Standard Deviation(Residual) 0.4951* 0.4881* 0.4881* 0.4881* (0.0004) (0.0004) (0.0004) (0.0004) Note: * Statistically significant at 5% level. The omitted reference categories are enrolled in 3rd grade, Spring 2005 test year, not Title I, not female, not ELL, parents not high school graduates, entered LAUSD in kindergarten, enroll in current school last year, non-Black and non-Hispanic (share in grade), non-Title I (share), not female (share), not ELL (share), parents not high school graduates (share), enter LAUSD in kindergarten (share), enrolled in current school last year (share).
Table 5.2
Math Student Achievement Regressions for Four Specifications
18
19
First Year in This School (Share) -0.0654* -0.0719* (0.0109) (0.0109)
Mean Prior-Year ELA 0.0997*
(0.0072)
Mean Prior-Year Math -0.1192*
(0.0065)
Constant 0.0317* 0.1213* 0.1743* 0.1816* (0.0085) (0.0093) (0.0232) (0.0234) Standard Deviation(Teacher) 0.2522* 0.2504* 0.2447* 0.2469* (0.0022) (0.0022) (0.0021) (0.0021) Standard Deviation(Classroom) 0.1810* 0.1800* 0.1789* 0.1765* (0.0011) (0.0011) (0.0011) (0.0011) Standard Deviation(Residual) 0.5154* 0.5138* 0.5138* 0.5138* (0.0004) (0.0004) (0.0004) (0.0004) Note: * Statistically significant at 5% level. The omitted reference categories are enrolled in 3rd grade, Spring 2005 test year, not Title I, not female, not ELL, parents not high school graduates, entered LAUSD in kindergarten, enroll in current school last year, non-Black and non-Hispanic (share in grade), non-Title I (share), not female (share), not ELL (share), parents not high school graduates (share), enter LAUSD in kindergarten (share), enrolled in current school last year (share).
The peer variables show that students do better in some types of classrooms than in others. Student gains are inversely proportional to the percentage of black and Hispanic students in their school grade and directly proportional to the percentage of Asian/Pacific Islander students. The magnitude of these effects is small, however. For example, the coefficient of share of black students in grade is -0.21 in the Model 3 ELA specification. This means that a 10 percent increase in the share of black students would only reduce achievement gains by 0.02—i.e., large changes in peer composition generally translate into small effects on student outcomes.
The peer effects are generally weaker in ELA than in math. ELA achievement is inversely correlated with the concentration of ELLs in low proficiency categories, but math achievement is less sensitive to the mix of ELLs in the class. Similarly, a higher concentration of students from well-educated families improves ELA achievement but does little for math achievement.
The teacher effects are relatively stable from year to year in all four specifications. The correlations between current and prior year teacher effectiveness ranges is about 0.70 in ELA and 0.76 in math. The reliability of the estimates varies little from model to model.
In comparing the four models, the key issue is the changes in teacher effects under the alternative approaches. The random-effects parameters at the bottom of Table 5.1 and 5.2 (the shaded regions of the tables) show how the standard deviations in teacher effects differ as variables are added to the model. In the basic model (Model 1), the effect size for persistent teacher effects is 0.18 as compared with the transitory effect of 0.15 and the residual standard deviation of 0.50. As variables are added to the model, the variables are statistically significant and the size of the persistent teacher effect declines. The
20
the model without reducing the size of the residual variance. While the persistent teacher effect declines from 0.18 in Model 1 to 0.16 in Model 4, the magnitude of these effects is still large—an average student assigned to a teacher one standard deviation above normal is predicted to rise to the 56th percentile of the district distribution in a single year.
The math effects are larger and less sensitive to the inclusion of student and peer characteristics in the model. The residuals decline little as more models are added. The persistent teacher effect is 0.25 in the basic model, and it is only slightly smaller in Model 4. The results suggest that a typical student assigned to a math teacher that is one
standard deviation above average is expected to improve by about 10 percentage points.
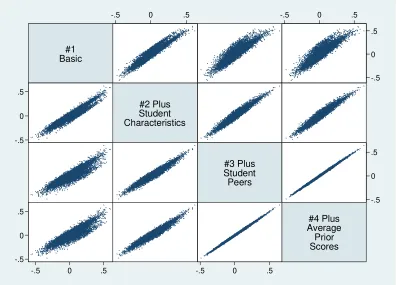
Another way to compare the teacher effects is to plot the effects from the alternative models against one another. In both ELA and math, the correlations between the teacher effects from the alternative models are over 90 percent.10 Figures 2.1 and 2.2 show the similarity of teacher effects with the different sets of control variables. The correlations are particularly strong in math, where the teacher effects are less sensitive to the addition of student and peer characteristics, than in ELA.
#1 Basic
#2 Plus Student Characteristics
#3 Plus Student Peers
#4 Plus Average Prior Scores
-.5 0 .5
-.5 0 .5 -.5
0 .5
-.5 0 .5
-.5 0 .5
-.5 0 .5 -.5
0 .5
[image:21.612.94.491.325.610.2]-.5 0 .5
Figure 5.1. Comparison of ELA Teacher Effects under Alternative Models
21
#1 Basic
#2 Plus Student Characteristics
#3 Plus Student Peers
#4 Plus Average Prior Scores
-1 0 1
-1 0 1
-1 0 1
-1 0 1
-1 0 1
-1 0 1
-1 0 1
[image:22.612.94.489.90.376.2]-1 0 1
Figure 5.2. Comparison of Math Teacher Effects under Alternative Models
The results suggest that teacher effects are relatively insensitive to controls for student and classroom heterogeneity. Most teachers do similarly in ELA and math on the basic model as in the models with stronger controls for heterogeneity. Perhaps this result would change, if the district collected more detailed information on students or classrooms, but the evidence here is that the effects from the basic model are similar to those with more controls for LAUSD elementary schools.
In the remainder of this subsection, we focus on the results from Model 4. The results from the other specifications are similar, but we focus our discussion on the model with the broadest controls for student heterogeneity and the smallest bias in estimated teacher effects.
How large are differences in teacher quality?
Figure 2.3 shows histogram plots of the teacher effects for ELA and math. As suggested by the regression tables, teacher effects are much more variable in math than in ELA. In both cases, student achievement could be substantially improved if teachers on the lower end moved up modestly in the distribution of teacher effectiveness.
22
1) average annual growth in achievement, 2) gaps in student achievement by demographic groups, and 3) gains of educational interventions.
0
2
4
6
8
P
e
rc
en
t of
Te
ac
he
rs
-.6 -.4 -.2 0 .2 .4 .6 Teacher Z-Score
ELA
0
2
4
6
8
P
e
rc
en
t of
Te
ac
he
rs
-.6 -.4 -.2 0 .2 .4 .6 Teacher Z-Score
[image:23.612.93.491.115.395.2]Math
Figure 5.3. Histograms of ELA and math teacher effects
In nationally normed tests, Hill et al. (2008) measured the effect size of learning gains from year to year. They found gains were larger in early grades as compared with higher grades and were higher in math than in ELA. At the 4th grade level, the average annual achievement gain has an effect size of 0.40 in ELA and 0.56 in math. The LAUSD teacher effects are large relative to the national average learning gains in ELA and math.
The second benchmark looks at the academic achievement gaps for disadvantaged groups. At the 4th grade level, Hill et al. (2008) report an ELA effect size gap between black/white students of -0.83, between Hispanic/white students of -0.77, and between eligible/ineligible students in free/reduced lunch program of -0.74. The gap is about 0.10 higher in math effect sizes.
23
The third benchmark looks at the effect sizes of school reforms implemented at the elementary school level. The average effect size of these interventions is 0.33 (Hill et al., 2008). By this third metric, as with the two earlier ones, the magnitude of estimated teacher effects is large.
How Precise of the Estimates of Teacher Effects?
Tables 5.1 and 5.2 show large persistent teacher effects, but they also indicate that teacher effectiveness varies substantially from year to year and that the standard error of the model residuals are large even in the most complete model. These factors translate into imprecise point estimates for individual teachers.
As part of the analysis, we estimated standard errors and confidence intervals for teacher effects. Figure 5.4 shows that the magnitude of the standard errors is strongly related to the number of classes observed in our data.11 With more classes or years of data, the precision of the estimates improves, because idiosyncrasies of individual students and class dynamics average out. In ELA, the typical standard error is 0.12 for teachers with one year of teaching as compared with 0.08 for teachers with four years of teaching. The average standard error of math teacher effects is 0.16 for teachers with one class as compared with 0.10 for teachers with four classes.
24 .0 5 .1 .1 5 .2 S tan da rd D e v iat io n o f T e a c h e r E ff e c t
1 2 3 4 5 6 Number of Classes Taught (Spring 2005-10)
ELA .0 5 .1 .1 5 .2 S tan da rd D e v iat io n o f T e a c h e r E ff e c t
1 2 3 4 5 6 Number of Classes Taught (Spring 2005-10)
Math
[image:25.612.94.491.88.369.2]Figure 5.4. Box Plots for Standard Deviation of Teacher Effects by the Number of Classes Taught
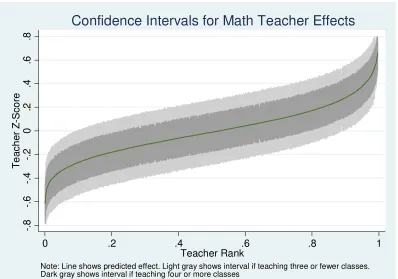
Figures 5.5 and 5.6 show the 90 percent confidence interval for the teacher effects estimates in ELA and math, respectively. In each panel, the teachers are sorted by their estimated performance measure from lowest to highest. The estimates are plotted as a solid line. The 90% confidence interval for the estimates (the interval that is likely to contain the “true” value for 90% of potential samples) is shown by the vertical lines. The light grey shading shows the intervals for teachers with fewer than four classes taught and the dark grey area shows the intervals for teachers with four or more classes taught.
A z-score of zero corresponds to an average teacher. This “average” reflects the typical student achievement outcomes for elementary students in the district. The LAUSD “average” may be more or less effective than the average in other districts or for the state as a whole. The CST test is not normed against a nationally representative population, so we are unable to assess whether the typical LAUSD student is doing better or worse than typical students in other districts.
25
classes. Overall, about 14 percent of teachers have confidence intervals entirely below zero and 17 percent have intervals entirely above zero.
Confidence intervals are also large in math, but teachers fall into more distinct effectiveness categories in math than in ELA. Among teachers with few classes, 17 percent have confidence intervals entirely below zero and 14 percent have intervals entirely above zero. For teachers with four or more classes, 24 percent of their confidence intervals are completely below zero and 30 percent are entirely above zero. Overall, 22 percent of math teachers have confidence intervals entirely below average and 25 percent have intervals entirely above average.
-.
6
-.
4
-.
2
0
.2
.4
.6
Te
a
c
h
e
r
Z-S
c
o
re
0 .2 .4 .6 .8 1
Teacher Rank
Note: Line shows predicted effect. Light gray shows interval if teaching three or fewer classes. Dark gray shows interval if teaching four or more classes
[image:26.612.92.493.227.506.2]Confidence Intervals for ELA Teacher Effects
26
-.
8
-.
6
-.
4
-.
2
0
.2
.4
.6
.8
Te
a
c
h
e
r
Z-S
c
o
re
0 .2 .4 .6 .8 1
Teacher Rank
Note: Line shows predicted effect. Light gray shows interval if teaching three or fewer classes. Dark gray shows interval if teaching four or more classes
[image:27.612.94.492.73.352.2]Confidence Intervals for Math Teacher Effects
Figure 5.6. Estimated Teacher Z-Scores in ELA with 90% Confidence Intervals
Summary of Results on Teacher Effectiveness
Teacher effectiveness varies substantially from teacher to teacher. Students fare much better with some teachers than with others, and the gap is larger in math than in ELA. The reliability of the estimates is high—some teachers do much better than others year after year. Teacher effects are relatively insensitive to the mix of student and peer effects included in the estimation—this is especially true in math. The precision of teacher estimates is sensitive to how many classes are taught by a teacher. This reflects both the number of students taught over time and changes in classroom dynamics from year to year. Value-added methods do not provide pinpoint estimates of teacher effectiveness, but they do indicate broad groups of teachers that are much more effective at improving achievement than others.
Teacher Characteristics and Student Achievement
27
Table 5.4 and 5.5 show how value-added measures of teacher effectiveness are related to teacher characteristics. The estimates are based on annual BLUP effects for individual teachers. For comparison purposes, the tables report results for each of the four
specifications.
In ELA, most teacher characteristics are weakly related to teacher effectiveness and the relationship declines for model specifications with more controls for student and peer characteristics. New teachers have some difficulty in the first year or two of teaching, but they subsequently have achievement results similar to those of teachers with 10 or more years of experience. The magnitude of the experience differential in Model 4 is only about -0.05, so an average student assigned to a first year teacher will score only about 2 percentage points lower than a student assigned to a veteran teacher with 10 or more years of teaching experience. The effects of advanced degrees are statistically significant, but masters’ degrees only increase student achievement for the average student by about half of a percentage point. Teachers with full credentials are neither more nor less effective than probationary teachers.
The math results in Table 5.5 mirror those in ELA. Small experience effects decline in magnitude and significance for models with stronger controls for classroom
heterogeneity. The student achievement rankings of students assigned to a first year teacher are only one percentage point lower than those of comparable students assigned to a teacher with 10 or more years of experience. Among math teachers, those with intermediate levels of experience (3 to 9 year) are actually slightly more effective than older teachers. Math teachers with master’s degrees are slightly more effective than teachers with only a bachelor’s degree, but the expected gain in student ranking is less than one percentage point. Teaching credentials are unrelated to teacher effectiveness in math.
[image:28.612.131.481.571.712.2]The models also control for teacher gender and race/ethnicity. As with other variables in Tables 5.4 and 5.5, the size of the coefficients for these is small and declines with the addition of controls for student and peer characteristics. The results suggest that women are slightly more effective than men in both subjects. Black teachers are slightly less effective than white non-Hispanic teachers. Hispanic and Asian/Pacific Islander teachers are slightly more effective than white non-Hispanic teachers.
Table 5.4
Determinants of Unobserved Heterogeneity in ELA Teacher Effectiveness
Teacher Characteristic Model 1 Model 2 Model 3 Model 4 Experience 1 year -0.0775* -0.0714* -0.0506* -0.0489*
(0.0067) (0.0062) (0.0059) (0.0058) Experience 2 years -0.0460* -0.0425* -0.0257* -0.0238*
(0.0062) (0.0057) (0.0055) (0.0055) Experience 3-5 years -0.0184* -0.0149* -0.0024 -0.0010
(0.0048) (0.0044) (0.0043) (0.0042) Experience 6-9 years -0.0007 0.0012 0.0083* 0.0090*
28
Bachelor's + 30 semester hours 0.0041 0.0033 0.0026 0.0026 (0.0042) (0.0039) (0.0038) (0.0037)
Master's 0.0206* 0.0175* 0.0158* 0.0147*
(0.0070) (0.0064) (0.0062) (0.0062) Master's + 30 semester hours 0.0091 0.0118* 0.0130* 0.0128*
(0.0056) (0.0052) (0.0051) (0.0050)
Doctorate -0.0097 -0.0112 -0.0155 -0.0157
(0.0216) (0.0194) (0.0182) (0.0178) Full Teaching Credential 0.0114 0.0118 0.0003 -0.0004
(0.0085) (0.0083) (0.0082) (0.0081) Black/Afr. Amer. -0.0517* -0.0506* -0.0150* -0.0133*
(0.0068) (0.0064) (0.0063) (0.0062)
Hispanic -0.0505* -0.0135* 0.0069 0.0088*
(0.0047) (0.0043) (0.0042) (0.0042)
Asian/Pac. Isl. 0.0295* 0.0291* 0.0209* 0.0219*
(0.0068) (0.0062) (0.0060) (0.0059)
Female 0.0540* 0.0452* 0.0371* 0.0359*
(0.0048) (0.0044) (0.0043) (0.0042)
Constant -0.0136 -0.0233* -0.0244* -0.0245*
(0.0099) (0.0095) (0.0093) (0.0092)
R-squared 0.0383 0.0255 0.0125 0.0121
N 36464 36464 36464 36464
[image:29.612.134.481.441.713.2]Note: * Statistically significant at 5% level. The omitted reference categories are 10 or more years of experience, a bachelor’s degree with less than 30 additional semester hours, not a full teaching credential, White non-Hispanic, and male.
Table 5.5
Determinants of Unobserved Heterogeneity in Math Teacher Effectiveness
Teacher Characteristics Model 1 Model 2 Model 3 Model 4 Experience 1 year -0.0639* -0.0608* -0.0337* -0.0340*
(0.0094) (0.0093) (0.0091) (0.0091) Experience 2 years -0.0113 -0.0096 0.0112 0.0103
(0.0085) (0.0084) (0.0083) (0.0083) Experience 3-5 years 0.0203* 0.0215* 0.0363* 0.0373* (0.0065) (0.0065) (0.0064) (0.0064) Experience 6-9 years 0.0236* 0.0245* 0.0327* 0.0333* (0.0053) (0.0053) (0.0052) (0.0052) Bachelor's + 30 semester hours 0.0115 0.0105 0.0102 0.0108
(0.0059) (0.0059) (0.0058) (0.0058)
Master's 0.0093 0.0056 0.0051 0.0054
(0.0093) (0.0092) (0.0091) (0.0092) Master's + 30 semester hours 0.0147 0.0158* 0.0166* 0.0178*
(0.0078) (0.0078) (0.0077) (0.0077)
Doctorate -0.0154 -0.0171 -0.0191 -0.0175
(0.0327) (0.0323) (0.0316) (0.0315) Full Teaching Credential 0.0162 0.0174 0.0039 0.0034
(0.0131) (0.0131) (0.0131) (0.0132) Black/Afr. Amer. -0.0910* -0.0845* -0.0388* -0.0393*
29
Hispanic -0.0033 0.0121 0.0188* 0.0204*
(0.0065) (0.0064) (0.0064) (0.0064)
Asian/Pac. Isl. 0.0755* 0.0748* 0.0646* 0.0677*
(0.0091) (0.0091) (0.0089) (0.0090)
Female 0.0319* 0.0276* 0.0218* 0.0217*
(0.0068) (0.0068) (0.0067) (0.0068)
Constant -0.0310* -0.0353* -0.0337* -0.0342*
(0.0149) (0.0149) (0.0149) (0.0150)
R-squared 0.0240 0.0231 0.0140 0.0149
N 36464 36464 36464 36464
Note: * Statistically significant at 5% level. The omitted reference categories are 10 or more years of experience, a bachelor’s degree with less than 30 additional semester hours, not a full teaching credential, White non-Hispanic, and male.
In both ELA and math, teacher qualifications and other characteristics explain little of the variation in teacher effectiveness. The r-squared shows that the models are only
explaining less than 1.5 percent of the variance in value-added teacher effectiveness.
We also explored the distribution of value-added across schools. Table 3.1 showed that high proportions of income and at-risk populations were concentrated in many low-performing schools. API reflects proficiency levels of students at a point in time and not achievement or proficiency gains of students over time.
An important issue is whether performing schools disproportionately have low-performing teachers with low added scores. The results show that teacher value-added is only slightly better at the best schools (as measured by API) in the district than at the worst schools. In ELA, teacher value added is 0.02 higher at elementary schools in the top API quartile of the district as compared with schools in the bottom quartile. In math, the gap between low- and high performing schools is about 0.06. These effects mean that a typical student at a high-performing school is likely to improve by about one percentage point in ELA and two percentage points in math relative to a student at a low-performing school. This evidence suggests that teachers at low-low-performing schools are having comparable success in raising student achievement relative to other teachers at high performing schools. Effective teachers are broadly dispersed across schools in the district, so student achievement gains are not focused in a few suburban schools.
Estimation of School Effects
Tables 5.6 and 5.7 show the regression results for the four alternative model
specifications controlling for school effects instead of teacher effects. As expected, the coefficients on prior test scores, student characteristics, and classroom peer variables are similar to those reported in Tables 5.1 and 5.2. While many student- and peer-level factors are statistically significant, the magnitude of these effects is relatively small after controlling for each student’s prior year achievement scores.
30
compared with a standard deviation for teachers of 0.18. These smaller school effects trail off substantially as student- and peer-variables are added to the regression model. In Model 4, a standard deviation of school effects is only 0.04 as compared with the Model 4 teacher effect in ELA of 0.16. The small differences in ELA achievement gains from school to school are largely mitigated by the composition of students at different schools. These school effects translate into small differences in student achievement from school to school—the results suggest that moving a student from an average school to a school one standard deviation above average will only improve the student’s achievement by about one-and-a-half percentage points from 0.500 to 0.515.
[image:31.612.107.508.341.739.2]The math school effects are also much smaller than those for teachers, but these school effects are insensitive to the addition of controls for student and peer factors. School math effects are 0.08 in both Model 1 and Model 4. These schools effects are one third of those for math teachers in the district. The math school effects mean that a one standard deviation in school quality is associated with a three percentage point gain in student achievement.
Table 5.6
ELA School Effects on Student Achievement Regressions for Four Specifications
31
Entered LAUSD after Kindergarten 0.0197* 0.0223* 0.0225* (0.0014) (0.0014) (0.0014) First Year in This School -0.0300* -0.0175* -0.0181* (0.0021) (0.0022) (0.0022) Black (Share in Grade) -0.0628* -0.0610* (0.0172) (0.0162) Hispanic (Share in Grade) 0.0528* 0.0387* (0.0135) (0.0128) Asian/Pacific Islander (Share in Grade) 0.0820* 0.0578* (0.0292) (0.0279) Title I (Share) 0.0142 0.0432* (0.0080) (0.0079) Female (Share) 0.0265* 0.0070 (0.0058) (0.0058) Beginning ELL (Share) -0.0858* 0.0220 (0.0133) (0.0137) Early Intermediate ELL (Share) -0.0804* 0.0305* (0.0092) (0.0097) Intermediate ELL (Share) -0.0888* -0.0132* (0.0050) (0.0055) Early Advanced ELL (Share) -0.0564* -0.0173* (0.0062) (0.0063) Advanced ELL (Share) 0.0614* 0.0834* (0.0094) (0.0094) High School Graduate (Share) 0.0031 0.0020 (0.0077) (0.0076) Some College (Share) 0.0296* 0.0232* (0.0089) (0.0089) College Graduate (Share) 0.2462* 0.1942* (0.0099) (0.0100) Graduate School (Share) 0.2818* 0.2162* (0.0130) (0.0131) Entered LAUSD after Kindergarten (Share) -0.0822* -0.0564* (0.0055) (0.0056) First Year in This School (Share) -0.1184* -0.1051* (0.0064) (0.0064)
Mean Prior-Year ELA 0.1047*
(0.0036)
Mean Prior-Year Math -0.0428*
(0.0033)
non-32
[image:33.612.106.507.157.718.2]Black and non-Hispanic (share in grade), non-Title I (share), not female (share), not ELL (share), parents not high school graduates (share), enter LAUSD in kindergarten (share), enrolled in current school last year (share).
Table 5.7
Math School Effects on Student Achievement Regressions for Four Specifications
33
(0.0148) (0.0152) Early Intermediate ELL (Share) -0.0792* -0.0053 (0.0102) (0.0108) Intermediate ELL (Share) -0.0572* -0.0145* (0.0056) (0.0061) Early Advanced ELL (Share) 0.0048 0.0344* (0.0069) (0.0070) Advanced ELL (Share) 0.1416* 0.1674* (0.0105) (0.0105) High School Graduate (Share) 0.0058 0.0034 (0.0086) (0.0086) Some College (Share) 0.0473* 0.0409* (0.0101) (0.0101) College Graduate (Share) 0.2366* 0.2137* (0.0111) (0.0113) Graduate School (Share) 0.2770* 0.2450* (0.0147) (0.0148) Entered LAUSD after Kindergarten (Share) -0.1063* -0.0956* (0.0062) (0.0063) First Year in This School (Share) -0.1901* -0.1914* (0.0072) (0.0073)
Mean Prior-Year ELA 0.1409*
(0.0040)
Mean Prior-Year Math -0.1215*
(0.0037)
Constant -0.0376* 0.0575* 0.0093 -0.0031 (0.0073) (0.0084) (0.0190) (0.0192) Standard Deviation(Persistent School) 0.0831* 0.0828* 0.0796* 0.0829* (0.0035) (0.0035) (0.0035) (0.0036) Standard Deviation(Non-Persistent School) 0.0946* 0.0942* 0.0946* 0.0943* (0.0016) (0.0016) (0.0016) (0.0016) Standard Deviation(Residual) 0.5872* 0.5851* 0.5839* 0.5835* (0.0005) (0.0005) (0.0005) (0.0005) Note: * Statistically significant at 5% level. The omitted reference categories are enrolled in 3rd grade, Spring 2005 test year, not Title I, not female, not ELL, parents not high school graduates, entered LAUSD in kindergarten, enroll in current school last year, non-Black and non-Hispanic (share in grade), non-Title I (share), not female (share), not ELL (share), parents not high school graduates (share), enter LAUSD in kindergarten (share), enrolled in current school last year (share).
34
School math scores are less sensitive to model specification than ELA scores. The correlations between scores are generally over 90 percent.
#1 Basic
#2 Plus Student Characteristics
#3 Plus Student Peers
#4 Plus Average Prior Scores
-.1 0 .1
-.1 0 .1 -.1
0 .1
-.1 0 .1
-.1 0 .1
-.1 0 .1 -.1
0 .1
[image:35.612.110.503.105.385.2]-.1 0 .1
Figure 5.7. Comparison of ELA School Effects under Alternative Models
#1 Basic
#2 Plus Student Characteristics
#3 Plus Student Peers
#4 Plus Average Prior Scores
-.2 0 .2
-.2 0 .2 -.2
0 .2
-.2 0 .2
-.2 0 .2
-.2 0 .2 -.2
0 .2